My Account
My Slides
Search by Category
Templates
View All Templates
Download Template Slides
Leave Feedback
Login
Logout
Get Started
Browse all Slides
Browse all Slides
Create a FREE Account
Instant access to 1,000+ real slides from top companies like McKinsey, BCG, Goldman Sachs, Google and many more!
First Name
Last Name
Email
Password
I agree to all
Terms & Privacy Policy
Thank you! Your submission has been received!
Oops! Something went wrong while submitting the form.
Have an account?
Sign in
Spark Your Next Big Idea with New Presentation Templates
VIEW ALL Templates
Welcome,
Welcome
PRO
Show Featured Only
Checkbox 8
Companies
Mckinsey
Bain
BCG
EY
Deloitte
Accenture
PwC/Strategy&
JP Morgan
Goldman Sachs
Morgan Stanley
Citigroup
Deutsche Bank
Barclays
LEK
KPMG
Kearney
Oliver Wyman
Booz Allen Hamilton
Gartner
IPSOS
Nielsen
Slide type
Text Only
Linear Flow
Vertical Flow
Single Chart
Header Horizontal
Mixed Chart
Header Vertical
Pillar
Multiple Chart
Graphic
Agenda
Title
Table
Framework
Industry
Technology & Software
Artificial Intelligence
Financial Services
Retail & E-commerce
Consumer Goods
Industrial & Manufacturing
Transportation & Logistics
Telecommunications
Real Estate & Construction
Hospitality & Tourism
Professional Services
Education & Training
Media & Entertainment
Agriculture & Food Production
Healthcare & Pharmaceuticals
Environmental Services & Sustainability
Government & Public Sector
Use Case
Mergers and Acquisitions
Performance Metrics and KPIs
Client Case Studies
Competitive Landscape
Corporate Finance and Valuation
Product and Service Analysis
Customer and Market Segmentation
Organizational Structure and Change
Industry Overview
Regulatory and Compliance
Risk Assessment and Management
Investment Analysis
Organizational Structure and Change
Human Resources and Talent Management
Financial Performance
Market Analysis and Trends
Sales and Business Development
Human Resources and Talent Management
Clear all
Thank you! Your submission has been received!
Oops! Something went wrong while submitting the form.
Tag
View slide
The slide uses a mix of text, checklists, and a column chart to illustrate current capabilities and growth. Colors include blues and an accent of gray.
Financial Performance
Financial Services
Demonstrates the firm's current FX payments capabilities and future growth opportunities through market partnerships.
FX payments, market growth, partnerships, corporate payments, financial services, FX-as-a-Service, global mass pay
false
Financial Performance
Financial Services financial-services
Mixed Chart
JP Morgan
View slide
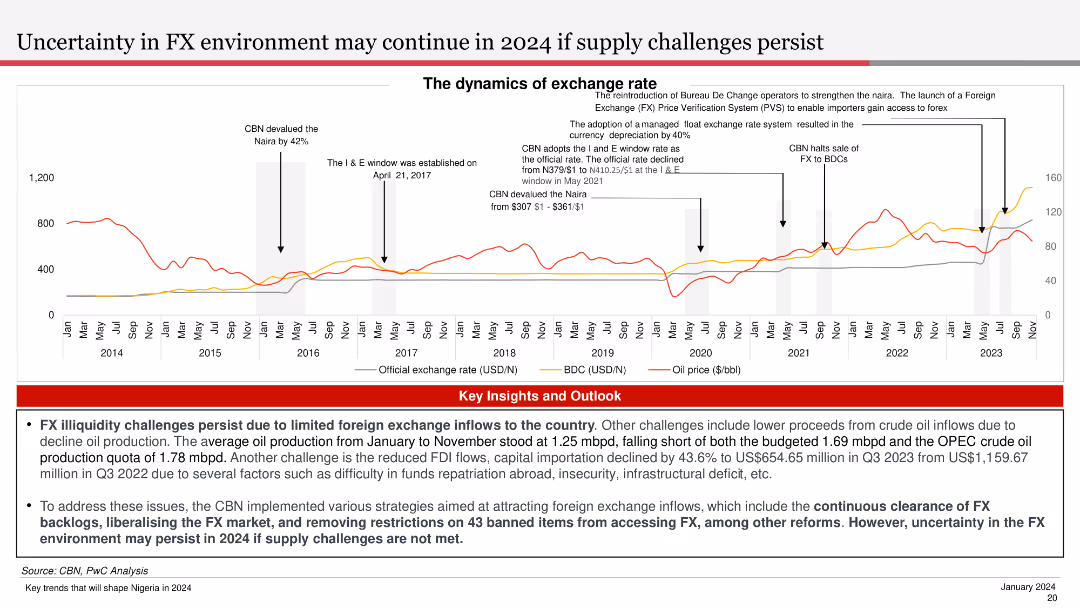
The slide features a line chart showing the exchange rate trends and oil price over time. It is visually complex, designed to provide a clear comparative analysis of key financial metrics.
Market Analysis and Trends
Financial Services
The slide discusses the dynamics of the exchange rate environment, highlighting challenges due to limited foreign exchange inflows and the impact of oil production and other factors.
FX, Exchange Rate, Oil Price, Trends, Dynamics
false
Market Analysis and Trends
Financial Services financial-services
Mixed Chart
PwC/Strategy&
View slide
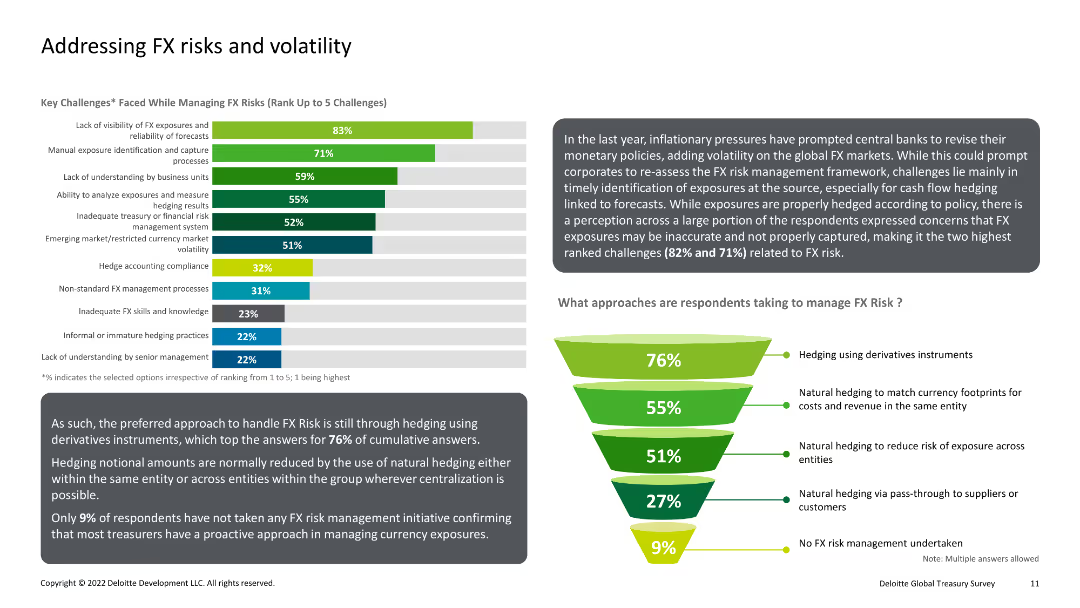
Bar chart and funnel diagram showing key challenges in managing FX risks and the approaches taken to mitigate them. The chart uses various shades of green and blue for visual differentiation.
Risk Assessment and Management
Financial Services
This slide discusses the main challenges faced in managing foreign exchange (FX) risks and volatility, and presents the preferred approaches used by respondents to address these challenges, including hedging strategies.
FX, Risks, Volatility, Hedging, Management
false
Risk Assessment and Management
Financial Services financial-services
Multiple Chart
Deloitte
View slide
This slide consists of column charts and detailed financial data tables. It shows annual financial results, comparing current year with previous year, in a clear, structured manner using contrasting blue shades for different divisions.
Financial Performance
Financial Services
The slide provides a year-end review of Deutsche Bank's financial results for 2023, comparing it with 2022 data. It includes details on profits, losses, and divisional revenues, offering a comprehensive annual financial overview.
FY 2023, annual review, financial results, comparison
false
Financial Performance
Financial Services financial-services
Mixed Chart
Deutsche Bank
View slide
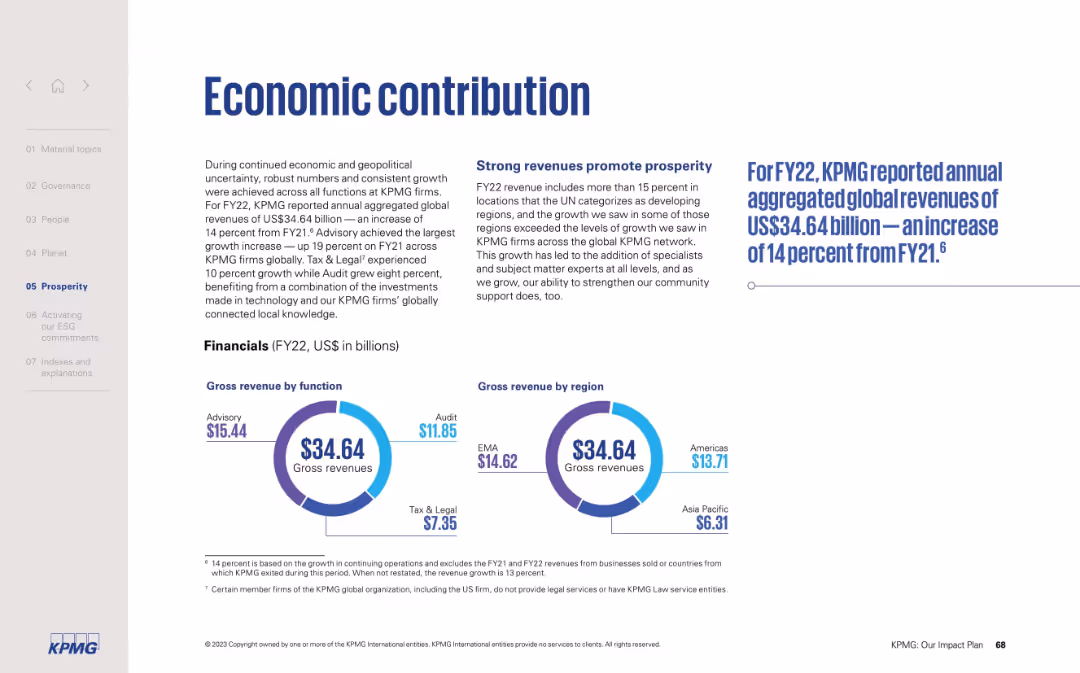
Split-page layout with text on the left and two circular diagrams on the right showing revenue by function and region.
Financial Performance
Professional Services
The slide summarizes KPMG’s FY22 financial results, with US$34.64B in global revenues—up 14% from FY21. It highlights growth by business function (Advisory, Audit, Tax & Legal) and regional breakdowns, stressing strong performance in developing markets.
FY22 revenue, KPMG growth, global revenue, regional revenue, financial results, advisory, audit, prosperity
false
Financial Performance
Professional Services professional-services
Mixed Chart
KPMG
View slide
High-contrast slide with infographics highlighting key fiscal year highlights, flanked by selected awards and certifications, exhibiting data and recognition.
Operational Efficiency
Professional Services
It showcases fiscal year accomplishments, like diversity in leadership and reductions in emissions, aligned with awards that affirm the company's values.
FY22, Highlights, Awards, Sustainability, Diversity
false
Operational Efficiency
Professional Services professional-services
Agenda
Booz Allen Hamilton
View slide
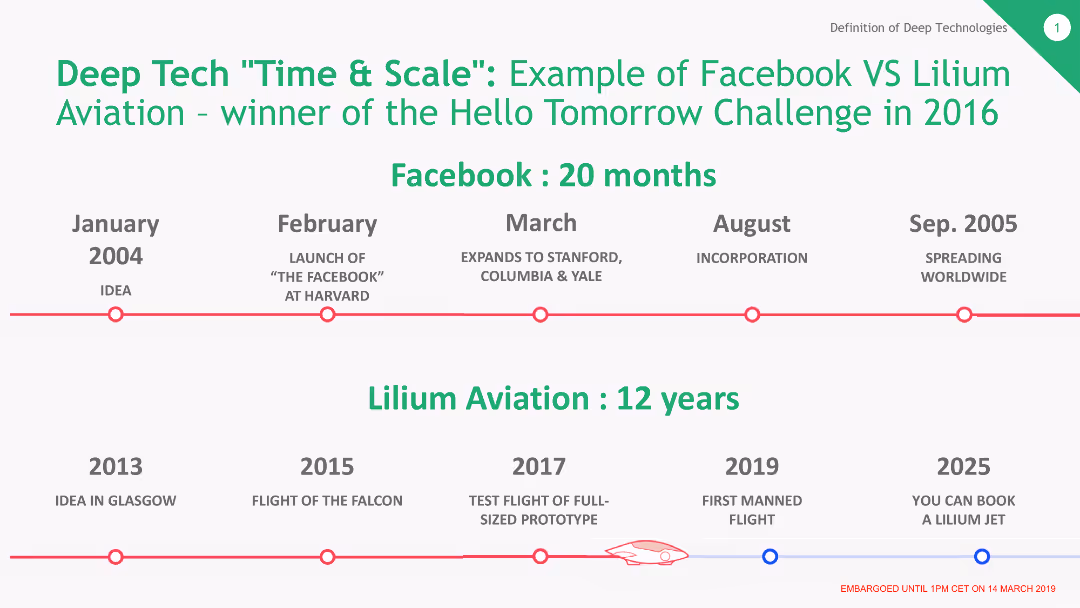
The slide features a timeline comparing the development and market entry times of Facebook and Lilium Aviation. Key milestones are marked along a horizontal timeline with distinct points for each company's progress.
Market Analysis and Trends
Technology & Software
This slide provides a comparative timeline showing the rapid growth of Facebook (20 months) versus the longer development period of Lilium Aviation (12 years). It highlights differences in market readiness and scaling between the two companies.
Facebook, Lilium Aviation, Timeline, Market Entry, Comparison, Development
false
Market Analysis and Trends
Technology & Software technology-and-software
Linear Flow
BCG
View slide
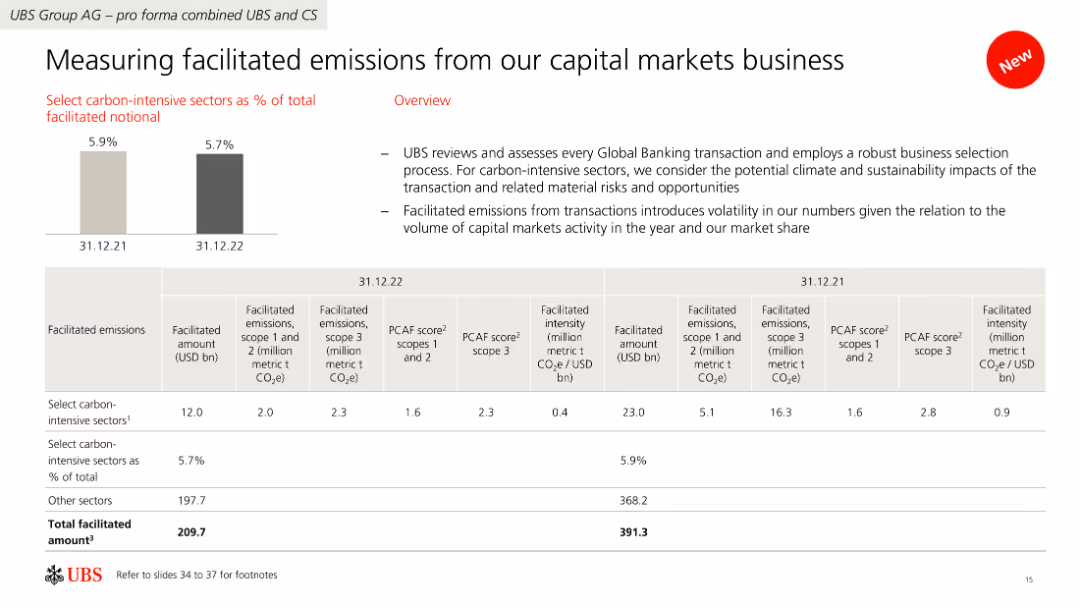
The slide contains a combination of bar and table charts displaying data on facilitated emissions from capital markets business, with a focus on carbon-intensive sectors.
Risk Assessment and Management
Financial Services
It reviews facilitated emissions by UBS's capital markets business, assessing transactions' impact on climate and sustainability, and showing data on emissions and facilitated amounts.
Facilitated emissions, carbon-intensive, capital markets, UBS, sustainability
false
Risk Assessment and Management
Financial Services financial-services
Mixed Chart
UBS
View slide
The slide combines text and bar charts to discuss the rise of fake news and disinformation, and its perceived threats to businesses according to council members.
Risk Assessment and Management
Media & Entertainment
Discusses the increasing threat of fake news and disinformation campaigns, especially with AI, and the need for businesses to prepare for such risks.
Fake news, disinformation, AI threats, risk management, media
false
Risk Assessment and Management
Media & Entertainment media-and-entertainment
Mixed Chart
IPSOS
View slide
The slide includes a column chart showing levels of familiarity with crypto assets among participants, rated from 1 to 7.
Market Analysis and Trends
Financial Services
This slide examines how familiar participants are with crypto assets, presenting data on the distribution of familiarity ratings.
Familiarity, crypto assets, knowledge, survey, participants
false
Market Analysis and Trends
Financial Services financial-services
Mixed Chart
IPSOS
View slide
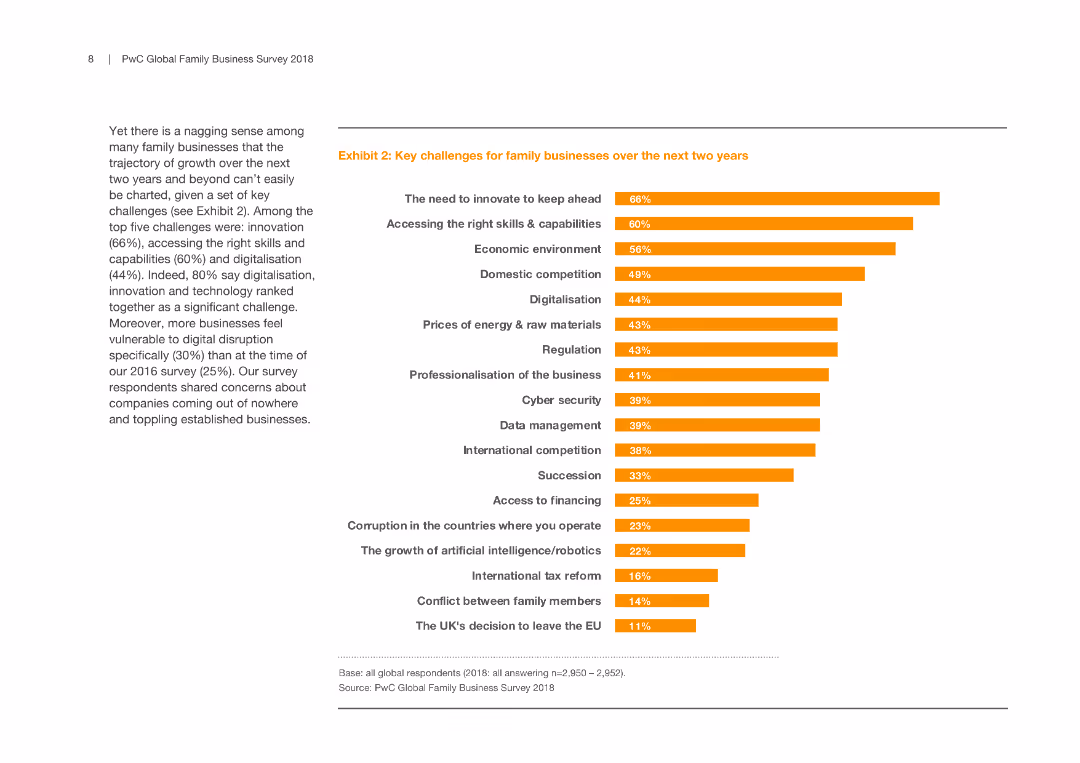
A detailed column chart listing key challenges for family businesses such as innovation, skills, and digitalization, with a text section discussing these challenges in the context of future growth and market conditions.
Risk Assessment and Management
Professional Services
The slide highlights major challenges family businesses expect to face, including innovation, accessing skills, and digitalization. It provides a comprehensive view of concerns impacting growth and strategic priorities over the next two years.
Family Business, Challenges, Innovation, Growth
false
Risk Assessment and Management
Professional Services professional-services
Mixed Chart
PwC/Strategy&
View slide
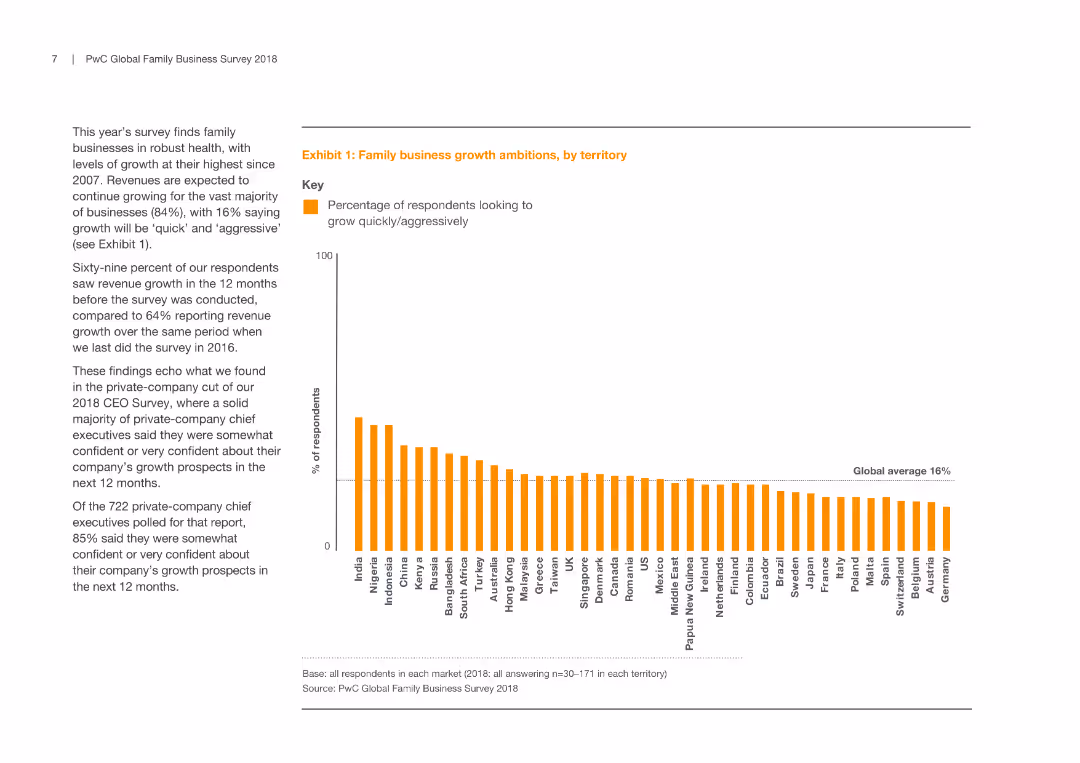
A column chart representing the percentage of respondents from various territories looking to grow quickly/aggressively, alongside a text description of growth trends and comparisons with previous years.
Market Analysis and Trends
Professional Services
This slide illustrates growth ambitions of family businesses across territories, highlighting high growth expectations and comparing them with previous survey results, reflecting confidence levels and future plans of respondents in different regions.
Family Business, Growth, Market Analysis, Territory
false
Market Analysis and Trends
Professional Services professional-services
Mixed Chart
PwC/Strategy&
View slide
Utilizes flowcharts and connectors to detail the family law application process, with red and black colors to denote different courts and actions. The content is arranged for easy step-by-step tracking.
Regulatory and Compliance
Government & Public Sector
This slide compares the family law application process between two courts, highlighting the steps and variations in procedure. The clear delineation aids understanding of the complex legal procedures involved in family law cases.
Family Law, Application Process, Court Procedure, Legal Comparison, Australia
false
Regulatory and Compliance
Government & Public Sector government-and-public-sector
Diagram
PwC/Strategy&
View slide
Dominated by a large flowchart diagram in shades of red and brown, the slide visualizes the family law process from lodgment to appeal, with key findings highlighted in text boxes.
Strategic Planning
Professional Services
This executive summary illustrates the flow of family law cases through the Australian courts, highlighting key statistics and findings relevant to stakeholders in the legal profession, designed for strategic planning and understanding the appeal process.
Family law, Court process, Statistics, Key findings, Legal profession, Flowchart, Appeals, Executive summary, Strategic planning
false
Strategic Planning
Professional Services professional-services
Diagram
PwC/Strategy&
View slide
This slide has a white background with red and black text. It includes a title and two sections titled 'Family law backlog' and 'Cost to finalisation comparison'. There are two column charts and a bar chart, displaying data from 2012-2017 with comparisons between the FCC and the FCoA. The layout is balanced with a mix of text and visuals.
Industry Overview
Government & Public Sector
The slide presents an executive summary focusing on the backlog of family law cases and the cost differences in case finalization between the FCC and FCoA. It uses statistical data to highlight trends and inefficiencies, likely used for regulatory review or public sector analysis.
Family law, backlog, court, cost, FCoA, FCC, finalization, expenditure, litigation, comparison
false
Industry Overview
Government & Public Sector government-and-public-sector
Multiple Chart
PwC/Strategy&
View slide
The slide is moderately complex, featuring two main sections with distinct headers. On the left, a column chart details family law final order types with a key explaining colors for settled, transferred, and other outcomes. A bar graph on the right shows the age of finalizations in months.
Market Analysis and Trends
Government & Public Sector
The slide compares family law case outcomes between the Federal Circuit Court (FCC) and Family Court of Australia (FCoA), focusing on settlement rates and the duration before finalization. It's designed to present an analysis of the efficiency and process variation between the two courts.
Family law, finalization, FCC, FCoA, settlement, transfer, duration, analysis, court process, efficiency
false
Market Analysis and Trends
Government & Public Sector government-and-public-sector
Multiple Chart
PwC/Strategy&
View slide
Column chart showing GMV growth of the Farfetch platform from 2015 to 2018 with CAGR.
Financial Performance
Retail & E-commerce
Depicts the rapid growth of the Farfetch platform in comparison to the online luxury market, emphasizing a 55% CAGR.
Farfetch, GMV, luxury market, growth, CAGR
false
Financial Performance
Retail & E-commerce retail-and-e-commerce
Single Chart
Deutsche Bank
View slide
World map with pie charts showing industry demand and Farfetch GMV percentages across different regions (Americas, EMEA, APAC) with office and localized site markers.
Strategic Planning
Retail & E-commerce
Maps out Farfetch's global platform, detailing the geographic distribution of industry demand, GMV, and presence of Farfetch offices and localized sites.
Farfetch, global platform, industry demand, GMV, regions
false
Strategic Planning
Retail & E-commerce retail-and-e-commerce
Multiple Chart
Deutsche Bank
View slide
Combination of bar and column charts showing various financial metrics for 2018, including GMV, revenue, and gross profit.
Financial Performance
Retail & E-commerce
Presents detailed operational results for Farfetch in 2018, including platform and group GMV, revenue, and profitability metrics.
Farfetch, operations, financial metrics, GMV, revenue
false
Financial Performance
Retail & E-commerce retail-and-e-commerce
Single Chart
Deutsche Bank
View slide
Pie chart and bullet points detailing emissions reduction methods and economic benefits. Text highlights farmer contributions and potential income from carbon projects.
Technology and Digital Transformation
Agriculture & Food Production
Highlights the role of Australian farmers in reducing emissions through various technologies and practices, emphasizing economic and environmental benefits.
Farmers, Emissions Reduction, Agriculture, Technology, Carbon Projects, Economic Benefits, Environmental Impact
false
Technology and Digital Transformation
Agriculture & Food Production agriculture-and-food-production
Multiple Chart
EY
View slide
A complex slide with pie charts and bar graphs comparing the percentages of different types of shoppers and their preferences, also lists the barriers and benefits of online shopping in the fashion industry.
Market Analysis and Trends
Retail & E-commerce
This detailed slide dissects the barriers faced by non-buyers and occasional shoppers in the fashion e-commerce domain, juxtaposing them with the preferences of frequent shoppers. It serves to analyze factors affecting consumer decisions in online fashion purchasing.
Fashion e-commerce, shopping barriers, consumer preferences
false
Market Analysis and Trends
Retail & E-commerce retail-and-e-commerce
Mixed Chart
BCG
View slide
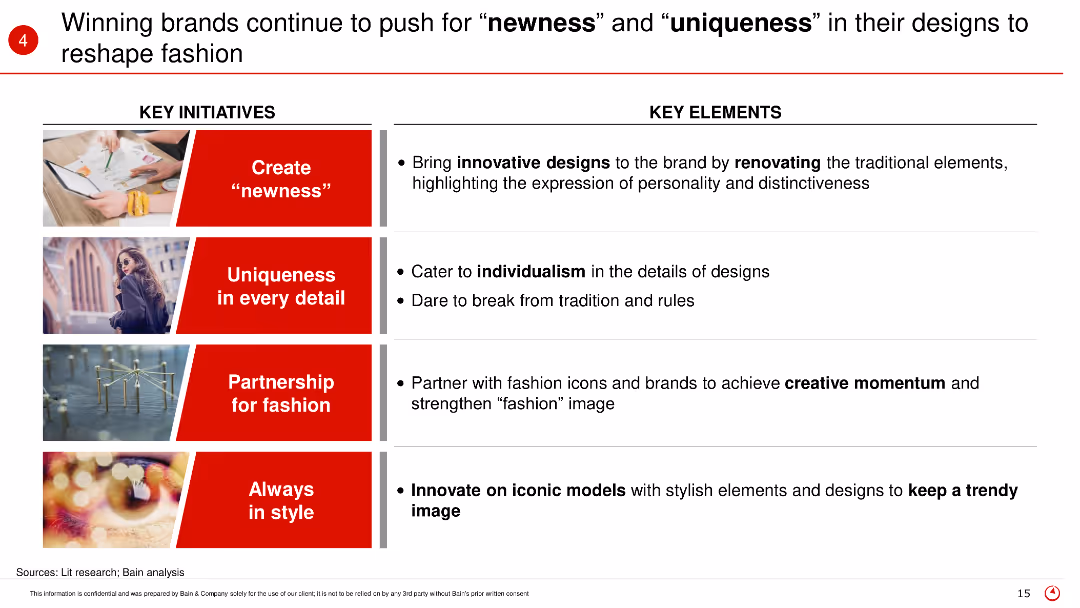
The slide highlights key initiatives and elements such as creating newness, uniqueness in every detail, partnerships for fashion, and staying in style, with supporting images for each point.
Product and Service Analysis
Retail & E-commerce
The slide discusses how winning brands in fashion are focusing on innovation, individuality, partnerships, and continuous style evolution to stay ahead in the market.
Fashion innovation, brand strategies, newness, uniqueness, design trends
false
Product and Service Analysis
Retail & E-commerce retail-and-e-commerce
Table
Bain
View slide
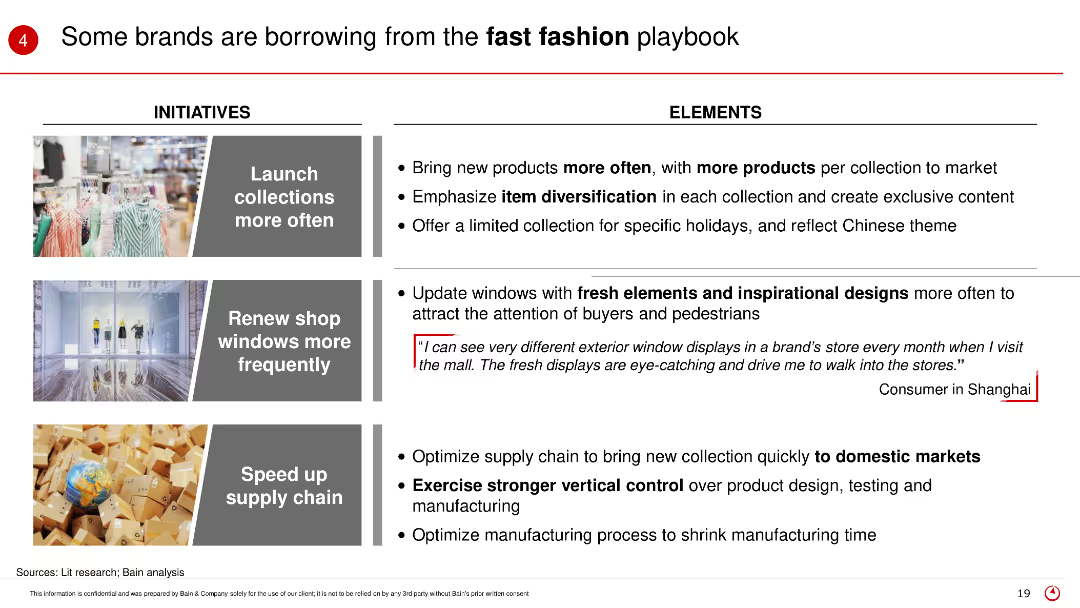
The slide presents initiatives and elements of the fast fashion strategy, including launching collections more often, updating shop windows, and speeding up supply chains, with corresponding images and consumer feedback.
Product and Service Analysis
Retail & E-commerce
This slide describes how some brands are adopting fast fashion tactics to remain competitive, focusing on frequent product launches, fresh window displays, and efficient supply chains.
Fast fashion, brand strategy, product launch, supply chain, retail trends
false
Product and Service Analysis
Retail & E-commerce retail-and-e-commerce
Table
Bain
View slide
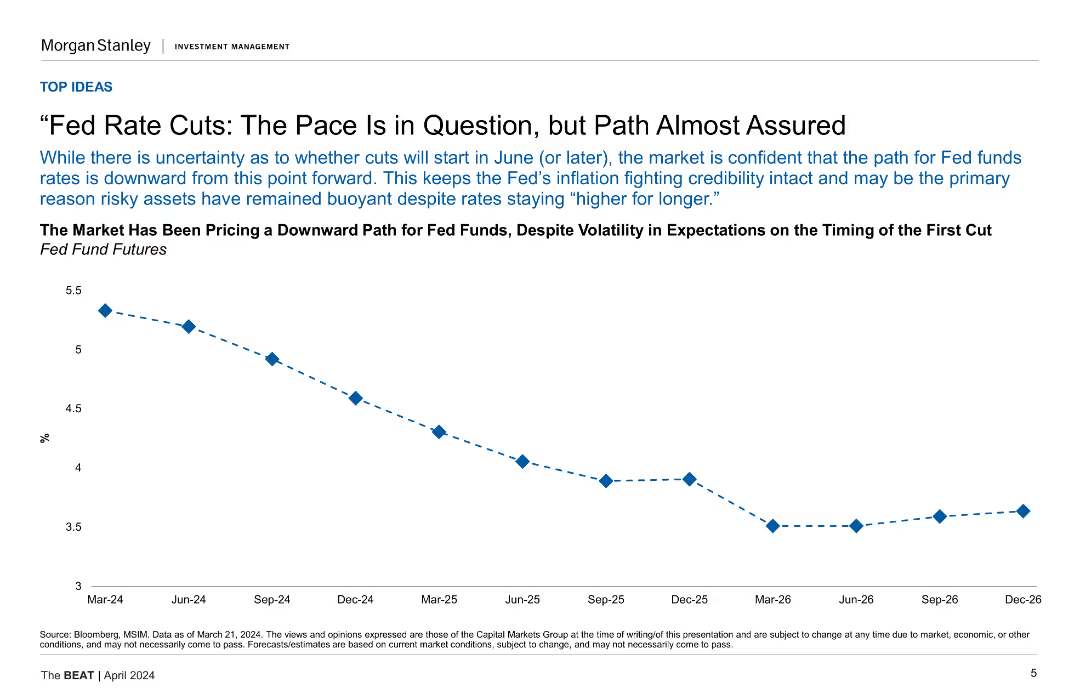
A line chart showing the downward path for Fed fund futures from Mar-24 to Dec-26.
Market Analysis and Trends
Financial Services
This slide discusses the market's expectation of a downward path for Fed funds rates despite volatility, showing projections until December 2026.
Fed Rates, Market Analysis, Futures, Projections, Volatility
false
Market Analysis and Trends
Financial Services financial-services
Mixed Chart
Morgan Stanley
View slide
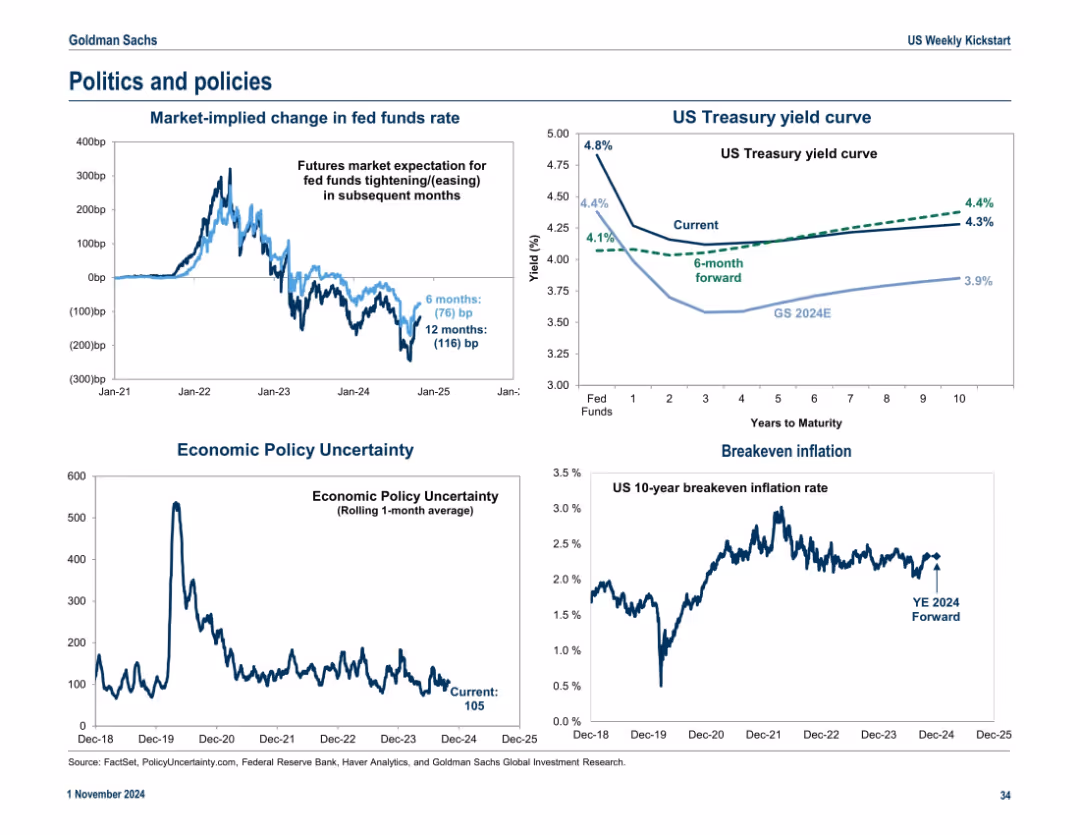
Four-quadrant layout with charts and graphs; blue-white theme with light annotations. Uses line graphs to show interest rates, yield curves, and inflation expectations.
Market Analysis and Trends
Financial Services
The slide shows economic indicators including policy uncertainty, breakeven inflation, changes in fed fund rates, and the US Treasury yield curve. It visualizes market expectations and forecasts for interest rates and economic policy shifts, offering context for future monetary policy and investor sentiment.
Fed funds rate, Treasury yield, inflation, uncertainty, policy, breakeven, interest rates, market sentiment
false
Market Analysis and Trends
Financial Services financial-services
Multiple Chart
Goldman Sachs
View slide
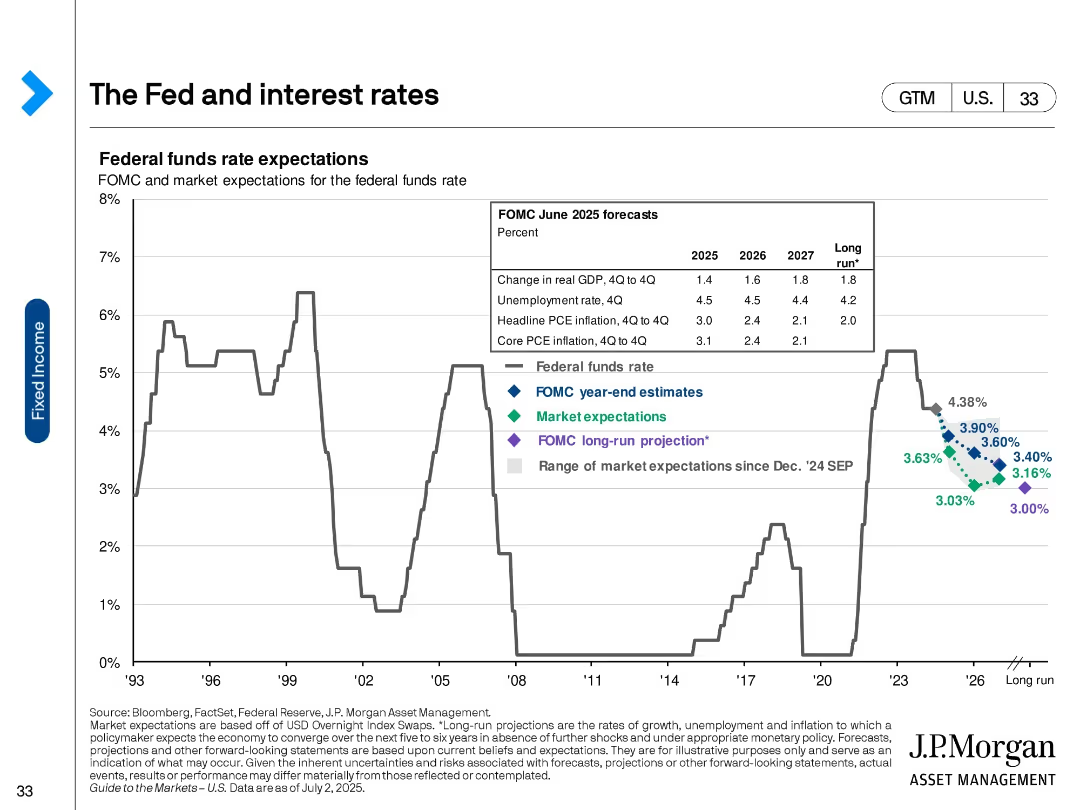
Historical line chart of the federal funds rate with forecasted paths and projections from the FOMC and markets; inset with macroeconomic forecasts.
Investment Analysis
Financial Services
The slide outlines past and expected future federal funds rates, including FOMC year-end estimates, market expectations, and long-run projections. It includes accompanying forecasts for inflation, unemployment, and GDP growth.
Fed funds rate, inflation, GDP forecast, interest rate policy, FOMC, projections
false
Investment Analysis
Financial Services financial-services
Single Chart
JP Morgan
View slide
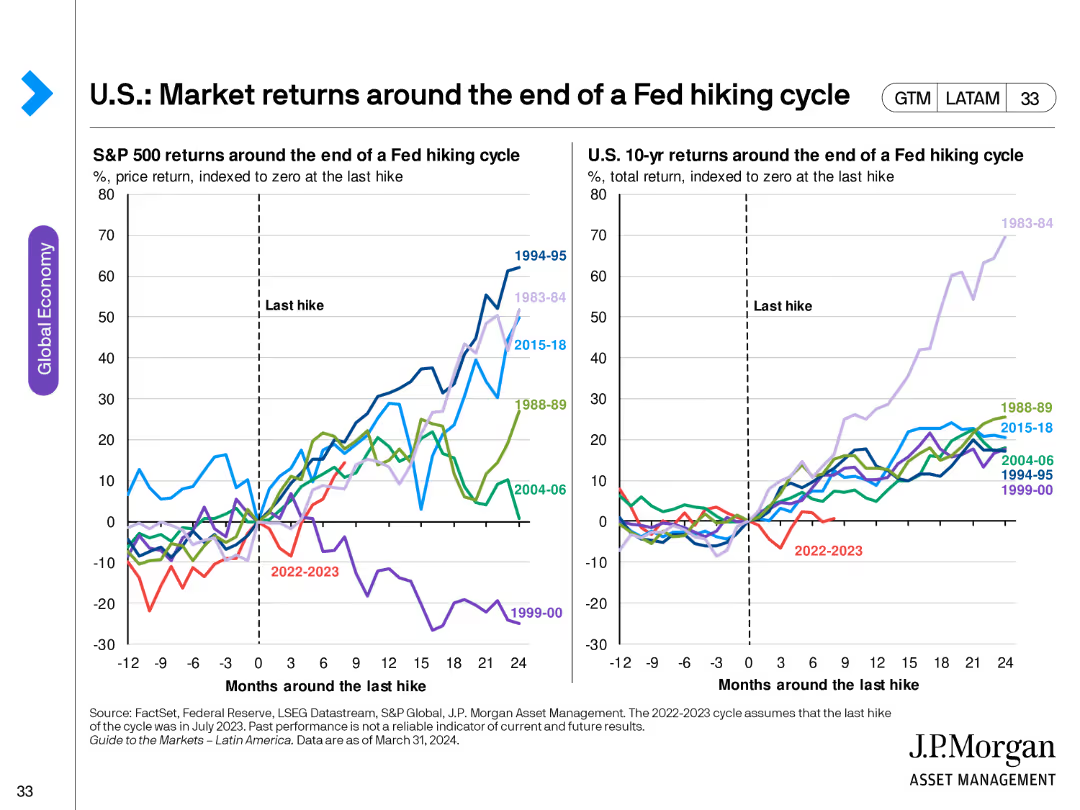
The slide features two line charts comparing S&P 500 and U.S. 10-year returns around the end of various Fed hiking cycles, indexed to zero at the last hike.
Investment Analysis
Financial Services
This slide analyzes market returns around the end of Fed hiking cycles, comparing historical S&P 500 and 10-year treasury returns to provide investment insights.
Fed hiking cycle, market returns, S&P 500, 10-year returns, investment analysis, historical trends
false
Investment Analysis
Financial Services financial-services
Multiple Chart
JP Morgan
View slide
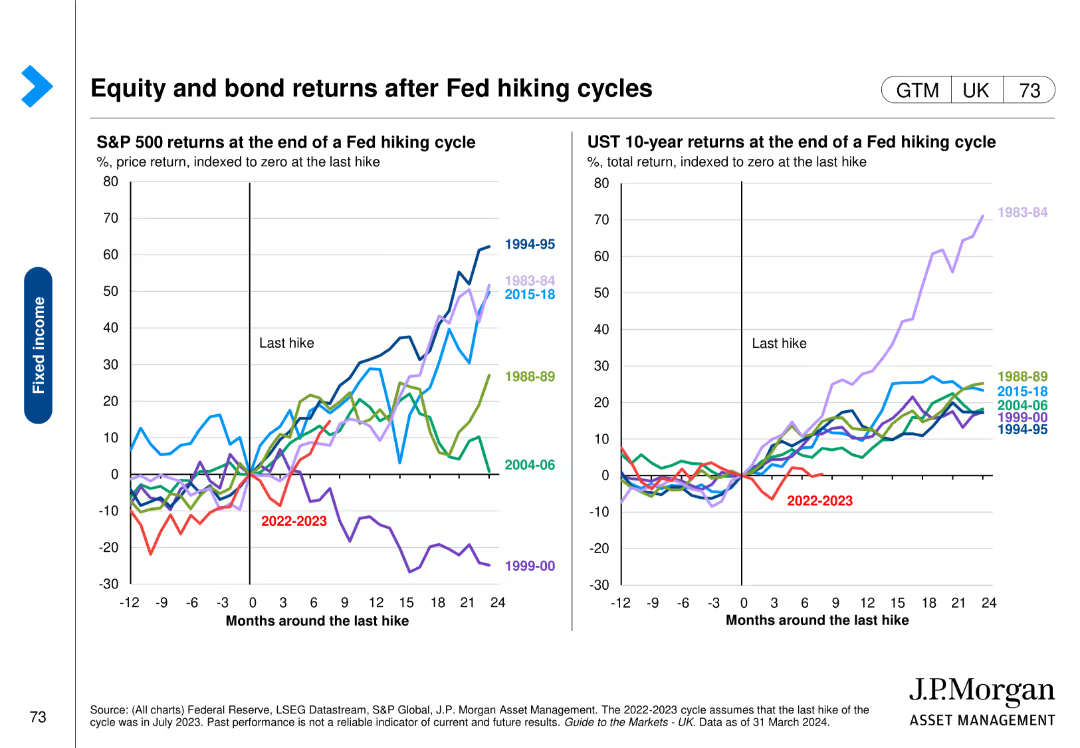
Contains two line charts showing S&P 500 and US 10-year Treasury returns around the end of Fed hiking cycles, with data from various periods highlighted.
Market Analysis and Trends
Financial Services
The slide explores the impact of Fed hiking cycles on equity and bond returns, providing historical data to understand market reactions to interest rate changes.
Fed hiking, equity returns, bond returns, S&P 500, Treasury
false
Market Analysis and Trends
Financial Services financial-services
Multiple Chart
JP Morgan
View slide
The slide features a line chart showing the market implied effective Fed funds forward curve and a column chart projecting U.S. federal spending by category.
Risk Assessment and Management
Financial Services
The slide discusses market expectations for Fed rate cuts and the projected increase in U.S. federal spending, particularly noting that interest expenses on U.S. debt are expected to overtake defense spending within four years. It highlights the importance of proactive risk management given these financial trends. The slide is suitable for discussions on monetary policy and fiscal risk management.
Fed rates, federal spending, debt, interest expenses
false
Risk Assessment and Management
Financial Services financial-services
Multiple Chart
JP Morgan
View slide
One column chart and one line chart, depicting current policy rates and market implied policy rates for various regions, and the divergence in expected policy rates.
Strategic Planning
Financial Services
This slide presents data that challenges the expectation of rate cuts by the Fed, highlighting market pricing and anticipated policy rate divergence between the US and the EU.
Fed, ECB, Policy Rates, Market Pricing, Economic Growth, Rate Cuts, Financial Conditions
false
Strategic Planning
Financial Services financial-services
Multiple Chart
Morgan Stanley
Previous
Loading...
Hold On!
We are searching in our database
If nothing, comes up, please try different filters!
Column Chart
Heatmap
Chevron
Org Chart
Infographic
Callouts
Timeline
List
Graphic
Picture
Process Flow
Diagram
Paragraph
Map
Table
Framework
Subtitle
Takeaway Box
Icon
Other Chart
Radar Chart
Waterfall Chart
Mekko Chart
Pie Chart
Scatter Plot
Line Chart
Bar chart
Bullet points
Create a FREE account to continue browsing
Receive Instant Access to 1,000+ slides from companies like McKinsey, Google, and Goldman Sachs
First Name
Last Name
Email
Password
I agree to all
Terms & Privacy Policy
Thank you! Your submission has been received!
Oops! Something went wrong while submitting the form.
Have an account?
Sign in
Upgrade to PRO to Save slides
Advanced Search and Filters
Access to 15,000+ slides
Access to Category Pages
Save/Bookmark Slides
PowerPoint Template Library
Pick a Plan
MONTHLY
$12/month
Billed every month, Cancel anytime.
YEARLY
$9/year
Billed $108 annually, Cancel anytime.
Checkout for $12/month
Checkout for $108/yr
Secured by Stripe | AES-256 bit encryption