My Account
My Slides
Search by Category
Templates
View All Templates
Download Template Slides
Leave Feedback
Login
Logout
Get Started
Browse all Slides
Browse all Slides
Create a FREE Account
Instant access to 1,000+ real slides from top companies like McKinsey, BCG, Goldman Sachs, Google and many more!
First Name
Last Name
Email
Password
I agree to all
Terms & Privacy Policy
Thank you! Your submission has been received!
Oops! Something went wrong while submitting the form.
Have an account?
Sign in
Spark Your Next Big Idea with New Presentation Templates
VIEW ALL Templates
Welcome,
Welcome
PRO
Show Featured Only
Checkbox 8
Companies
Mckinsey
Bain
BCG
EY
Deloitte
Accenture
PwC/Strategy&
JP Morgan
Goldman Sachs
Morgan Stanley
Citigroup
Deutsche Bank
Barclays
LEK
KPMG
Kearney
Oliver Wyman
Booz Allen Hamilton
Gartner
IPSOS
Nielsen
Slide type
Text Only
Linear Flow
Vertical Flow
Single Chart
Header Horizontal
Mixed Chart
Header Vertical
Pillar
Multiple Chart
Graphic
Agenda
Title
Table
Framework
Industry
Technology & Software
Artificial Intelligence
Financial Services
Retail & E-commerce
Consumer Goods
Industrial & Manufacturing
Transportation & Logistics
Telecommunications
Real Estate & Construction
Hospitality & Tourism
Professional Services
Education & Training
Media & Entertainment
Agriculture & Food Production
Healthcare & Pharmaceuticals
Environmental Services & Sustainability
Government & Public Sector
Use Case
Mergers and Acquisitions
Performance Metrics and KPIs
Client Case Studies
Competitive Landscape
Corporate Finance and Valuation
Product and Service Analysis
Customer and Market Segmentation
Organizational Structure and Change
Industry Overview
Regulatory and Compliance
Risk Assessment and Management
Investment Analysis
Organizational Structure and Change
Human Resources and Talent Management
Financial Performance
Market Analysis and Trends
Sales and Business Development
Human Resources and Talent Management
Clear all
Thank you! Your submission has been received!
Oops! Something went wrong while submitting the form.
Tag
View slide
This slide features a series of bar graphs displaying percentages of investors' concerns regarding various economic scenarios influenced by the Federal Reserve's actions. The layout is dense with numerical data and comparative analysis, employing a color-coded system to differentiate between scenarios considered most likely or concerning.
Market Analysis and Trends
Financial Services
The slide presents data from a survey capturing investors' beliefs about the likelihood and concern level of various economic scenarios resulting from the Federal Reserve's actions, including recession risks and inflation. Useful for discussing market sentiment and financial forecasting.
Federal Reserve, Recession, Inflation, Stagflation, Investor Concerns, Market Sentiment, Economic Forecast, Survey Data, Risk Management, Financial Analysis
false
Market Analysis and Trends
Financial Services financial-services
Multiple Chart
BCG
View slide
Two-column layout with line charts showing US interest rate forecasts and federal funds rate changes from Q1 2017-Q4 2026F and across loosening cycles.
Regulatory and Compliance
Financial Services
Provides insights into the Fed's monetary policy stance and anticipated rate cuts, emphasizing patience and economic indicators.
Federal Reserve, interest rates, monetary policy, economic indicators, rate cuts
false
Regulatory and Compliance
Financial Services financial-services
Multiple Chart
EY
View slide
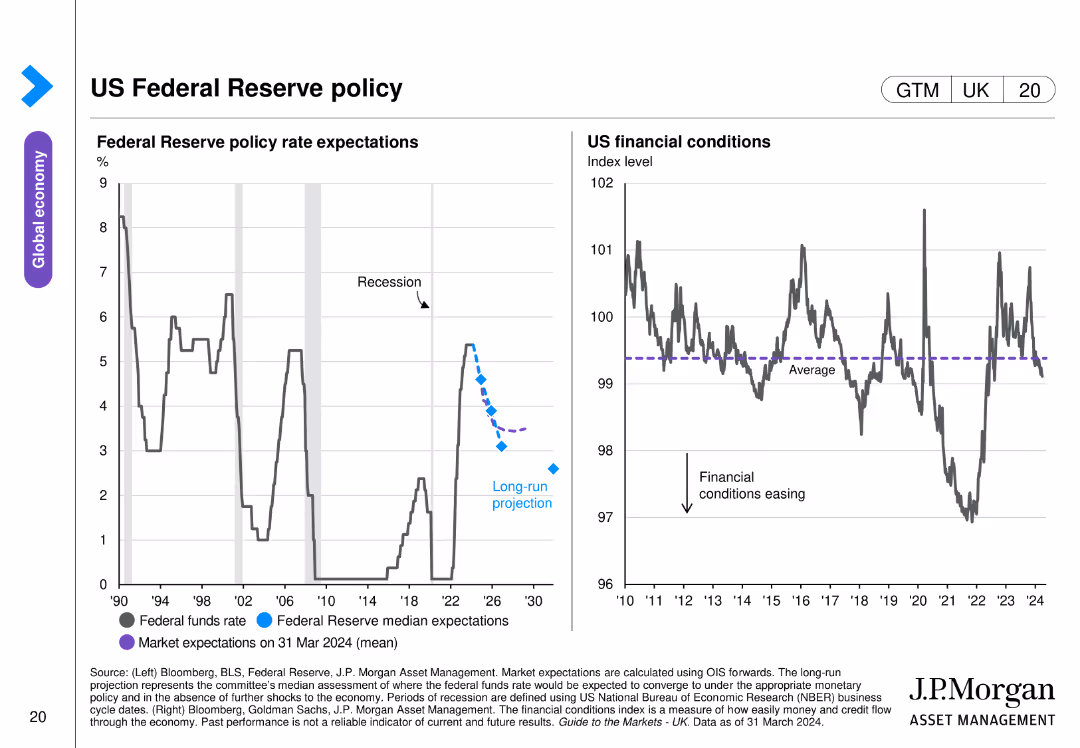
Two line charts side by side, showing Federal Reserve policy rate expectations and US financial conditions. Uses color coding and projection markers.
Regulatory and Compliance
Financial Services
Details Federal Reserve policy rate expectations and US financial conditions, highlighting projections and financial stability indicators.
Federal Reserve, policy, rate, financial, US
false
Regulatory and Compliance
Financial Services financial-services
Multiple Chart
JP Morgan
View slide
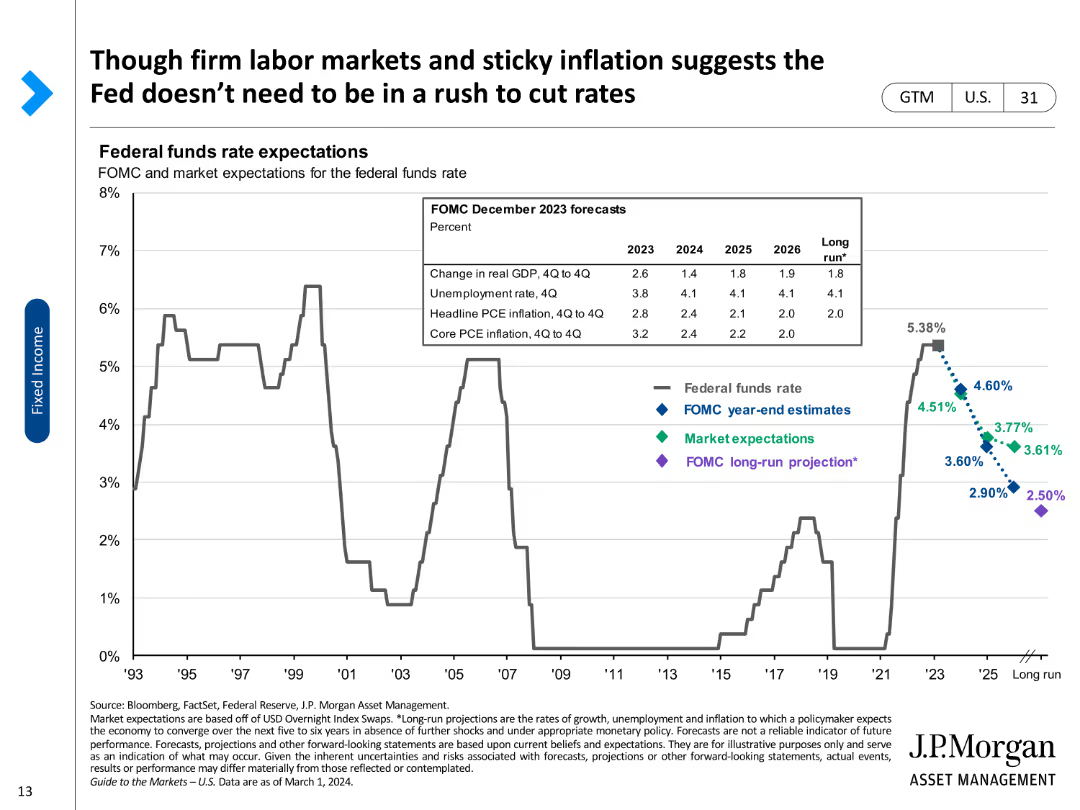
A line chart showing Federal funds rate expectations with annotations for FOMC estimates, market expectations, and projections.
Market Analysis and Trends
Financial Services
Analyzes the Federal funds rate expectations, comparing FOMC projections and market expectations for future rates.
Federal funds rate, FOMC, projections, inflation, market expectations, GDP, unemployment, PCE, long-run
false
Market Analysis and Trends
Financial Services financial-services
Single Chart
JP Morgan
View slide
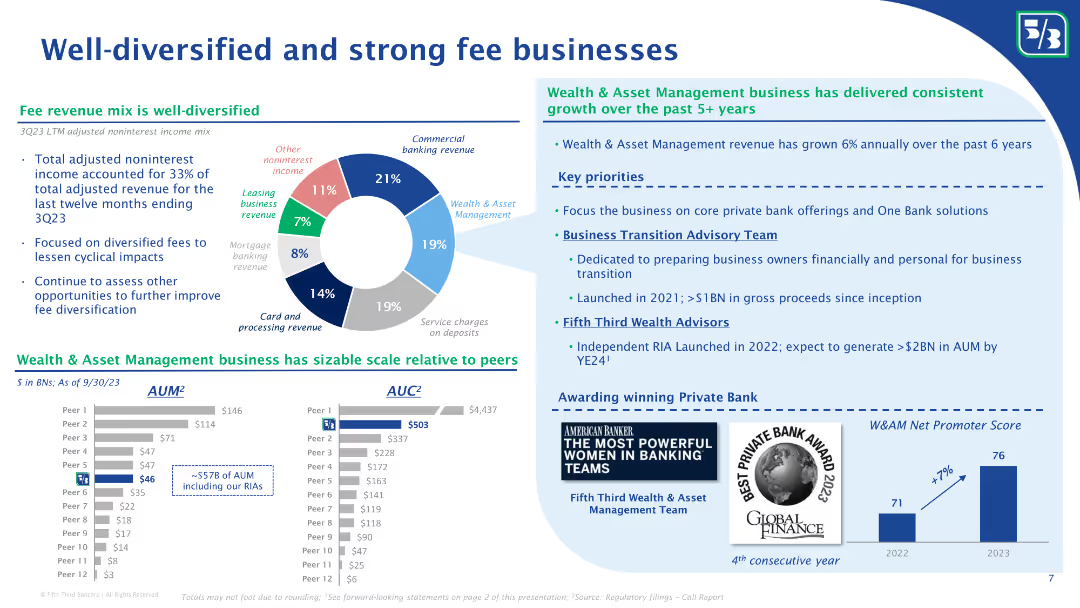
The slide has a pie chart showcasing fee revenue mix, bar graphs representing assets under management, and a variety of textual content. The layout is clean, with clear segmentation of sections, and uses blue and grey hues for the graphs, accented by bold colors to highlight key data points.
Financial Performance
Financial Services
It details Fifth Third's diverse fee revenue sources and the strength of its Wealth & Asset Management business, highlighting consistent growth and key priorities. The slide's comprehensive data presentation would be ideal for investor relations or strategic financial planning sessions, discussing revenue diversification and business scale in comparison to peers.
Fee Revenue, Diversification, Wealth Management, Growth, Pie Chart, Bar Graphs, Financial Services, Strategy, Comparison
false
Financial Performance
Financial Services financial-services
Multiple Chart
Goldman Sachs
View slide
The slide features a pie chart showing the mix of noninterest income, and column charts comparing AUM and AUC with peers. Bullet points discuss the growth of the wealth and asset management business and key priorities for future growth.
Financial Performance
Financial Services
The slide highlights Fifth Third Bank’s diversified fee revenue streams, with a detailed breakdown of noninterest income sources. It showcases their wealth and asset management business growth, comparing AUM and AUC with peers, and outlines key priorities for future growth and client advisory services.
Fee businesses, noninterest income, diversified revenue, AUM, AUC, wealth management, asset management, revenue growth, client advisory, Fifth Third Bank
false
Financial Performance
Financial Services financial-services
Multiple Chart
Goldman Sachs
View slide
The slide features a column chart showing the increase in WM client assets from 2019 to 2023, alongside initiatives to drive fee-based flows, with text boxes highlighting these initiatives.
Strategic Planning
Financial Services
The slide discusses the significant opportunity to drive fee-based flows from existing brokerage assets at Morgan Stanley, emphasizing growth in WM client assets and strategic initiatives.
Fee-Based Flows, Brokerage Assets, Morgan Stanley, Client Assets, Strategic Initiatives, Column Chart, 2019-2023
false
Strategic Planning
Financial Services financial-services
Mixed Chart
Morgan Stanley
View slide
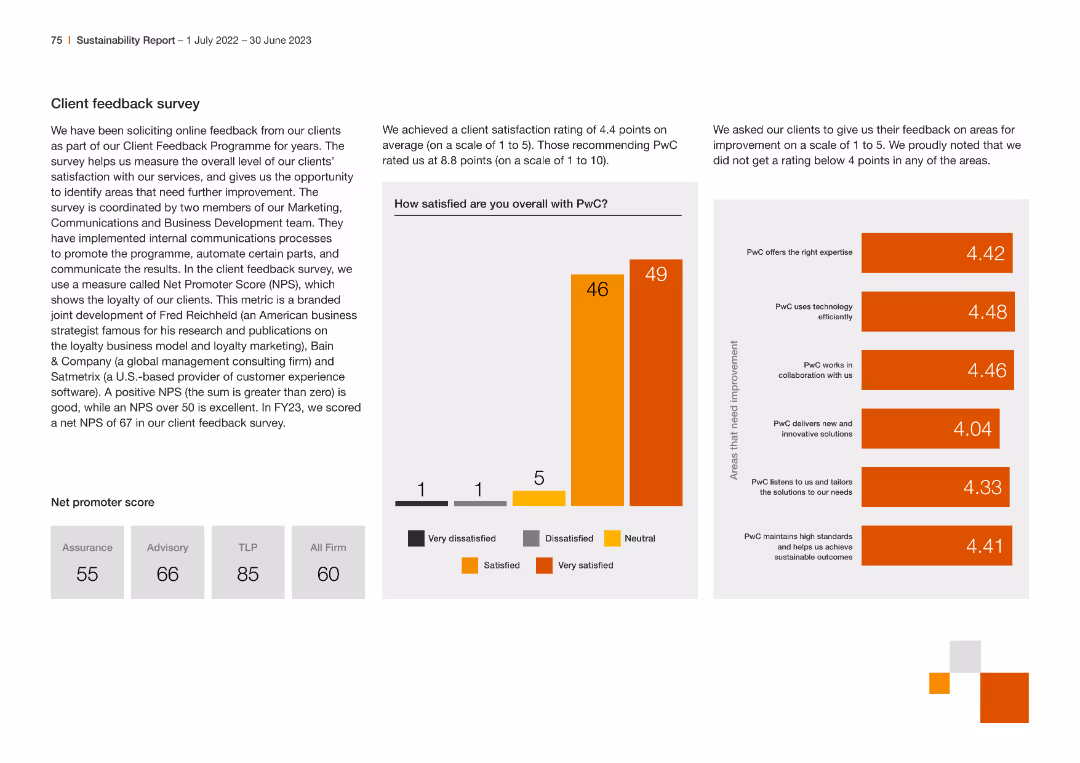
This slide contains multiple column charts and a net promoter score table. It uses a clean design with consistent colors and clear data presentation, making it easy to compare different metrics.
Customer and Market Segmentation
Professional Services
The slide presents client feedback results, including satisfaction ratings, areas for improvement, and net promoter scores across different service lines within the company.
Feedback, Survey, Satisfaction, NPS, Clients
false
Customer and Market Segmentation
Professional Services professional-services
Multiple Chart
PwC/Strategy&
View slide
A stacked bar chart showing the different types of fees reported by users when trading on crypto platforms, with a comparison between 2023 and 2022.
Pricing Strategies
Financial Services
This slide outlines the various fee structures encountered by users on crypto trading platforms, highlighting changes between 2023 and 2022.
Fees, crypto, trading, platforms, 2023, 2022, comparison
false
Pricing Strategies
Financial Services financial-services
Mixed Chart
IPSOS
View slide
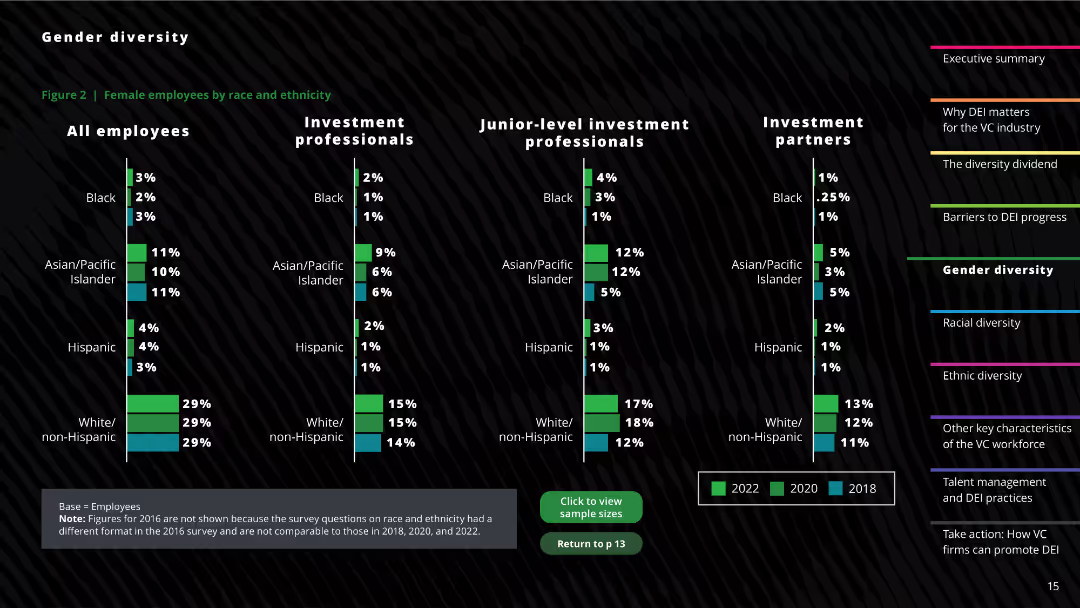
The slide features a column chart showing the distribution of female employees by race and ethnicity across different professional levels. Textual descriptions and notes on survey changes are also included.
Human Resources and Talent Management
Professional Services
This slide provides a detailed breakdown of the racial and ethnic composition of female employees within the investment sector, comparing data from 2018, 2020, and 2022.
Female employees, Racial diversity, Ethnicity, Investment sector, Diversity trends
false
Human Resources and Talent Management
Professional Services professional-services
Multiple Chart
Deloitte
View slide
This slide has moderate visual complexity, featuring two pie charts to represent survey data on female millennials' attitudes toward international experience as a factor in employment. The design uses a consistent color scheme of red and grey to maintain visual coherence.
Human Resources and Talent Management
Professional Services
This slide discusses the importance of international assignments in attracting and retaining female talent, highlighting how such opportunities are crucial for employer branding. It emphasizes the need for organizations to incorporate international mobility into their employee value proposition.
Female talent, Millennials, Employer branding, International assignments
false
Human Resources and Talent Management
Professional Services professional-services
Multiple Chart
PwC/Strategy&
View slide
The slide features a graph illustrating the disparity between the demand for international work by female millennials and their current representation. It has a moderate visual complexity with an icon of a woman circling a globe, alongside a bar chart displaying the percentage statistics.
Technology and Digital Transformation
Professional Services
It presents data on the demand versus the reality of female participation in international work roles. The aim is to highlight the gap and spur discussion on aligning global mobility strategies with the changing workforce demographics to fully utilize female potential.
Female workforce, International mobility, Gap analysis, Workforce demographics
false
Technology and Digital Transformation
Professional Services professional-services
Mixed Chart
PwC/Strategy&
View slide
Contains column charts and lists inside boxes detailing historical data and investment strategies.
Risk Assessment and Management
Financial Services
Highlights how principles of fiduciary mindset and insights contribute to navigating market events and client challenges, with growth data from pivotal market events.
Fiduciary, Market Events, Growth, Strategy
false
Risk Assessment and Management
Financial Services financial-services
Multiple Chart
JP Morgan
View slide
This slide features line charts and bar charts to display agent capacity and available skills in field service management. It uses a dark background with blue and green lines and bars to differentiate between data points.
Operational Efficiency
Energy & Utilities
The slide offers insights into field service management, focusing on agent capacity and available skills, using line and bar charts to visualize the data, enhancing operational efficiency in managing field services.
Field Service, Management, Agent Capacity, Skills, Data Visualization
false
Operational Efficiency
Energy & Utilities energy-and-utilities
Multiple Chart
EY
View slide
The slide features key metrics about FieldView's platform advantages and data collection capabilities, along with a bar chart showing the timeline to collect connected hours.
Technology and Digital Transformation
Agriculture & Food Production
This slide presents FieldView as a leading digital platform for growers, highlighting platform advantages, extensive database, and rapid data collection capabilities, emphasizing its impact on agricultural productivity.
FieldView, Digital Platform, Agriculture, Data Collection, Productivity
false
Technology and Digital Transformation
Agriculture & Food Production agriculture-and-food-production
Mixed Chart
Credit Suisse
View slide
Horizontal bar charts showing varying degrees of economic activity impairment during the Fight phase of the pandemic across different countries.
Strategic Planning
Financial Services
This slide details the economic risks during the Fight phase of COVID-19, estimating potential temporary impacts on economic activity by country.
Fight phase, economic risks, COVID-19, economic activity, temporary impacts, country analysis, economic challenges
false
Strategic Planning
Financial Services financial-services
Single Chart
BCG
View slide
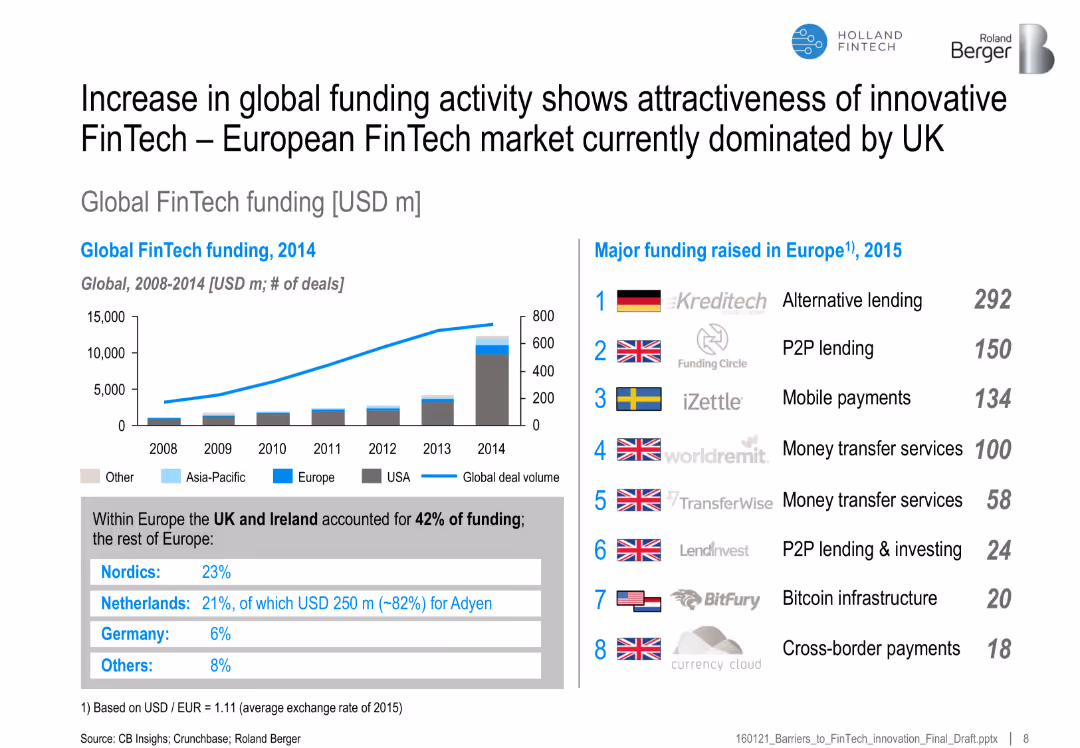
Line and bar chart of global FinTech funding by region (2008–2014); list of top funded firms in Europe in 2015 on right
Investment Analysis
Financial Services
Highlights the surge in FinTech funding globally and identifies the UK and Nordics as dominant regions in Europe. Lists top funded companies and their sectors.
FinTech funding, Europe, startups, investment, UK, Adyen, Kreditech, deal volume, financial technology
false
Investment Analysis
Financial Services financial-services
Mixed Chart
Roland Berger
View slide
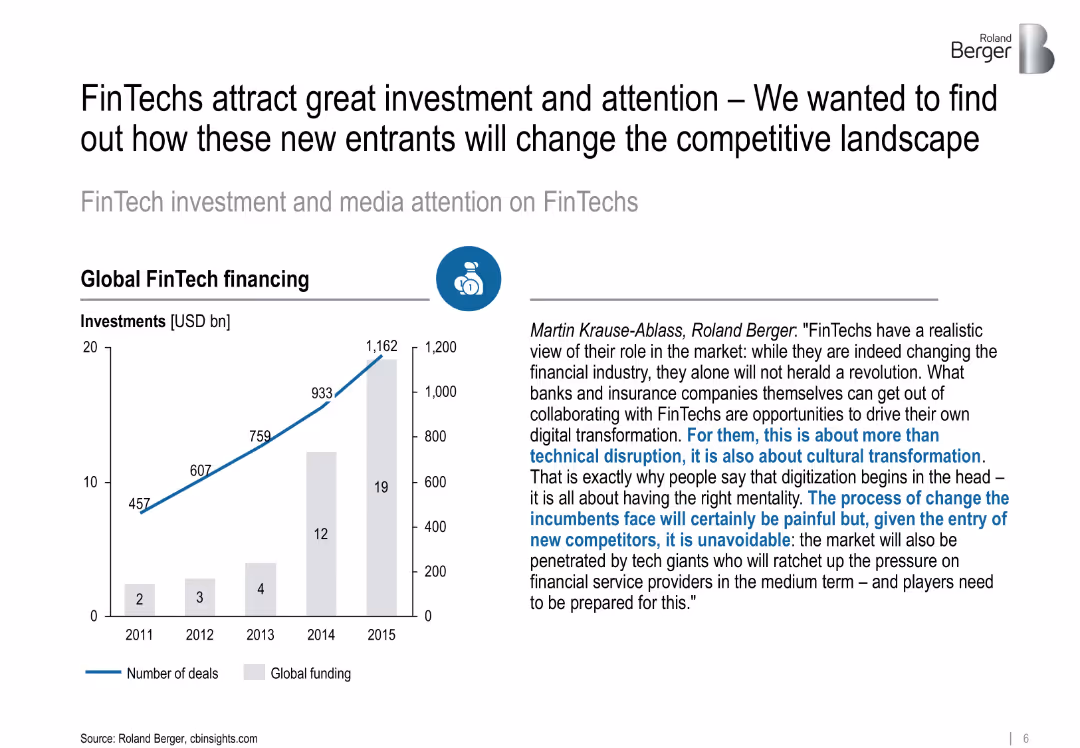
Left: bar and line chart showing FinTech funding growth (2011–2015); Right: expert quote in paragraph format
Investment Analysis
Financial Services
Demonstrates significant growth in global FinTech investments and underlines their role in digital and cultural transformation in financial services, supported by expert commentary.
FinTech funding, investments, digital transformation, cultural change, competitive landscape
false
Investment Analysis
Financial Services financial-services
Mixed Chart
Roland Berger
View slide
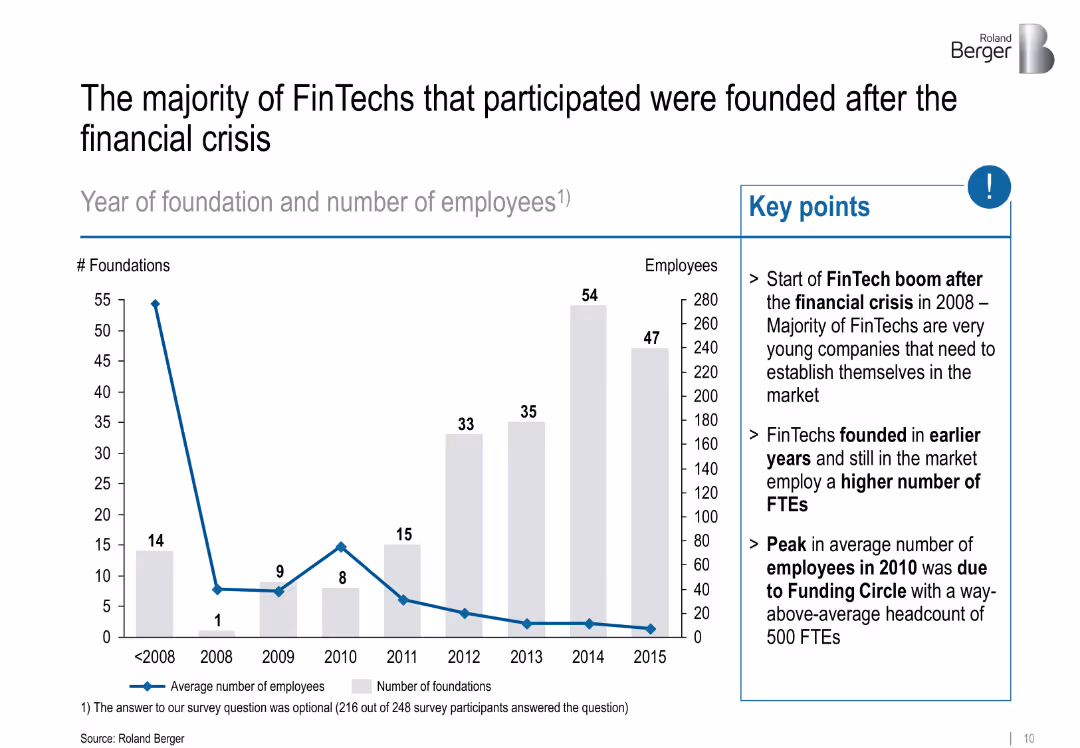
Left: bar chart showing foundations/year; Right: key insights in bullet form; uses grey and blue for emphasis
Industry Overview
Financial Services
Tracks the foundation years of FinTech companies, revealing a boom post-2008 financial crisis. Notes that older firms have more employees and highlights a peak due to a major player.
FinTech origins, post-crisis, startup growth, employment, Funding Circle
false
Industry Overview
Financial Services financial-services
Mixed Chart
Roland Berger
View slide
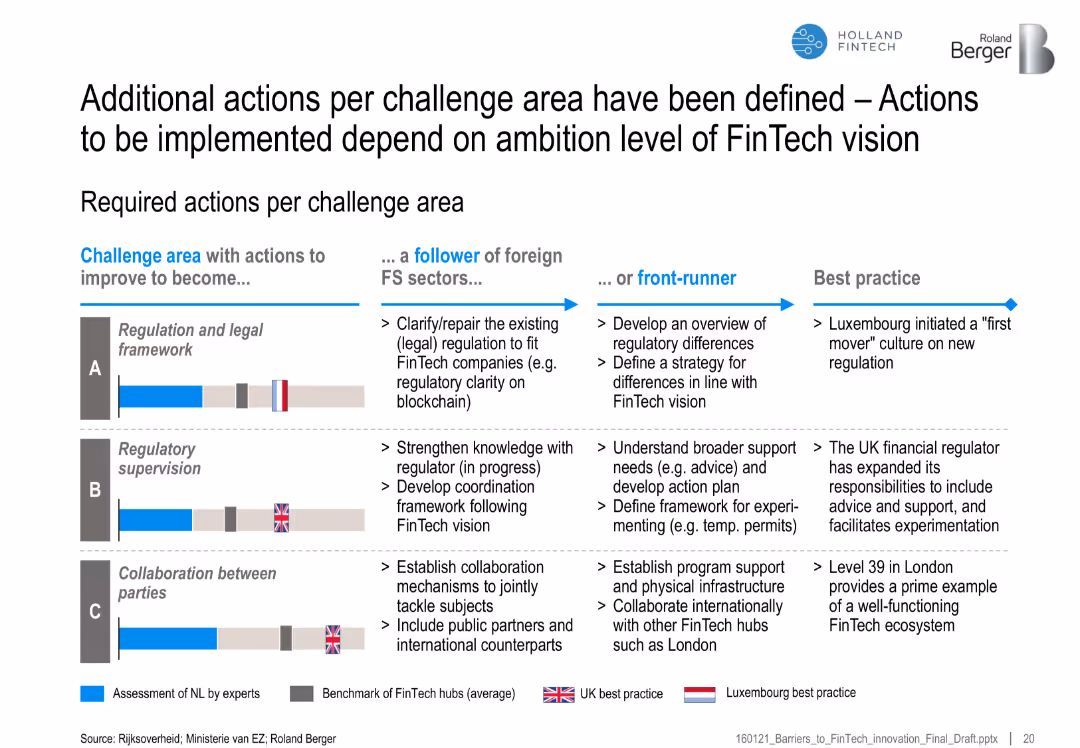
Table matching challenge areas (A–C) with actions to improve (follower vs. front-runner), including best practices
Regulatory and Compliance
Financial Services
Suggests specific regulatory and collaboration improvements for the Netherlands to follow FinTech leaders like UK and Luxembourg, depending on ambition level.
FinTech regulation, legal framework, best practices, UK, Luxembourg, collaboration, strategic actions
false
Regulatory and Compliance
Financial Services financial-services
Mixed Chart
Roland Berger
View slide
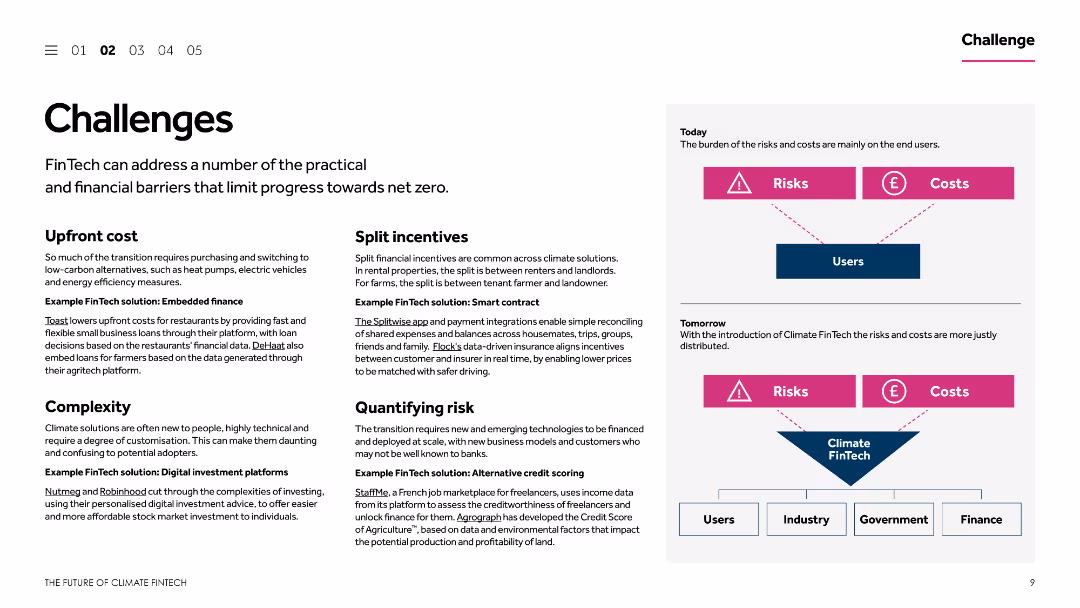
The slide is divided into multiple sections, each addressing different challenges and corresponding FinTech solutions. It includes textual descriptions and simple diagrams to explain concepts like upfront costs, split incentives, and quantifying risk.
Operational Efficiency
Financial Services
This slide outlines various challenges that limit progress towards net zero in the context of FinTech. It provides examples of FinTech solutions to address issues like upfront costs, split incentives, complexity, and risk quantification, aiming to enhance operational efficiency.
FinTech solutions, net zero, upfront costs, split incentives, risk quantification
false
Operational Efficiency
Financial Services financial-services
Diagram
Barclays
View slide
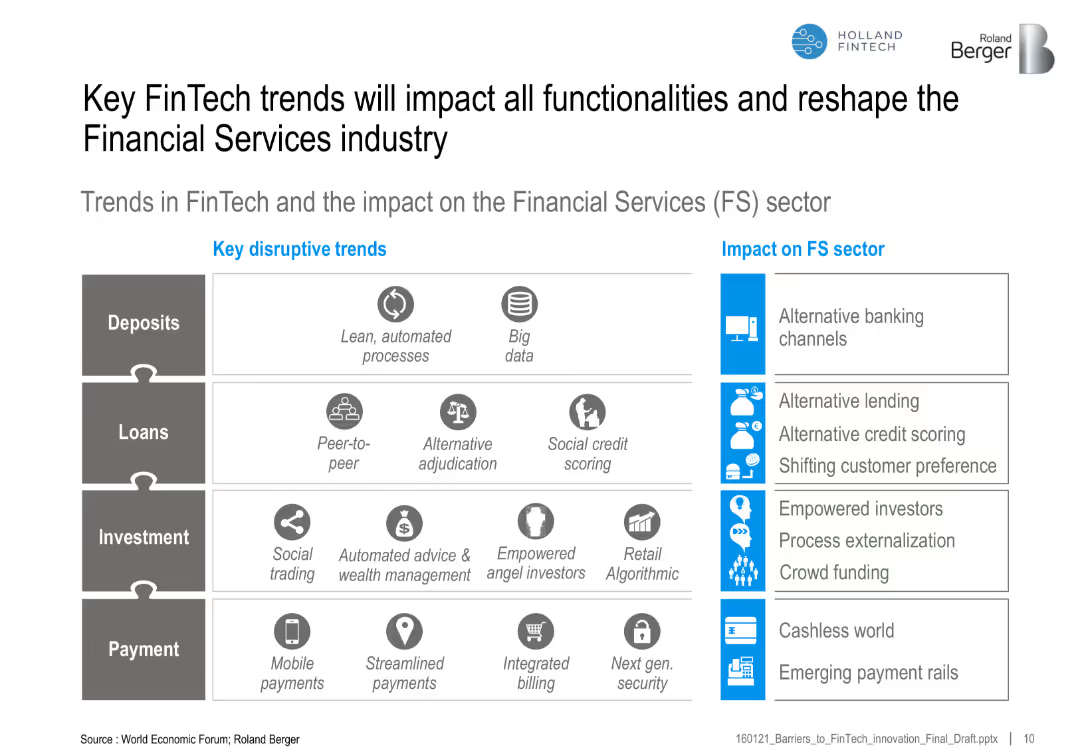
Matrix connecting disruptive trends across FS areas (deposits, loans, investment, payment) with impact categories
Technology and Digital Transformation
Financial Services
This slide maps disruptive FinTech trends to impacts on financial services, such as alternative lending, mobile payments, and automated wealth management, showing how FS is being reshaped.
FinTech trends, disruption, financial services, automation, digital payments, lending, investment, banking
false
Technology and Digital Transformation
Financial Services financial-services
Table
Roland Berger
View slide
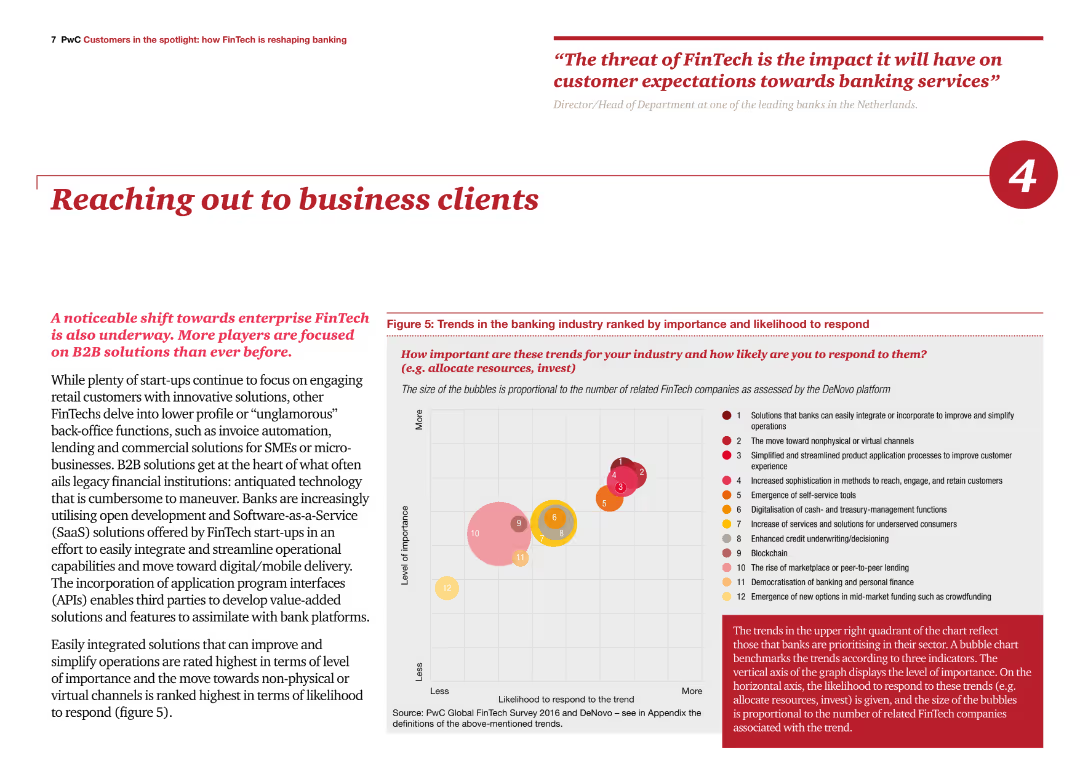
The slide includes a bubble chart ranking trends in the banking industry by importance and likelihood to respond. Text on the left discusses the focus on B2B solutions and their impact on business clients.
Sales and Business Development
Financial Services
The slide highlights the importance of B2B solutions in the FinTech industry, ranking various trends and emphasizing the need for banks to adopt these solutions to improve operations and client engagement.
FinTech, B2B solutions, trends, business clients, engagement
false
Sales and Business Development
Financial Services financial-services
Mixed Chart
PwC/Strategy&
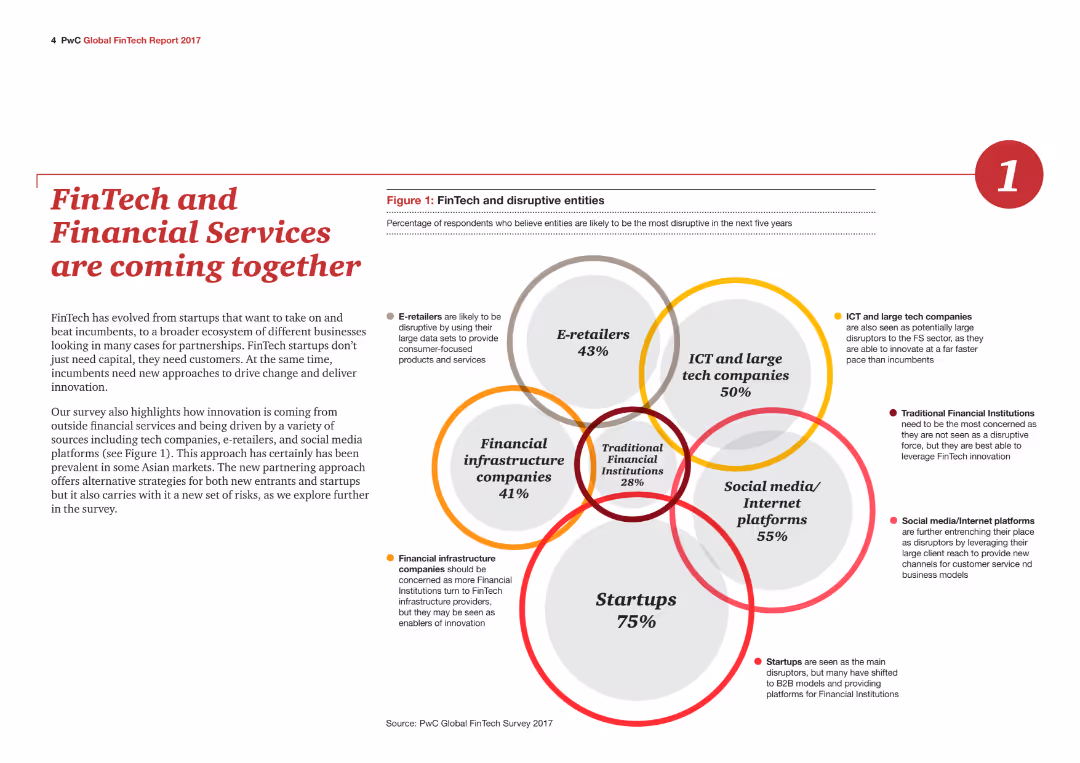
View slide
A Venn diagram illustrating the convergence of different business sectors with FinTech, including e-retailers, ICT, financial infrastructure, social media, and startups.
Technology and Digital Transformation
Financial Services
The slide explains how FinTech is integrating with other sectors, driven by technological innovation and partnerships, as detailed in a Venn diagram.
FinTech, Financial Services, Technology, Innovation, Integration, Partnerships, E-retailers, ICT, Infrastructure, Startups
false
Technology and Digital Transformation
Financial Services financial-services
Mixed Chart
PwC/Strategy&
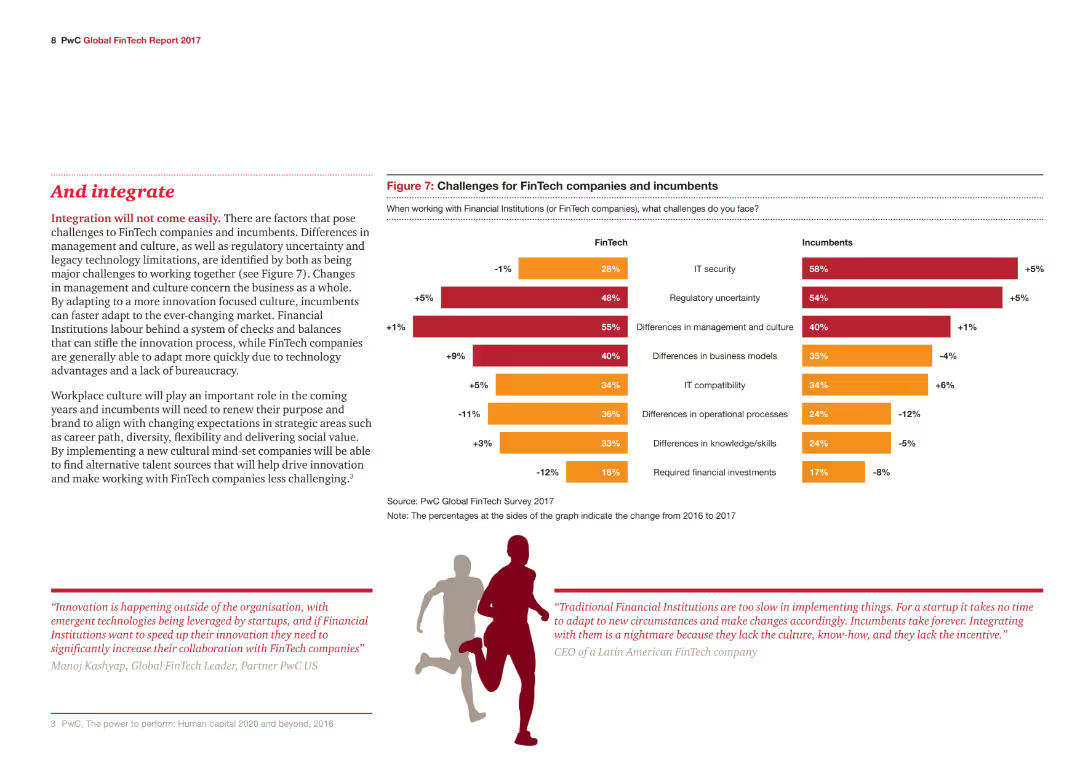
View slide
The slide features a column chart comparing the challenges faced by FinTech companies and incumbents, with color-coded bars indicating different percentages for various challenges.
Risk Assessment and Management
Financial Services
The slide discusses the challenges FinTech companies and incumbents face, such as IT security, regulatory uncertainty, and differences in management and culture.
FinTech, Incumbents, IT security, Management, Culture
false
Risk Assessment and Management
Financial Services financial-services
Multiple Chart
PwC/Strategy&
View slide
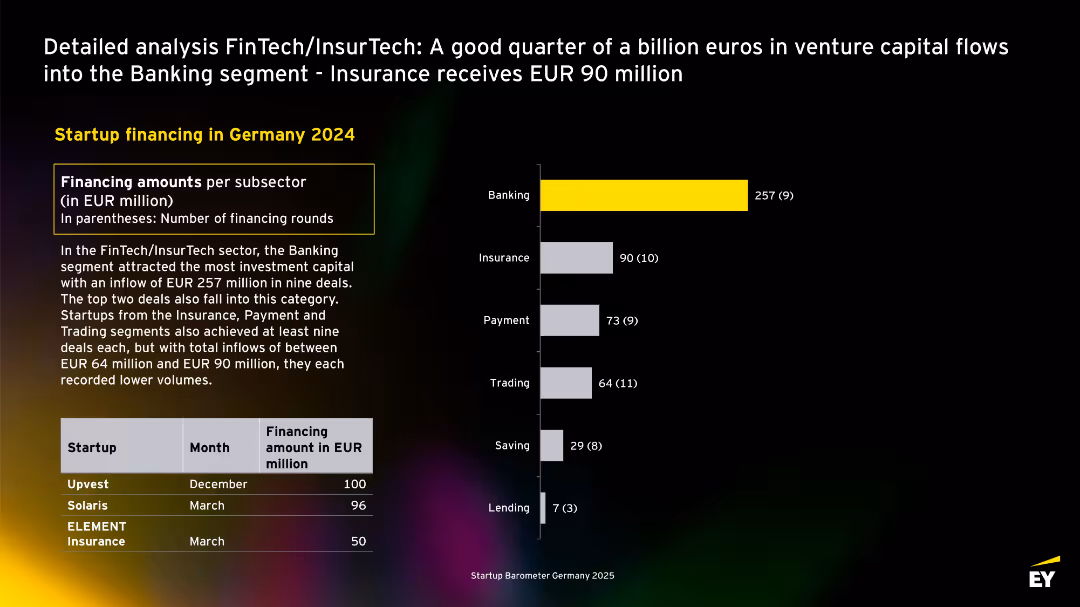
Horizontal bar chart with Banking in yellow; textual explanation and top-funded startup table at bottom-left.
Investment Analysis
Financial Services
In 2024, EUR 257M went to the Banking segment in FinTech/InsurTech, followed by Insurance (EUR 90M) and Payment (EUR 73M). Startups like Upvest and Solaris lead the funding chart.
FinTech, InsurTech, banking, insurance, startups, funding, Germany, 2024, capital
false
Investment Analysis
Financial Services financial-services
Mixed Chart
EY
View slide
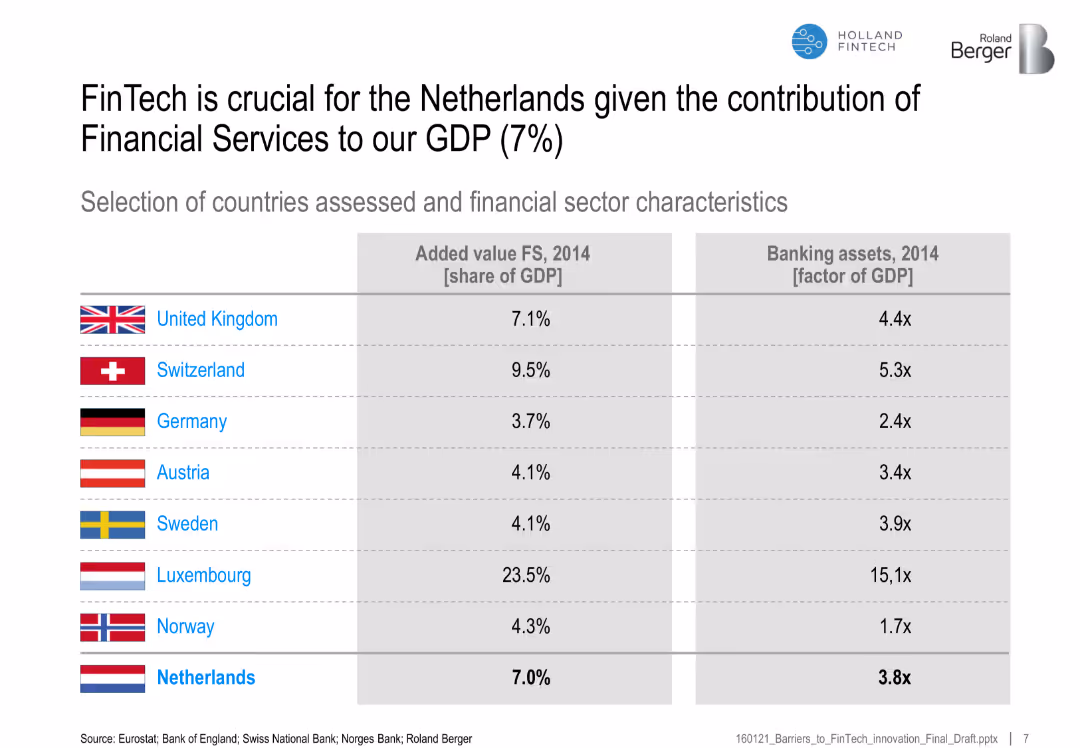
Table comparing countries by financial services' GDP share and banking assets as GDP multiple
Financial Performance
Financial Services
This slide shows the significance of financial services in different countries' GDPs, emphasizing the importance of FinTech for the Netherlands given its 7% GDP share from FS.
FinTech, Netherlands, GDP share, financial services, banking assets, country comparison
false
Financial Performance
Financial Services financial-services
Table
Roland Berger
View slide
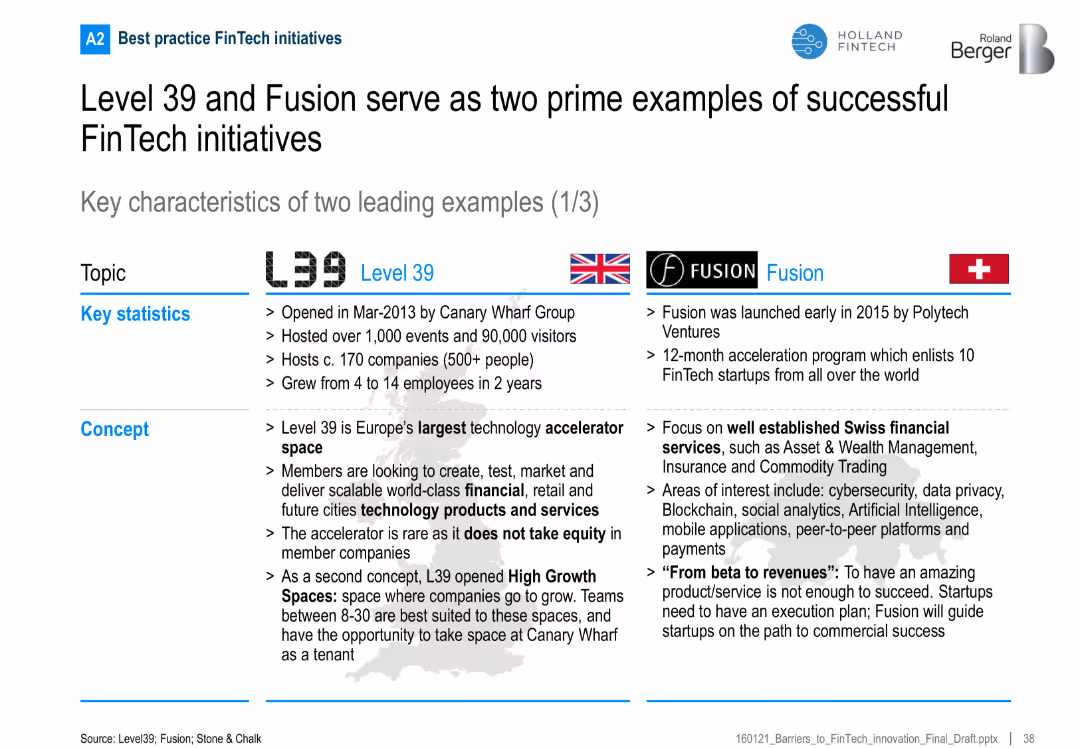
Two-column comparison of Level 39 and Fusion including key statistics and program concepts
Competitive Landscape
Financial Services
This slide compares London’s Level 39 and Geneva’s Fusion FinTech hubs in terms of their scale, focus areas, structure, and success frameworks, offering models for FinTech ecosystem development.
FinTech, accelerator, Level 39, Fusion, Switzerland, London, startups
false
Competitive Landscape
Financial Services financial-services
Table
Roland Berger
View slide
The slide has a bar chart showing the progression of current and future FinTech users, including lapsed users and anticipated future users.
Market Analysis and Trends
Financial Services
The slide forecasts that FinTech adoption will surpass 50%, showing a detailed breakdown of user categories and predicting significant future growth.
FinTech, adoption, forecast, user categories, future
false
Market Analysis and Trends
Financial Services financial-services
Mixed Chart
EY
View slide
The slide includes a column chart comparing 2017 use and future use projections for different FinTech categories.
Strategic Planning
Financial Services
The slide predicts growth in smaller FinTech categories like financial planning and borrowing, suggesting that these areas will drive future growth.
FinTech, adoption, growth, categories, future use
false
Strategic Planning
Financial Services financial-services
Single Chart
EY
Previous
Loading...
Hold On!
We are searching in our database
If nothing, comes up, please try different filters!
Column Chart
Heatmap
Chevron
Org Chart
Infographic
Callouts
Timeline
List
Graphic
Picture
Process Flow
Diagram
Paragraph
Map
Table
Framework
Subtitle
Takeaway Box
Icon
Other Chart
Radar Chart
Waterfall Chart
Mekko Chart
Pie Chart
Scatter Plot
Line Chart
Bar chart
Bullet points
Create a FREE account to continue browsing
Receive Instant Access to 1,000+ slides from companies like McKinsey, Google, and Goldman Sachs
First Name
Last Name
Email
Password
I agree to all
Terms & Privacy Policy
Thank you! Your submission has been received!
Oops! Something went wrong while submitting the form.
Have an account?
Sign in
Upgrade to PRO to Save slides
Advanced Search and Filters
Access to 15,000+ slides
Access to Category Pages
Save/Bookmark Slides
PowerPoint Template Library
Pick a Plan
MONTHLY
$12/month
Billed every month, Cancel anytime.
YEARLY
$9/year
Billed $108 annually, Cancel anytime.
Checkout for $12/month
Checkout for $108/yr
Secured by Stripe | AES-256 bit encryption