My Account
My Slides
Search by Category
Templates
View All Templates
Download Template Slides
Leave Feedback
Login
Logout
Get Started
Browse all Slides
Browse all Slides
Create a FREE Account
Instant access to 1,000+ real slides from top companies like McKinsey, BCG, Goldman Sachs, Google and many more!
First Name
Last Name
Email
Password
I agree to all
Terms & Privacy Policy
Thank you! Your submission has been received!
Oops! Something went wrong while submitting the form.
Have an account?
Sign in
Spark Your Next Big Idea with New Presentation Templates
VIEW ALL Templates
Welcome,
Welcome
PRO
Show Featured Only
Checkbox 8
Companies
Mckinsey
Bain
BCG
EY
Deloitte
Accenture
PwC/Strategy&
JP Morgan
Goldman Sachs
Morgan Stanley
Citigroup
Deutsche Bank
Barclays
LEK
KPMG
Kearney
Oliver Wyman
Booz Allen Hamilton
Gartner
IPSOS
Nielsen
Slide type
Text Only
Linear Flow
Vertical Flow
Single Chart
Header Horizontal
Mixed Chart
Header Vertical
Pillar
Multiple Chart
Graphic
Agenda
Title
Table
Framework
Industry
Technology & Software
Artificial Intelligence
Financial Services
Retail & E-commerce
Consumer Goods
Industrial & Manufacturing
Transportation & Logistics
Telecommunications
Real Estate & Construction
Hospitality & Tourism
Professional Services
Education & Training
Media & Entertainment
Agriculture & Food Production
Healthcare & Pharmaceuticals
Environmental Services & Sustainability
Government & Public Sector
Use Case
Mergers and Acquisitions
Performance Metrics and KPIs
Client Case Studies
Competitive Landscape
Corporate Finance and Valuation
Product and Service Analysis
Customer and Market Segmentation
Organizational Structure and Change
Industry Overview
Regulatory and Compliance
Risk Assessment and Management
Investment Analysis
Organizational Structure and Change
Human Resources and Talent Management
Financial Performance
Market Analysis and Trends
Sales and Business Development
Human Resources and Talent Management
Clear all
Thank you! Your submission has been received!
Oops! Something went wrong while submitting the form.
Tag
View slide
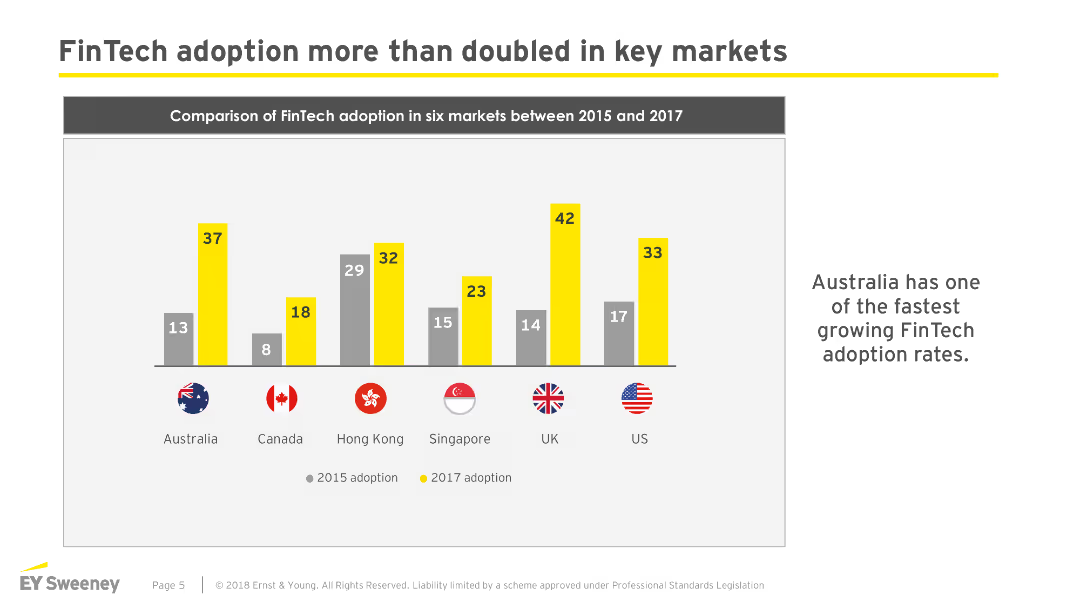
The slide features a column chart comparing FinTech adoption in six markets (Australia, Canada, Hong Kong, Singapore, UK, US) between 2015 and 2017.
Market Analysis and Trends
Financial Services
The slide shows that FinTech adoption has significantly increased in key markets from 2015 to 2017, highlighting Australia's notable growth rate.
FinTech, adoption, markets, comparison, growth
false
Market Analysis and Trends
Financial Services financial-services
Single Chart
EY
View slide
The slide features a multi-country comparison of FinTech adoption rates in 2015, 2017, and future projections using a column chart.
Market Analysis and Trends
Financial Services
The slide presents a global comparison of FinTech adoption, showing past, current, and future projected usage, indicating overall growth in various markets.
FinTech, adoption, momentum, global, projections
false
Market Analysis and Trends
Financial Services financial-services
Single Chart
EY
View slide
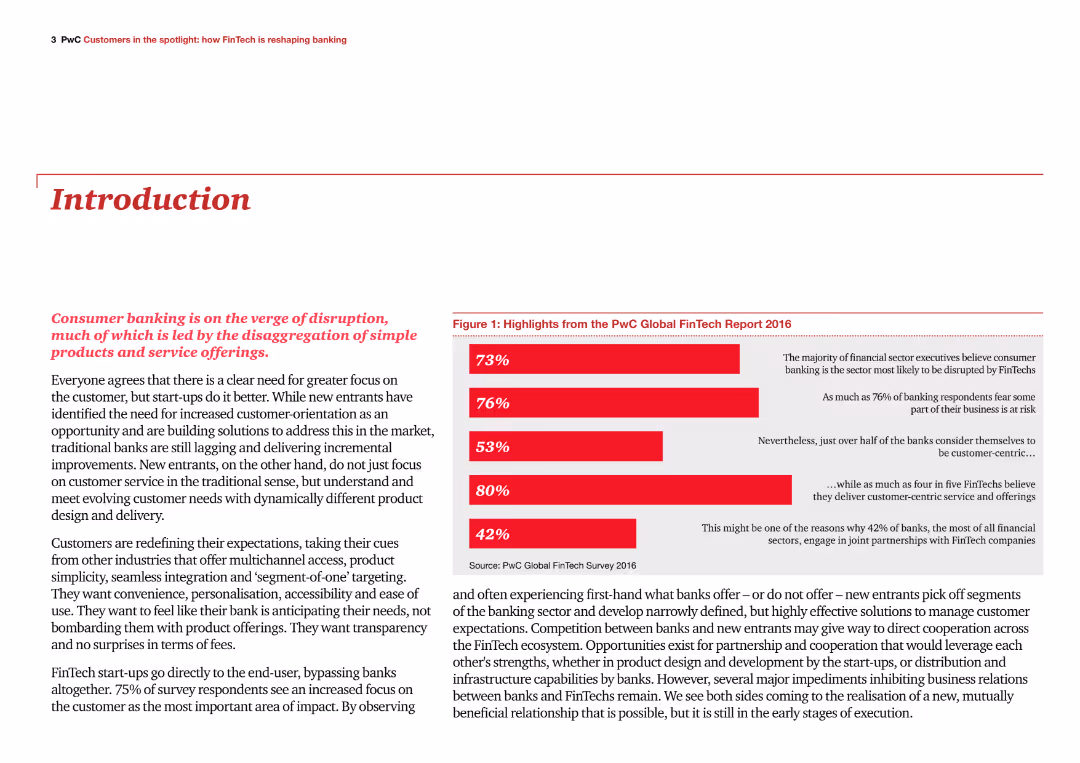
The slide has a title at the top, a paragraph of text, and a column chart on the right summarizing key highlights from the PwC Global FinTech Report 2016. The chart bars are in red, indicating different percentages.
Industry Overview
Financial Services
The slide introduces the report on how FinTech is reshaping banking, highlighting the disruptive impact on consumer banking and the importance of customer-centric approaches in the industry.
FinTech, banking, disruption, customer-centric, highlights
false
Industry Overview
Financial Services financial-services
Mixed Chart
PwC/Strategy&
View slide
The slide features two sets of bar charts comparing awareness and preference for traditional financial services in 2015 and 2017 across six markets.
Market Analysis and Trends
Financial Services
The slide illustrates the decline in barriers to FinTech adoption, such as lack of awareness and preference for traditional services, from 2015 to 2017 in various markets.
FinTech, barriers, adoption, awareness, traditional services
false
Market Analysis and Trends
Financial Services financial-services
Single Chart
EY
View slide
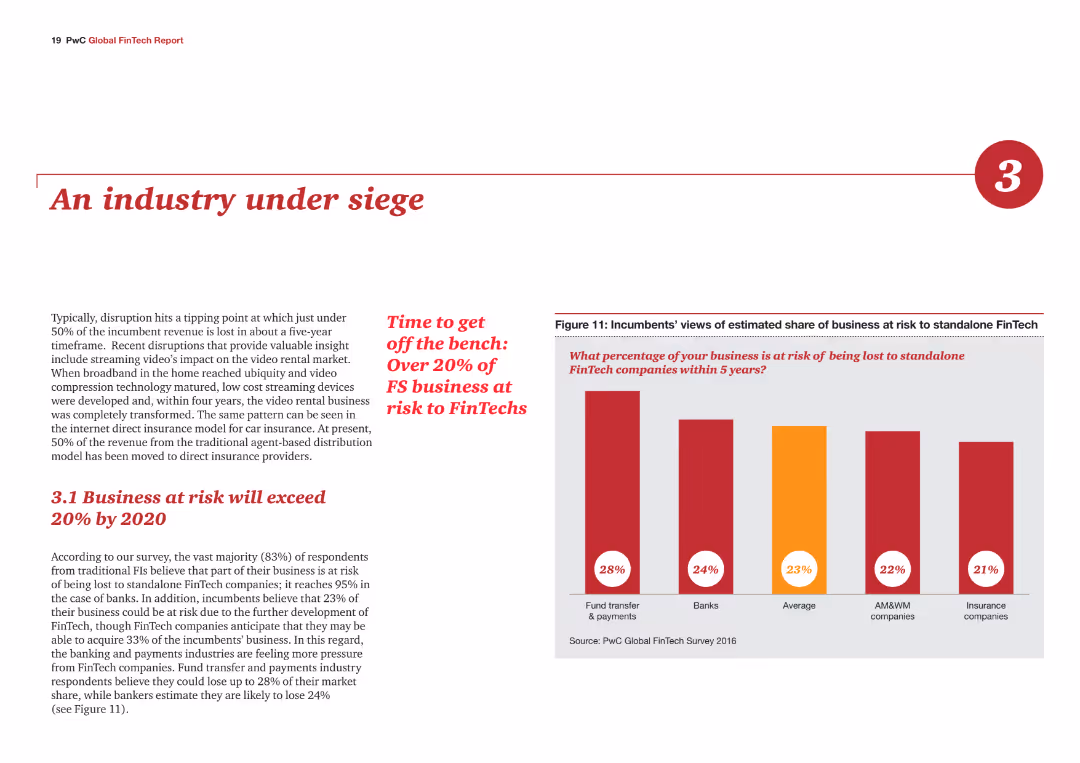
The slide includes a column chart and text. The chart shows the estimated share of business at risk to FinTech companies.
Risk Assessment and Management
Financial Services
The slide discusses the risk posed by FinTech companies to traditional financial services businesses.
FinTech, business risk, financial services, market share, disruption
false
Risk Assessment and Management
Financial Services financial-services
Mixed Chart
PwC/Strategy&
View slide
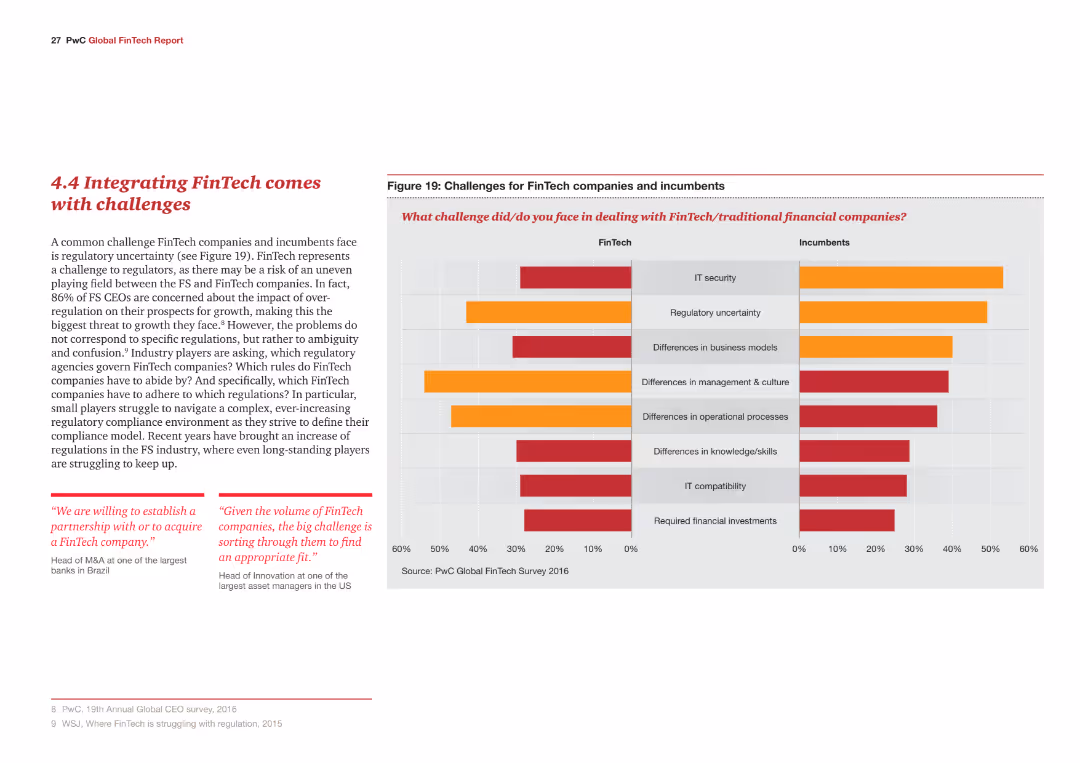
The slide contains a column chart comparing challenges faced by FinTech companies and incumbents, with challenges like IT security and regulatory uncertainty highlighted in different colors.
Risk Assessment and Management
Financial Services
The slide addresses challenges in integrating FinTech, such as regulatory uncertainty and differences in business models, and highlights the primary concerns of FS CEOs regarding over-regulation.
FinTech, challenges, regulatory, IT security, business models
false
Risk Assessment and Management
Financial Services financial-services
Multiple Chart
PwC/Strategy&
View slide
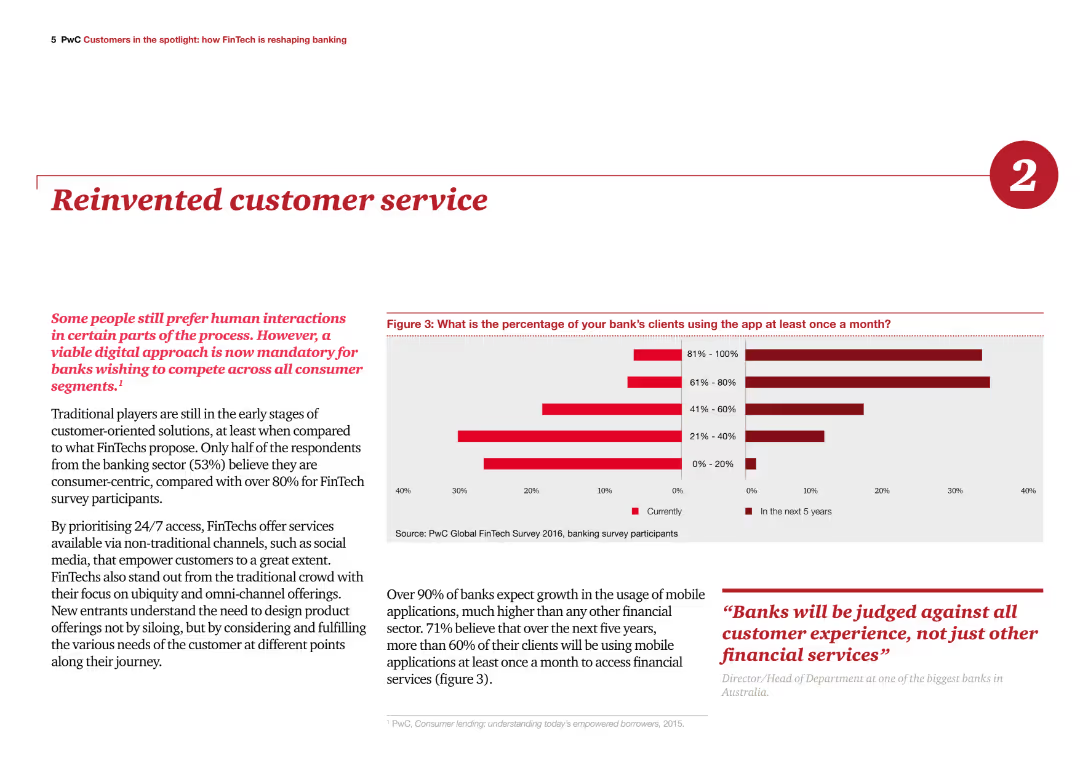
The slide includes a column chart showing the percentage of clients using banking apps, with a focus on digital approaches for customer service. Text on the left explains the necessity of digital solutions for banks.
Customer and Market Segmentation
Financial Services
The slide discusses the shift towards digital customer service in banking, highlighting survey results on app usage and stressing the need for banks to compete with FinTech in customer service innovation.
FinTech, customer service, digital, banking apps, innovation
false
Customer and Market Segmentation
Financial Services financial-services
Multiple Chart
PwC/Strategy&
View slide
The slide contains two column charts. The left chart compares digital financial service usage between FinTech users and non-users. The right chart shows adoption by age bracket.
Customer and Market Segmentation
Financial Services
The slide analyzes preferences for digital financial solutions among FinTech users compared to non-users, and details FinTech adoption rates across different age groups.
FinTech, digital solutions, user preferences, age demographics, adoption
false
Customer and Market Segmentation
Financial Services financial-services
Multiple Chart
EY
View slide
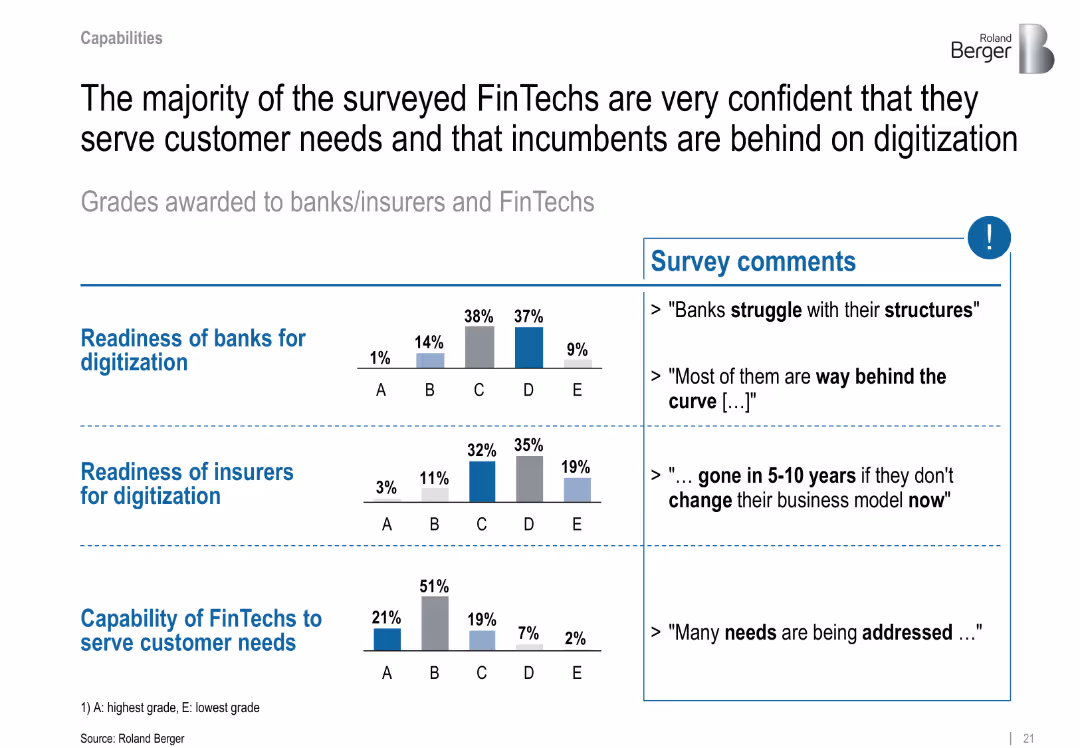
Two-column layout with text summary on the left and survey comments on the right; bar graphs show grading distributions; minimalistic style with blue highlight
Performance Metrics and KPIs
Financial Services
This slide shows FinTechs’ confidence in their customer-serving capabilities compared to banks and insurers, who are viewed as lagging in digitization. Survey comments emphasize institutional sluggishness and structural inefficiencies among incumbents.
FinTech, digitization, survey, customer needs, banks, insurers, grading, readiness, structural issues
false
Performance Metrics and KPIs
Financial Services financial-services
Mixed Chart
Roland Berger
View slide
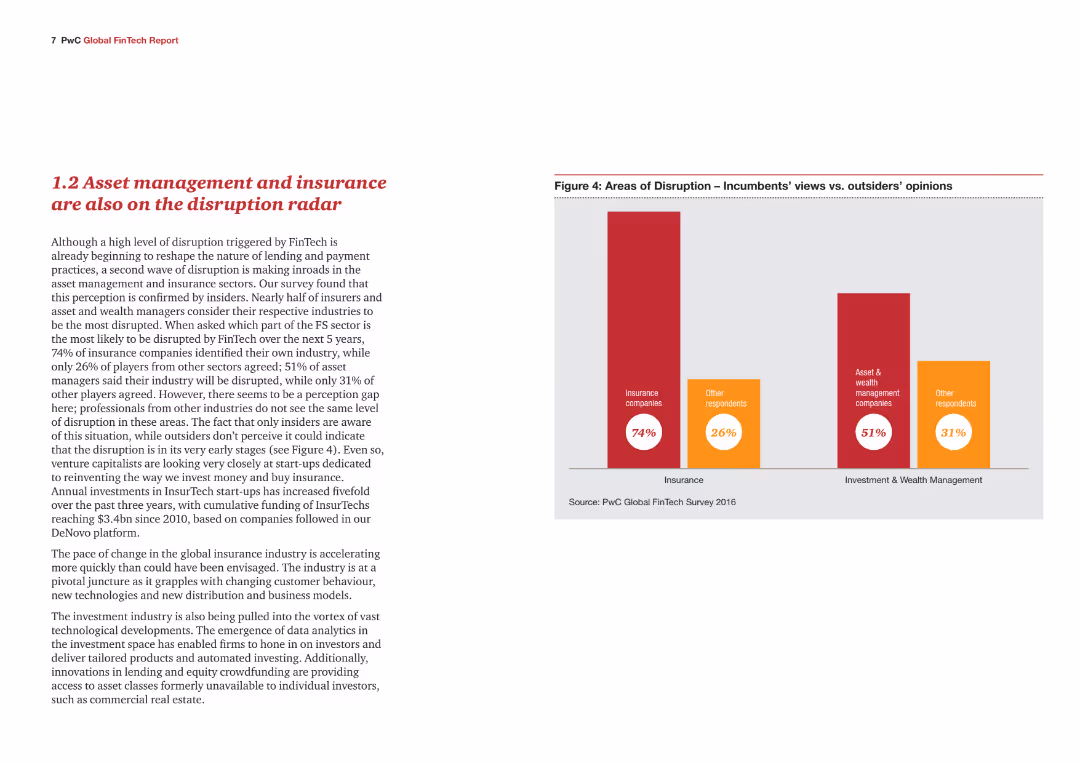
A content slide with text and a bar chart illustrating the survey results indicating high levels of expected disruption in asset management and insurance sectors. It shows the percentage of respondents from different sectors who anticipate significant disruption.
Market Analysis and Trends
Financial Services
This slide explores the anticipated disruption in the asset management and insurance sectors due to FinTech. It presents survey findings to show how these industries are expected to change, highlighting differing perceptions between industry insiders and other respondents.
FinTech, disruption, asset management, insurance, survey results, industry impact, bar chart
false
Market Analysis and Trends
Financial Services financial-services
Mixed Chart
PwC/Strategy&
View slide
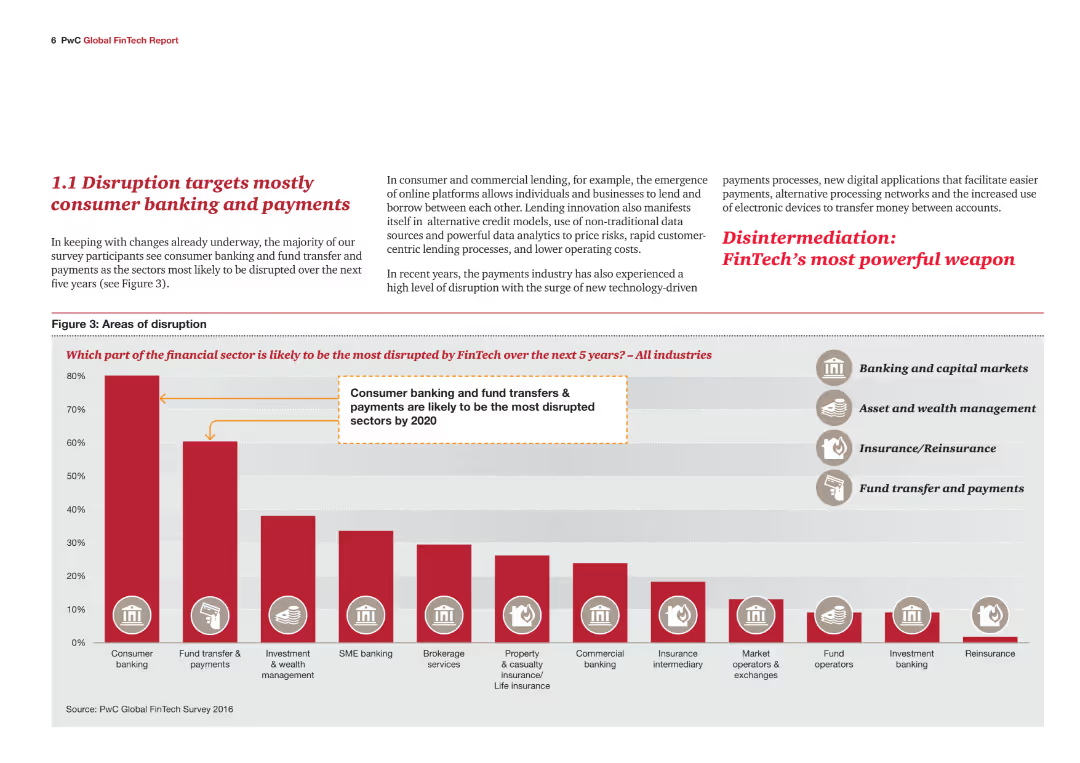
A content slide with text explaining the survey results showing that consumer banking and payments are the most likely sectors to be disrupted by FinTech. Includes a bar chart depicting the percentage of disruption expected in various financial sectors.
Market Analysis and Trends
Financial Services
This slide discusses the areas of the financial sector most likely to be disrupted by FinTech over the next five years, focusing on consumer banking and payments. It uses survey data to highlight trends and predict areas of significant technological impact.
FinTech, disruption, consumer banking, payments, survey results, financial sectors, bar chart
false
Market Analysis and Trends
Financial Services financial-services
Mixed Chart
PwC/Strategy&
View slide
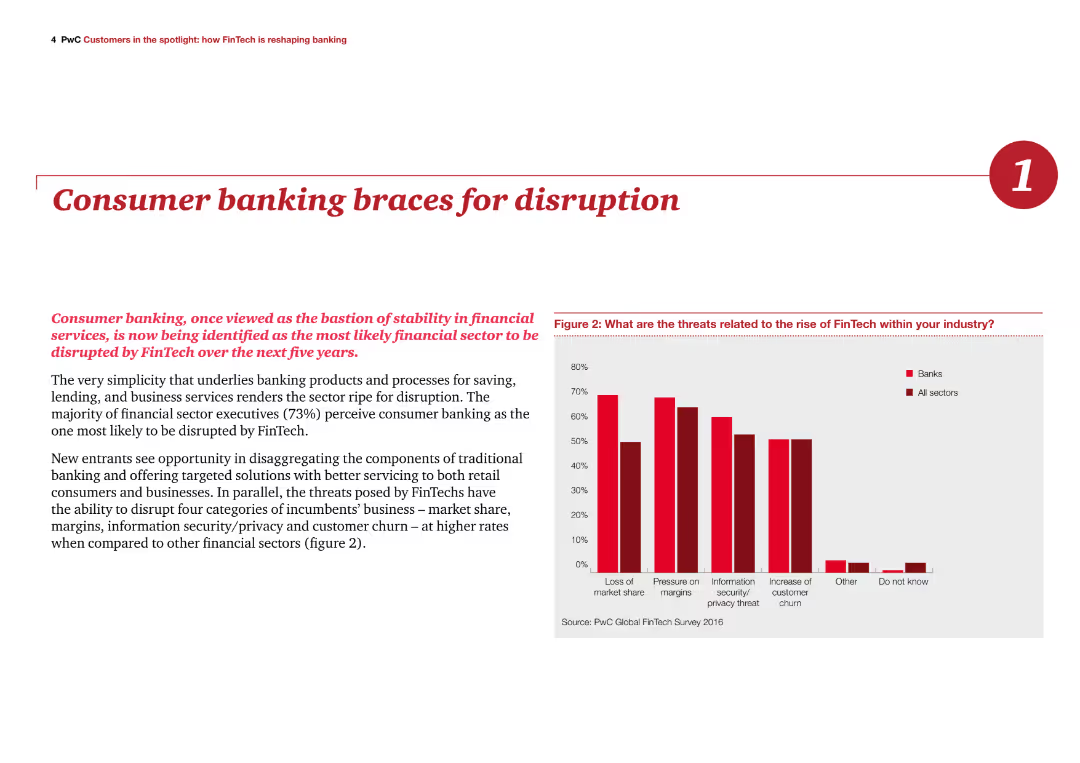
The slide features a column chart on the right illustrating threats posed by FinTech within the banking industry. The text discusses the disruption in consumer banking caused by FinTech advancements.
Market Analysis and Trends
Financial Services
The slide analyzes the threats and opportunities presented by FinTech in the consumer banking sector, emphasizing the potential for disruption and the need for banks to adapt to these changes.
FinTech, disruption, consumer banking, threats, opportunities
false
Market Analysis and Trends
Financial Services financial-services
Mixed Chart
PwC/Strategy&
View slide
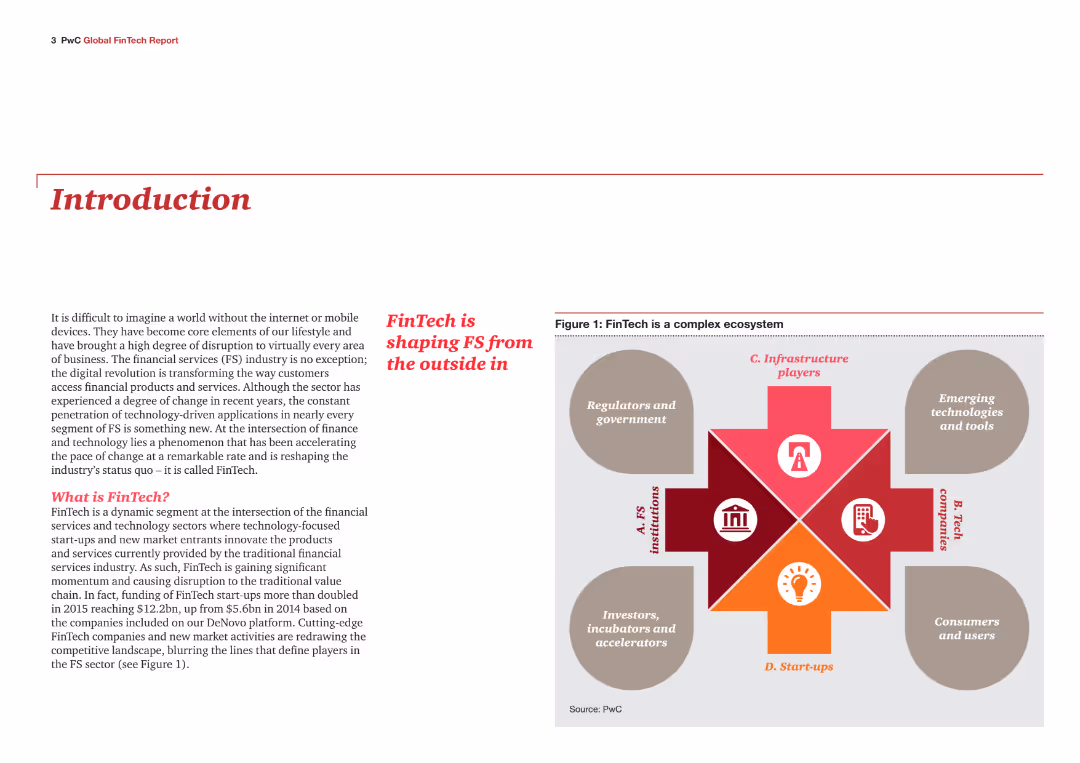
Introduction slide with text explaining the FinTech industry's impact on financial services. Includes an infographic showing the FinTech ecosystem, consisting of FS institutions, tech companies, start-ups, regulators, and government.
Industry Overview
Financial Services
This slide introduces the report on the FinTech industry's influence on financial services. It defines FinTech and highlights its role in transforming the industry through digital applications and technology-driven innovations, setting the stage for detailed analysis in the report.
FinTech, financial services, introduction, industry impact, digital transformation, ecosystem
false
Industry Overview
Financial Services financial-services
Diagram
PwC/Strategy&
View slide
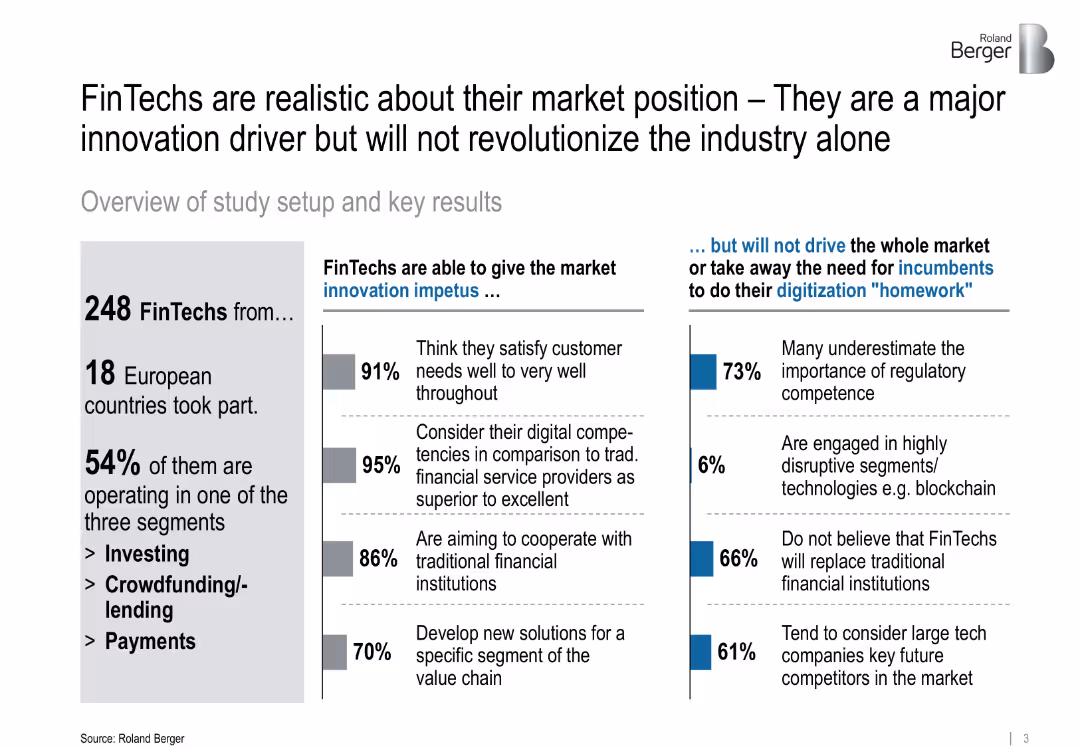
Split-panel layout with statistics, bullet points, and colored bars; simple visual style with balanced white space
Market Analysis and Trends
Financial Services
Highlights the realistic self-assessment of FinTechs in Europe, noting that while they are innovation drivers, they are not expected to revolutionize the market alone. The slide shares percentages on customer satisfaction, cooperation with traditional banks, and regulatory gaps.
FinTech, innovation, regulation, digitalization, cooperation, market drivers, blockchain, technology
false
Market Analysis and Trends
Financial Services financial-services
Mixed Chart
Roland Berger
View slide
Contains a column chart and a line graph depicting the amount of investment in USD million and number of deals across various sectors including FinTech, Real Estate, etc
Market Analysis and Trends
Financial Services
Analyzes sector-wise venture capital investment and deals in 2019, emphasizing FinTech's significant share of the market
FinTech, investment, VC, sectors, 2019
false
Market Analysis and Trends
Financial Services financial-services
Single Chart
McKinsey
View slide
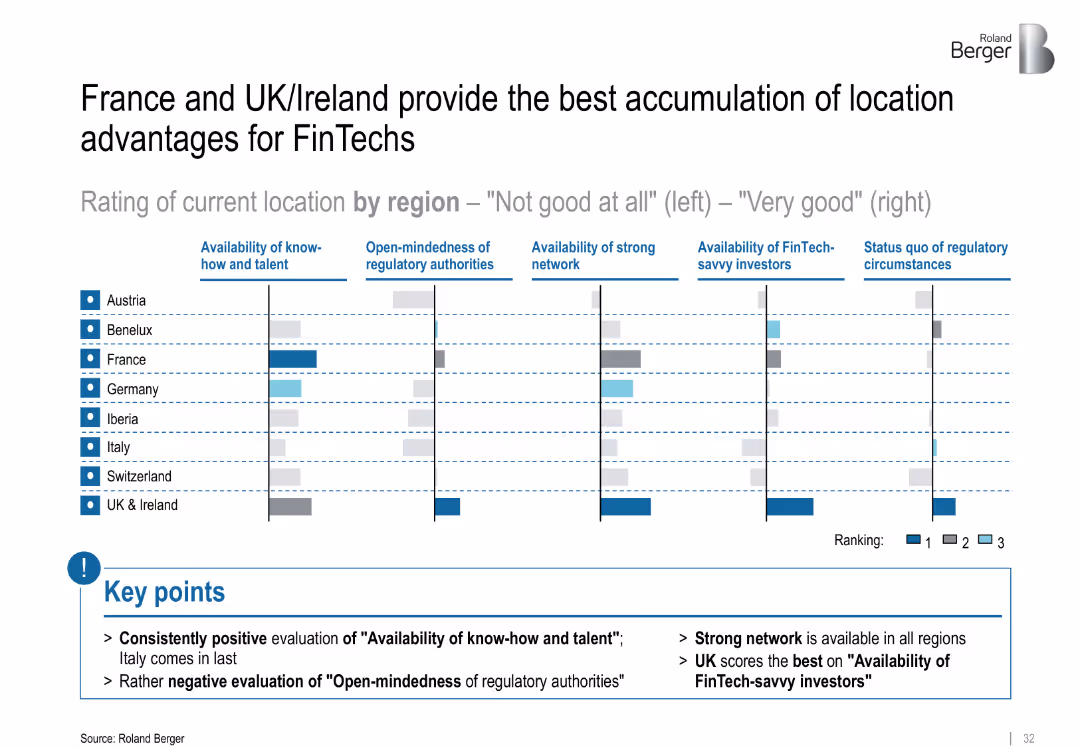
Comparative bar matrix showing location ratings across European regions; color-coded rankings (1–3); summary points highlighted below
Market Analysis and Trends
Financial Services
The slide benchmarks European regions based on FinTech-relevant criteria like talent, regulatory openness, and investor access. UK & Ireland and France rank highest across most factors. Italy scores poorly, particularly on regulatory openness.
FinTech, location analysis, regulatory openness, talent, investors, regional comparison, network
false
Market Analysis and Trends
Financial Services financial-services
Mixed Chart
Roland Berger
View slide
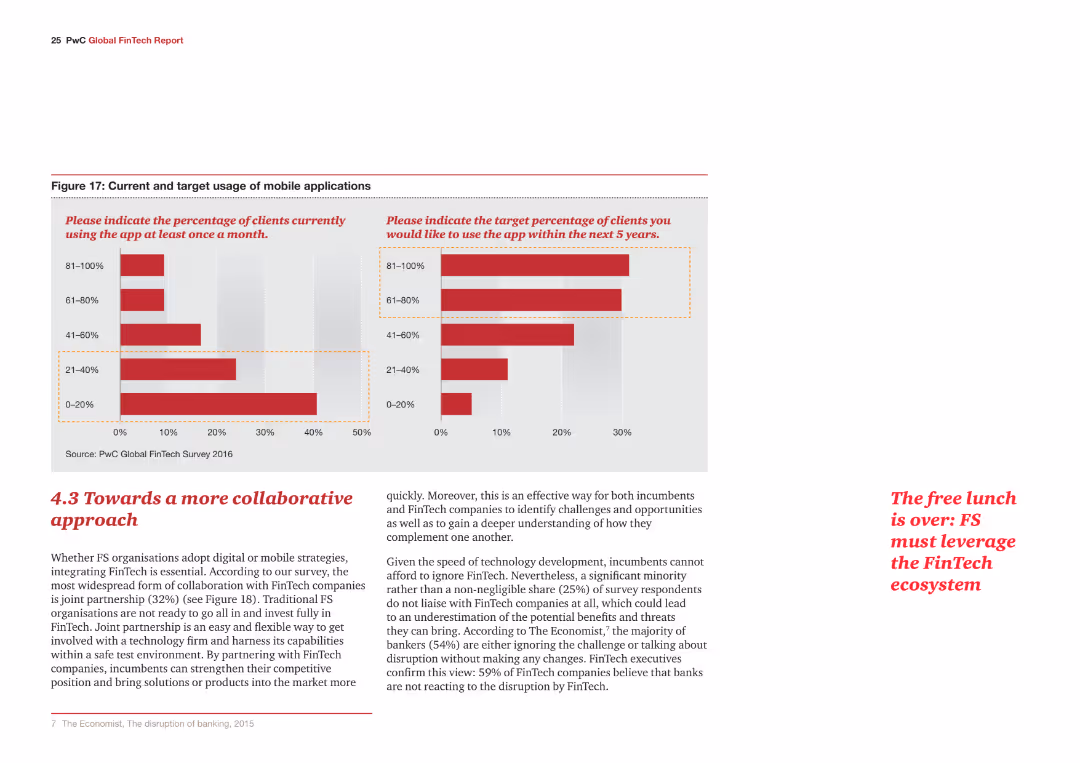
The slide includes two column charts comparing current and target usage of mobile applications, with red bars indicating usage percentages. Below the charts, a paragraph of text discusses the approach towards collaboration in FinTech.
Strategic Planning
Financial Services
The slide presents data on current and target usage of mobile applications and discusses the necessity for a collaborative approach in integrating FinTech for traditional financial service organizations.
FinTech, mobile applications, collaboration, strategy, integration
false
Strategic Planning
Financial Services financial-services
Multiple Chart
PwC/Strategy&
View slide
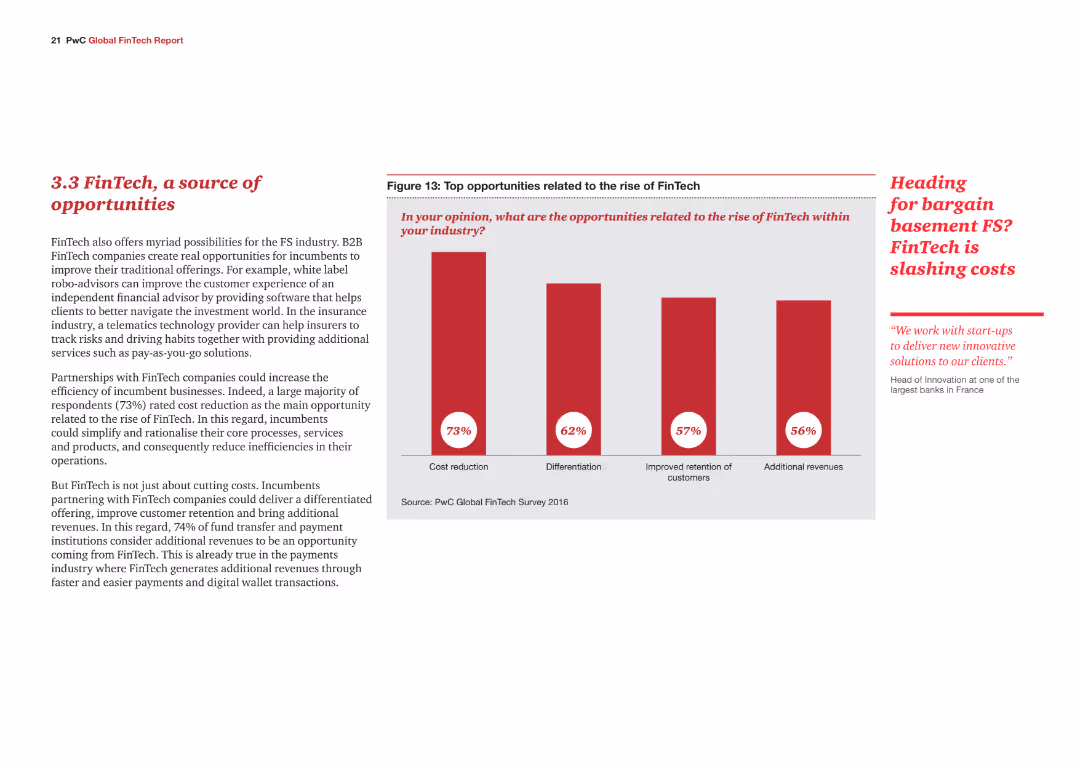
The slide contains a column chart and text. The chart outlines top opportunities related to the rise of FinTech.
Market Analysis and Trends
Financial Services
The slide highlights opportunities that FinTech presents to incumbents, such as cost reduction and improved customer retention.
FinTech, opportunities, cost reduction, customer retention, financial services
false
Market Analysis and Trends
Financial Services financial-services
Mixed Chart
PwC/Strategy&
View slide
The slide covers competition and advantages of Australia in FinTech through infographics and charts showing international competitiveness and revenue growth percentages.
Strategic Planning
Financial Services
The slide discusses the optimistic outlook for Australian FinTech, highlighting competitive advantages and significant revenue growth, alongside a comparison of local and international competition.
FinTech, outlook, optimism, competition, revenue growth, Australia
false
Strategic Planning
Financial Services financial-services
Mixed Chart
EY
View slide
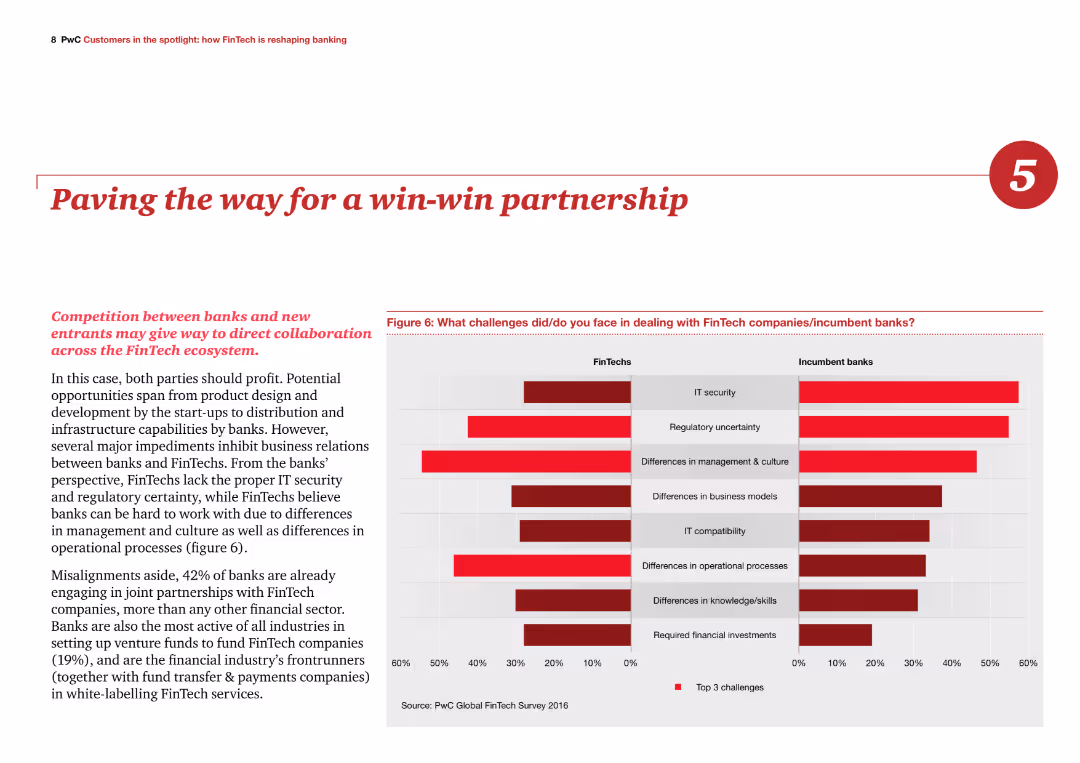
The slide features a column chart comparing challenges faced in dealing with FinTech companies versus incumbent banks. The text discusses the potential for collaborative partnerships between banks and FinTech.
Strategic Planning
Financial Services
The slide emphasizes the potential benefits of partnerships between banks and FinTech companies, addressing challenges such as IT security and regulatory uncertainty to achieve a mutually beneficial outcome.
FinTech, partnerships, collaboration, IT security, regulatory
false
Strategic Planning
Financial Services financial-services
Multiple Chart
PwC/Strategy&
View slide
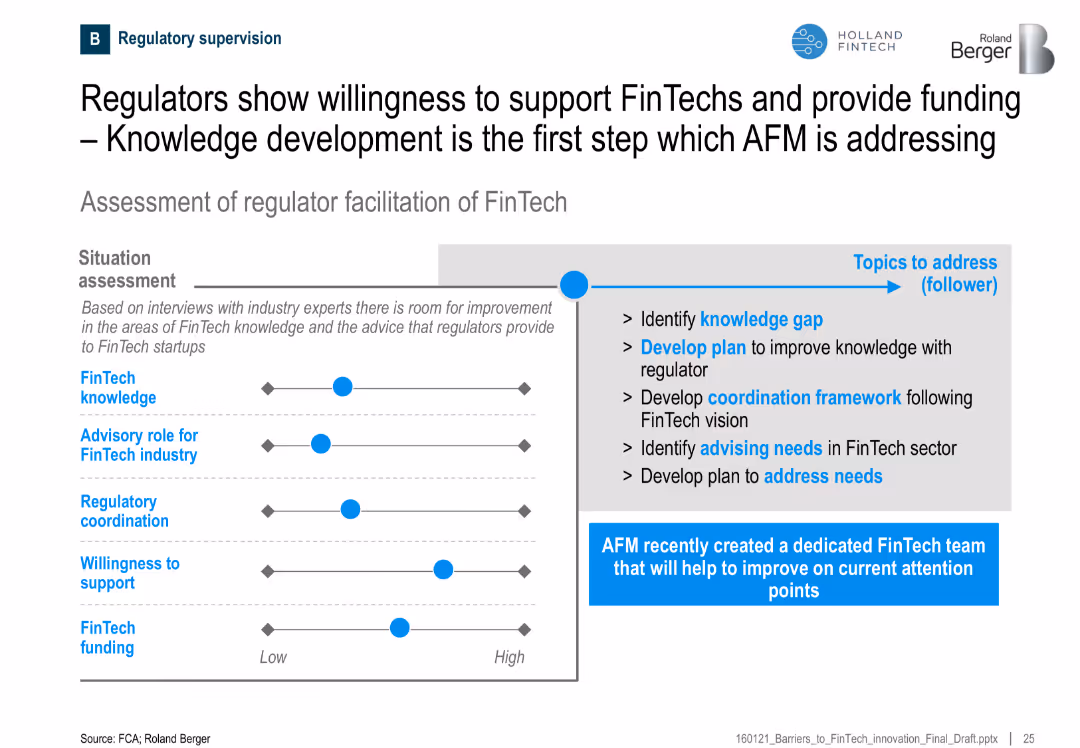
Horizontal layout with a slider-style assessment of regulatory aspects on the left and action points on the right
Regulatory and Compliance
Financial Services
This slide assesses the current state of regulator support for FinTechs and suggests areas of improvement, including knowledge development, coordination, and advisory roles. A dedicated FinTech team by AFM is highlighted.
FinTech, regulators, knowledge, support, coordination, advisory, funding, AFM
false
Regulatory and Compliance
Financial Services financial-services
Mixed Chart
Roland Berger
View slide
The slide contains multiple infographics and charts showing data on business locations, employee numbers, company age, types of FinTech, and end customers.
Industry Overview
Financial Services
The slide provides an overview of the FinTech sector in 2017, covering aspects such as business demographics, key competitors, types of FinTech, and target customers.
FinTech, sector profile, business demographics, competitors, customers
false
Industry Overview
Financial Services financial-services
Multiple Chart
EY
View slide
The slide compares FinTech category adoption rates in 2015 and 2017, featuring two sets of icon-based lists for different years, connected by an arrow.
Market Analysis and Trends
Financial Services
The slide highlights the shift in FinTech adoption from 2015 to 2017, showing increased adoption rates in categories like money transfer and insurance.
FinTech, services, players, adoption, trends
false
Market Analysis and Trends
Financial Services financial-services
Table
EY
View slide
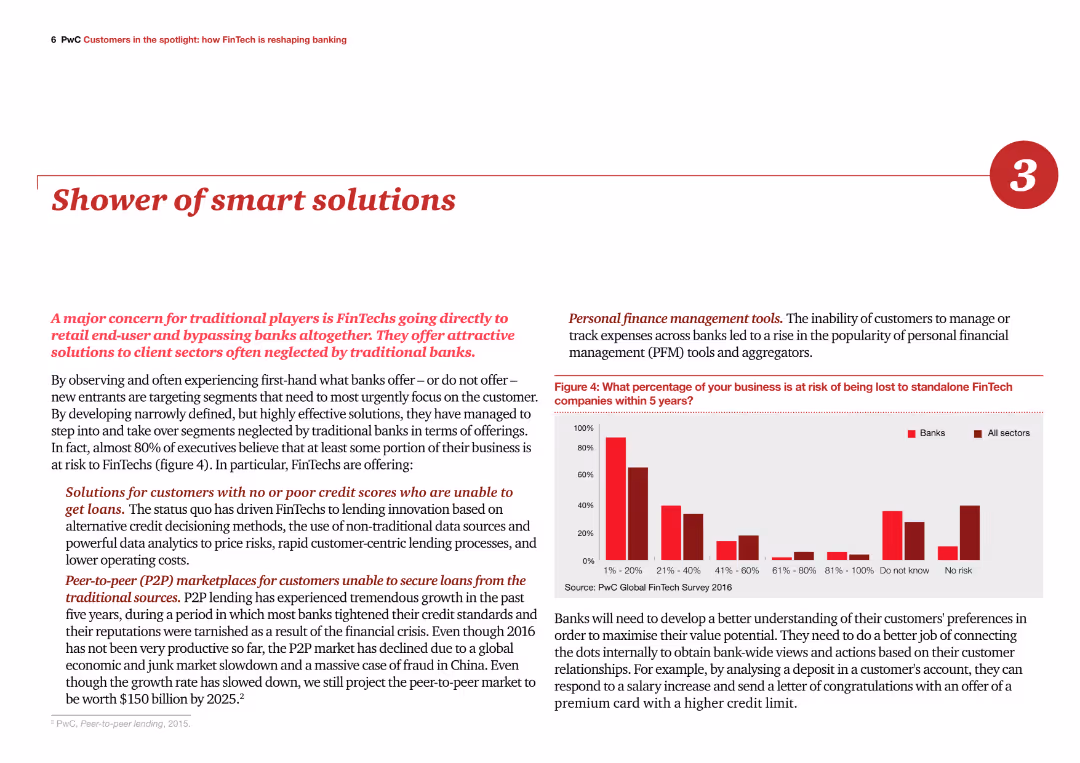
The slide features a column chart on the right showing the risk of losing business to FinTech companies. Text on the left highlights various smart solutions offered by FinTech, including personal finance tools and P2P lending.
Product and Service Analysis
Financial Services
The slide outlines the innovative solutions provided by FinTech to meet customer needs, emphasizing the risk traditional banks face if they do not adopt similar technologies and approaches.
FinTech, smart solutions, personal finance, P2P lending, risk
false
Product and Service Analysis
Financial Services financial-services
Mixed Chart
PwC/Strategy&
View slide
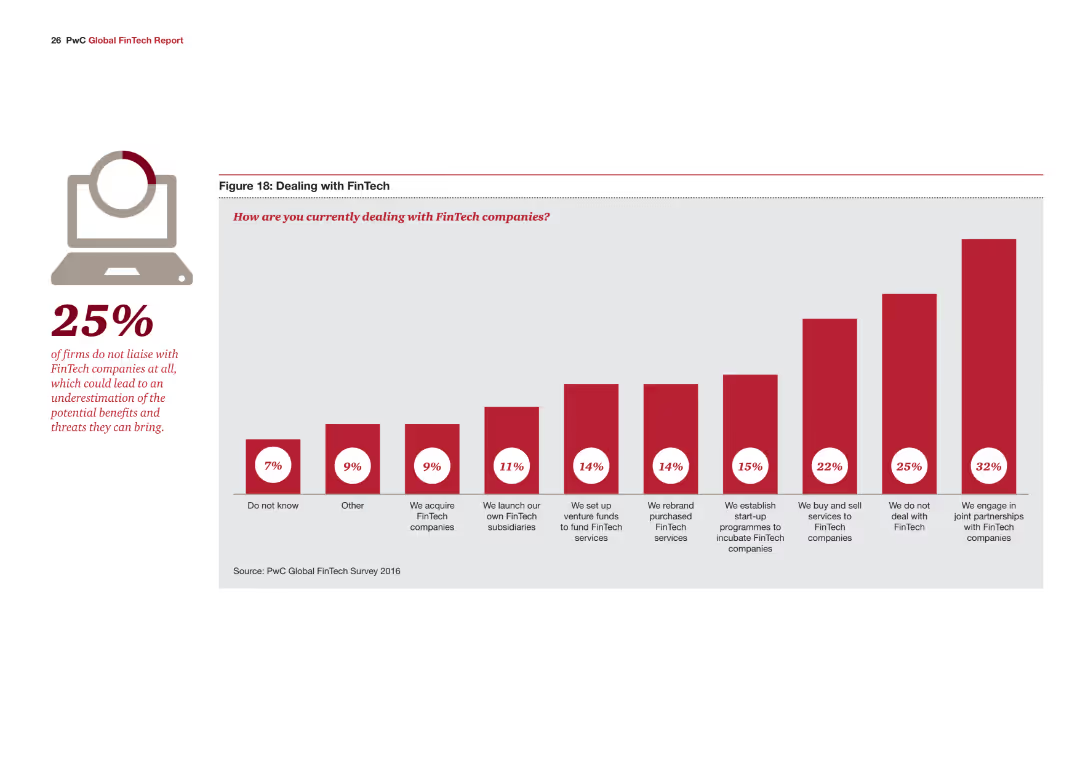
The slide features a single column chart detailing how companies are dealing with FinTech, with various strategies indicated by red bars. A large percentage (25%) is highlighted on the left side.
Risk Assessment and Management
Financial Services
The slide discusses different strategies companies are adopting to engage with FinTech, such as acquiring FinTech companies, setting up venture funds, or not dealing with FinTech at all.
FinTech, strategies, engagement, venture funds, risk management
false
Risk Assessment and Management
Financial Services financial-services
Mixed Chart
PwC/Strategy&
View slide
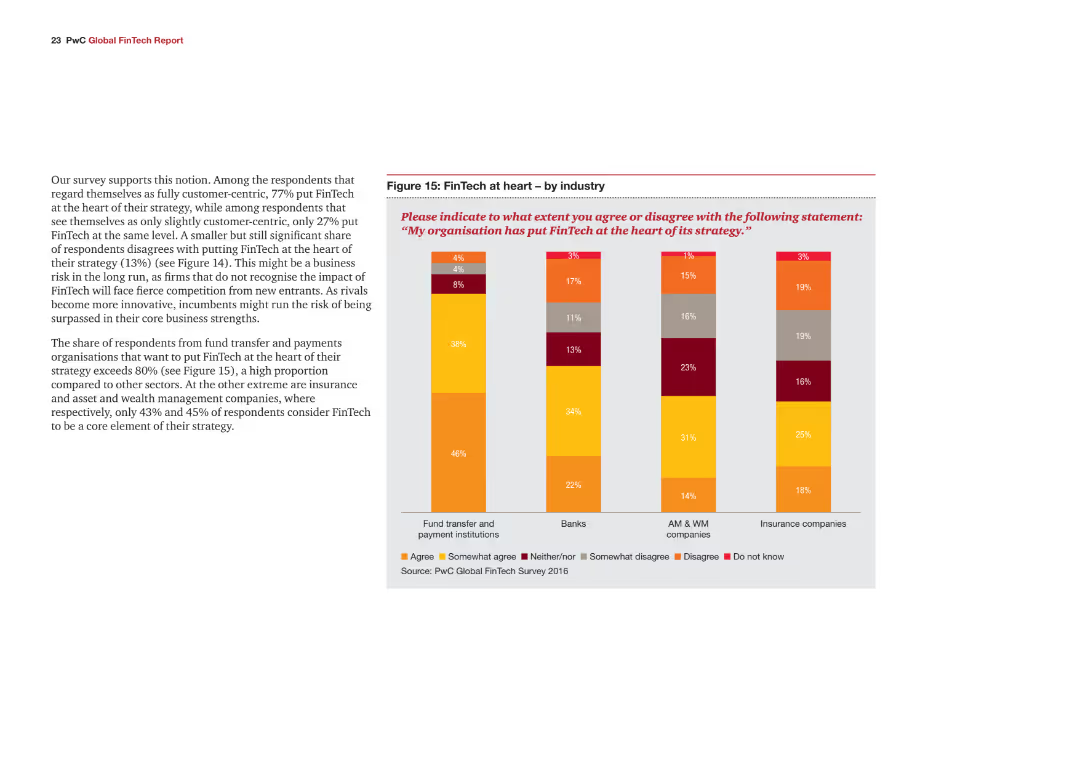
The slide features a bar chart and text. The chart shows the extent to which various industries have put FinTech at the heart of their strategy.
Strategic Planning
Financial Services
The slide highlights the importance of FinTech across different industries and how it is integrated into their strategies.
FinTech, strategy, financial services, industry comparison, technology
false
Strategic Planning
Financial Services financial-services
Mixed Chart
PwC/Strategy&
View slide
The slide features a pie chart and text. The chart shows the extent to which organizations have put FinTech at the heart of their strategy.
Strategic Planning
Financial Services
The slide emphasizes the importance of integrating FinTech into the core strategy of financial institutions.
FinTech, strategy, financial services, integration, technology
false
Strategic Planning
Financial Services financial-services
Mixed Chart
PwC/Strategy&
View slide
The slide is divided into sections covering talent, environment, demand, capital, and policy, with various charts and bullet points explaining each driver of success.
Strategic Planning
Financial Services
The slide identifies key drivers for FinTech success, such as talent availability, supportive environment, growing demand, access to capital, and favorable policy measures.
FinTech, success drivers, talent, environment, demand, capital, policy
false
Strategic Planning
Financial Services financial-services
Multiple Chart
EY
View slide
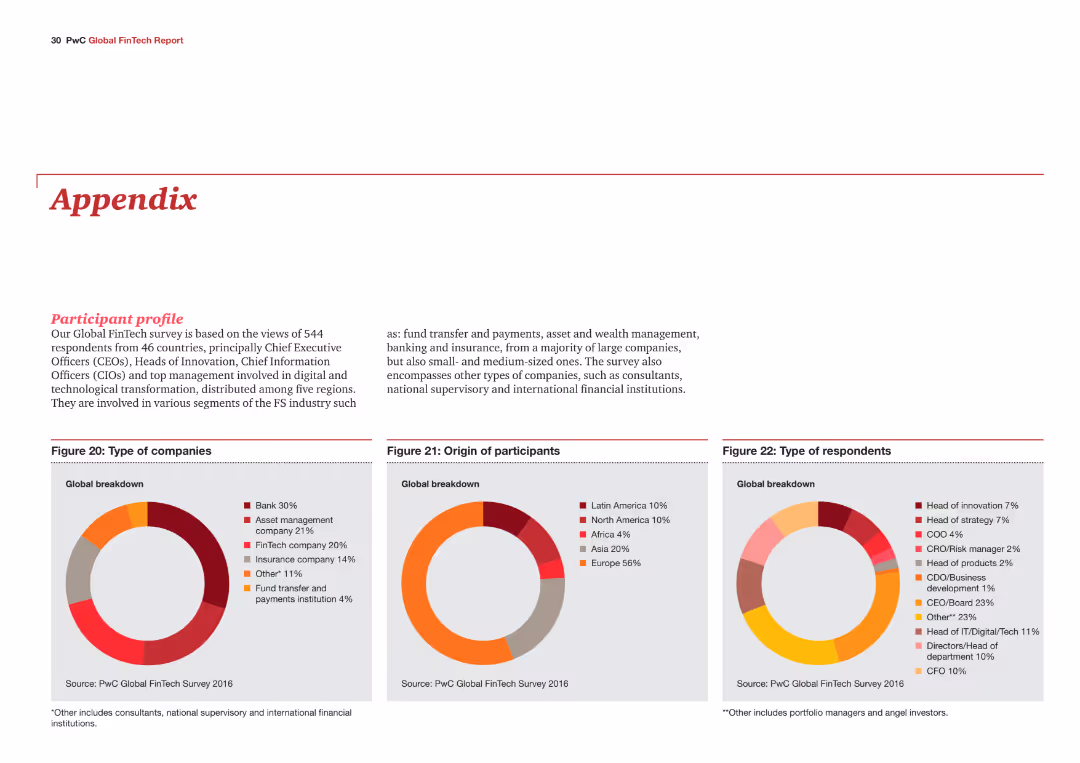
The slide includes three pie charts showing the types of companies, origin of participants, and types of respondents in the Global FinTech Survey. The charts are color-coded and labeled for clarity.
Market Analysis and Trends
Financial Services
The slide provides an overview of the participant profile in the Global FinTech Survey, detailing the types of companies involved, their geographical origin, and the roles of respondents.
FinTech, survey, participants, company types, roles
false
Market Analysis and Trends
Financial Services financial-services
Multiple Chart
PwC/Strategy&
View slide
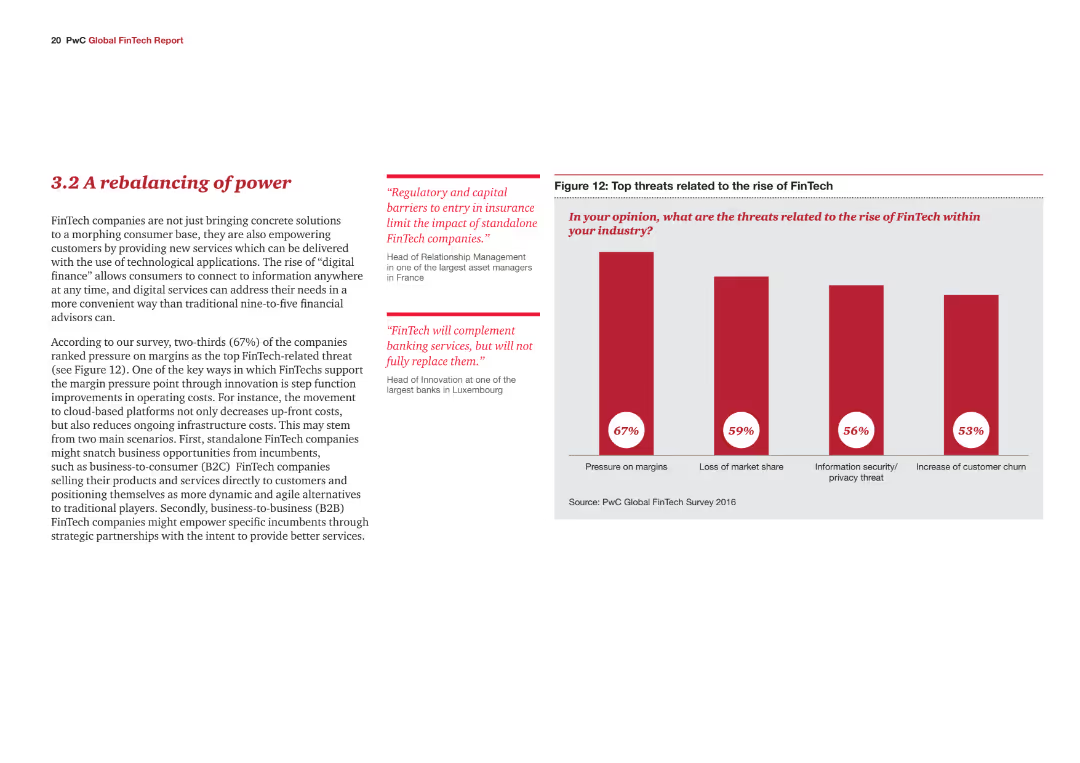
The slide features a column chart and text. The chart highlights top threats related to the rise of FinTech.
Competitive Landscape
Financial Services
The slide analyzes how FinTech is reshaping the financial services industry by presenting threats like margin pressure.
FinTech, threats, financial services, competitive landscape, market share
false
Competitive Landscape
Financial Services financial-services
Mixed Chart
PwC/Strategy&
Previous
Loading...
Hold On!
We are searching in our database
If nothing, comes up, please try different filters!
Column Chart
Heatmap
Chevron
Org Chart
Infographic
Callouts
Timeline
List
Graphic
Picture
Process Flow
Diagram
Paragraph
Map
Table
Framework
Subtitle
Takeaway Box
Icon
Other Chart
Radar Chart
Waterfall Chart
Mekko Chart
Pie Chart
Scatter Plot
Line Chart
Bar chart
Bullet points
Create a FREE account to continue browsing
Receive Instant Access to 1,000+ slides from companies like McKinsey, Google, and Goldman Sachs
First Name
Last Name
Email
Password
I agree to all
Terms & Privacy Policy
Thank you! Your submission has been received!
Oops! Something went wrong while submitting the form.
Have an account?
Sign in
Upgrade to PRO to Save slides
Advanced Search and Filters
Access to 15,000+ slides
Access to Category Pages
Save/Bookmark Slides
PowerPoint Template Library
Pick a Plan
MONTHLY
$12/month
Billed every month, Cancel anytime.
YEARLY
$9/year
Billed $108 annually, Cancel anytime.
Checkout for $12/month
Checkout for $108/yr
Secured by Stripe | AES-256 bit encryption