My Account
My Slides
Search by Category
Templates
View All Templates
Download Template Slides
Leave Feedback
Login
Logout
Get Started
Browse all Slides
Browse all Slides
Create a FREE Account
Instant access to 1,000+ real slides from top companies like McKinsey, BCG, Goldman Sachs, Google and many more!
First Name
Last Name
Email
Password
I agree to all
Terms & Privacy Policy
Thank you! Your submission has been received!
Oops! Something went wrong while submitting the form.
Have an account?
Sign in
Spark Your Next Big Idea with New Presentation Templates
VIEW ALL Templates
Welcome,
Welcome
PRO
Show Featured Only
Checkbox 8
Companies
Mckinsey
Bain
BCG
EY
Deloitte
Accenture
PwC/Strategy&
JP Morgan
Goldman Sachs
Morgan Stanley
Citigroup
Deutsche Bank
Barclays
LEK
KPMG
Kearney
Oliver Wyman
Booz Allen Hamilton
Gartner
IPSOS
Nielsen
Slide type
Text Only
Linear Flow
Vertical Flow
Single Chart
Header Horizontal
Mixed Chart
Header Vertical
Pillar
Multiple Chart
Graphic
Agenda
Title
Table
Framework
Industry
Technology & Software
Artificial Intelligence
Financial Services
Retail & E-commerce
Consumer Goods
Industrial & Manufacturing
Transportation & Logistics
Telecommunications
Real Estate & Construction
Hospitality & Tourism
Professional Services
Education & Training
Media & Entertainment
Agriculture & Food Production
Healthcare & Pharmaceuticals
Environmental Services & Sustainability
Government & Public Sector
Use Case
Mergers and Acquisitions
Performance Metrics and KPIs
Client Case Studies
Competitive Landscape
Corporate Finance and Valuation
Product and Service Analysis
Customer and Market Segmentation
Organizational Structure and Change
Industry Overview
Regulatory and Compliance
Risk Assessment and Management
Investment Analysis
Organizational Structure and Change
Human Resources and Talent Management
Financial Performance
Market Analysis and Trends
Sales and Business Development
Human Resources and Talent Management
Clear all
Thank you! Your submission has been received!
Oops! Something went wrong while submitting the form.
Tag
View slide
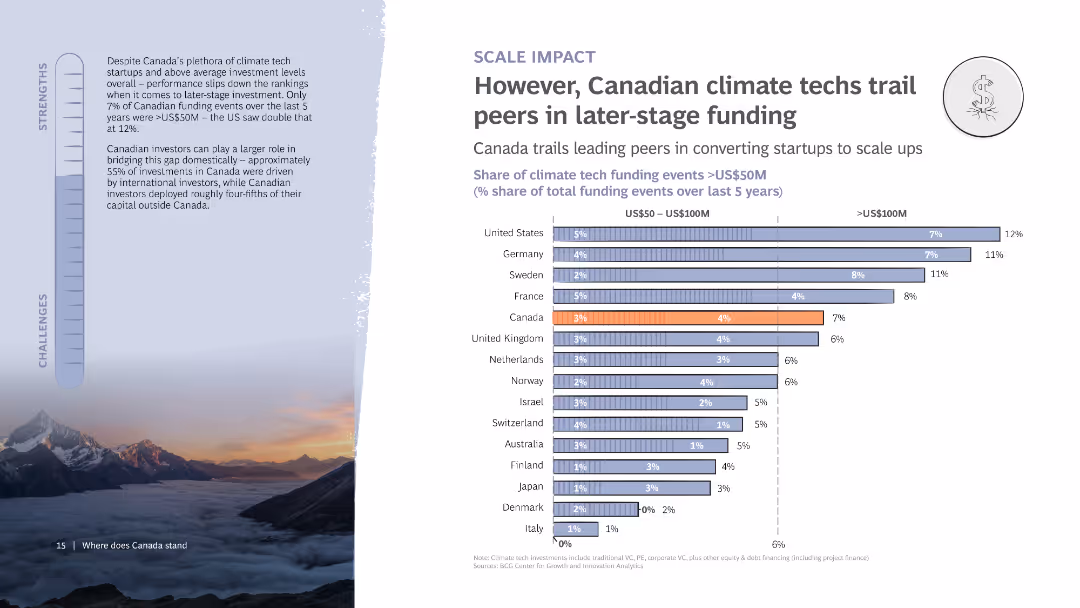
The slide shows a column chart comparing the share of climate tech funding events over $50M in various countries. It features text on the left discussing the challenges Canadian startups face in securing later-stage funding.
Investment Analysis
Financial Services
Examines Canada’s challenges in securing late-stage funding for climate tech startups, comparing funding events in other countries and discussing the implications for Canadian startups.
Funding, Climate tech, Canada, Investment, Chart
false
Investment Analysis
Financial Services financial-services
Mixed Chart
BCG
View slide
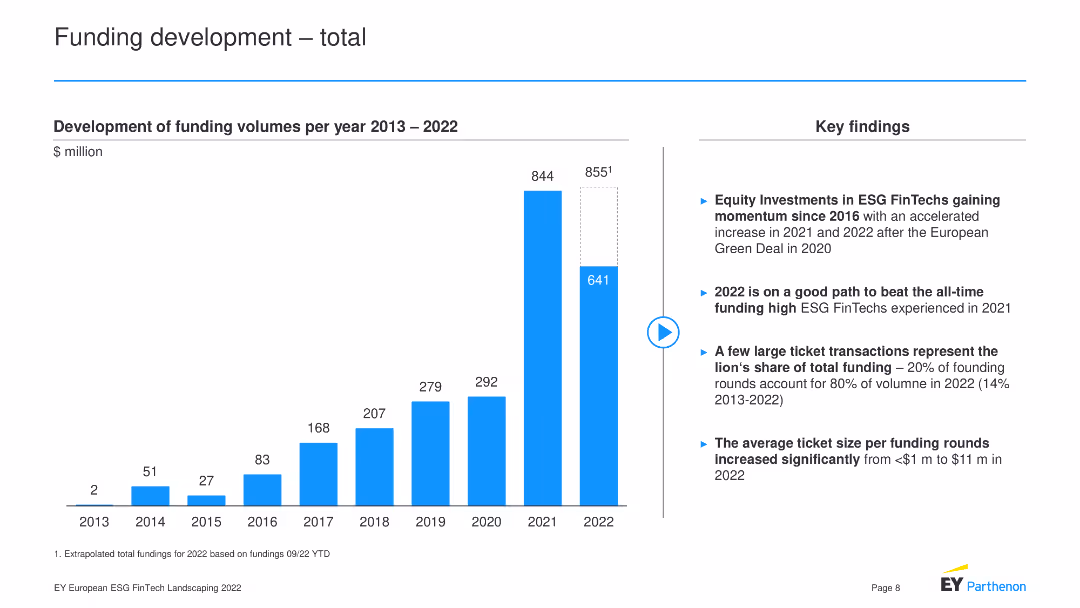
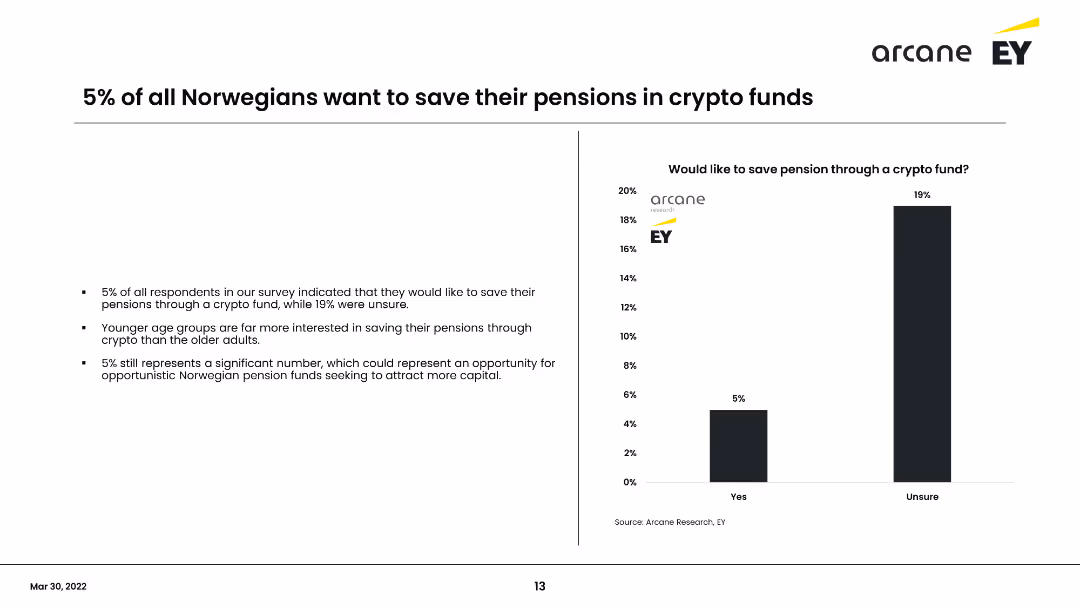
The slide contains a column chart showing the development of funding volumes per year from 2013 to 2022.
Market Analysis and Trends
Financial Services
The slide depicts the growth of funding volumes for ESG FinTech from 2013 to 2022, highlighting key findings such as the rise of equity investments, the potential for 2022 to surpass 2021's funding high, the concentration of large ticket transactions, and the increase in average ticket size per funding round.
Funding, ESG FinTech, Investment, Growth, Trends
false
Market Analysis and Trends
Financial Services financial-services
Mixed Chart
EY
View slide
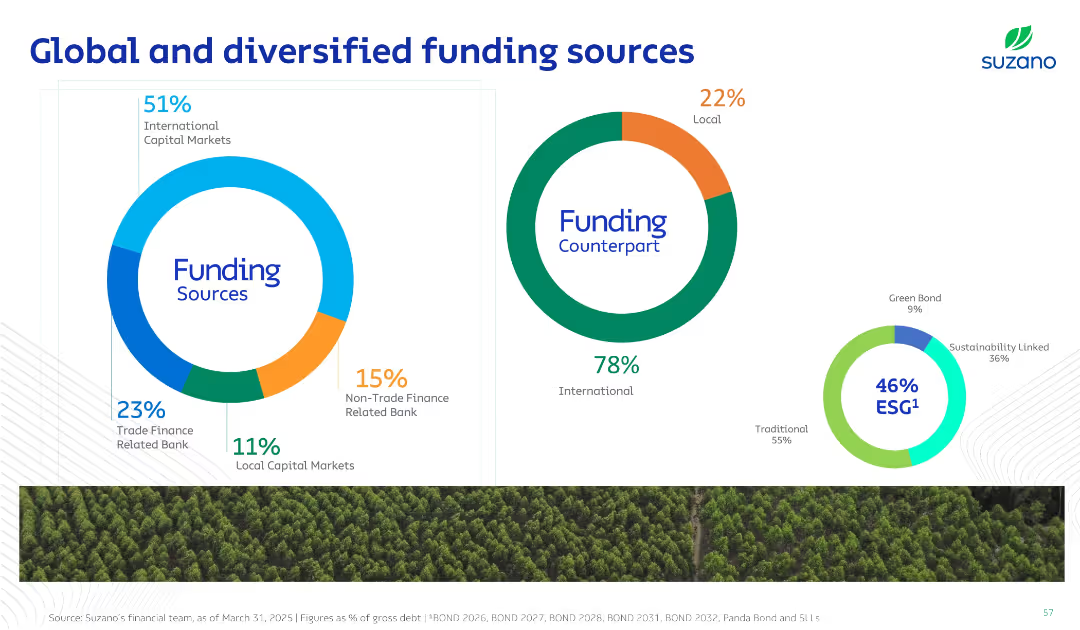
Three donut charts with distinct color schemes showing funding source distribution, counterpart breakdown (local/international), and ESG vs traditional debt split.
Investment Analysis
Consumer Goods
This slide visualizes the diversification of Suzano’s funding sources, highlighting a strong reliance on international capital and significant ESG-aligned funding. It emphasizes strategic capital sourcing and sustainability.
Funding, ESG, Capital Markets, Diversification, Debt
false
Investment Analysis
Consumer Goods consumer-goods
Single Chart
Goldman Sachs
View slide
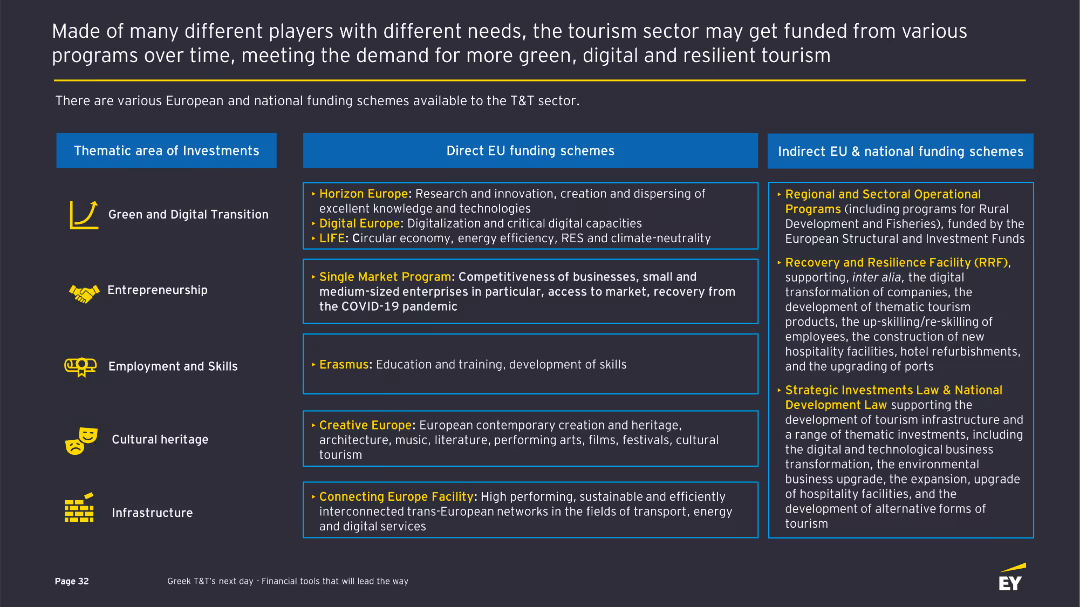
This slide details various European and national funding schemes available to the T&T sector. It categorizes the schemes into thematic areas of investment, such as green transition, entrepreneurship, and cultural heritage, with descriptions of each.
Financial Performance
Hospitality & Tourism
Describes funding opportunities for the T&T sector, covering EU and national programs aimed at green transition, digital capacities, entrepreneurship, and infrastructure. Lists specific funding schemes and their objectives.
Funding, EU programs, Investment, Green transition, Entrepreneurship
false
Financial Performance
Hospitality & Tourism hospitality-and-tourism
Table
EY
View slide
This slide details various European and national funding schemes available to the T&T sector. It categorizes the schemes into thematic areas of investment, such as green transition, entrepreneurship, and cultural heritage, with descriptions of each.
Financial Performance
Hospitality & Tourism
Describes funding opportunities for the T&T sector, covering EU and national programs aimed at green transition, digital capacities, entrepreneurship, and infrastructure. Lists specific funding schemes and their objectives.
Funding, EU programs, Investment, Green transition, Entrepreneurship
false
Financial Performance
Hospitality & Tourism hospitality-and-tourism
Mixed Chart
EY
View slide
Moderate complexity with three column charts representing funding in FinTech, HealthTech, and EdTech sectors, alongside descriptive text blocks.
Investment Analysis
Financial Services
Reviews the consistent increase in funding value for emerging sectors like FinTech, HealthTech, and EdTech, with specific mentions of significant deals and momentum.
Funding, FinTech, HealthTech, EdTech, growth
false
Investment Analysis
Financial Services financial-services
Mixed Chart
Bain
View slide
The slide has a pie chart in various colors representing funding sources, accompanied by text sections with detailed financial information.
Corporate Finance and Valuation
Financial Services
This slide provides insights into a financial institution's funding strategy and its impact on net interest margin. It is suitable for financial analysis and understanding the conservative approach in managing capital and interest earnings.
Funding, Financial Strategy, Net Interest Margin, Borrowings, Deposits, Conservative, Capital Management
false
Corporate Finance and Valuation
Financial Services financial-services
Mixed Chart
Morgan Stanley
View slide
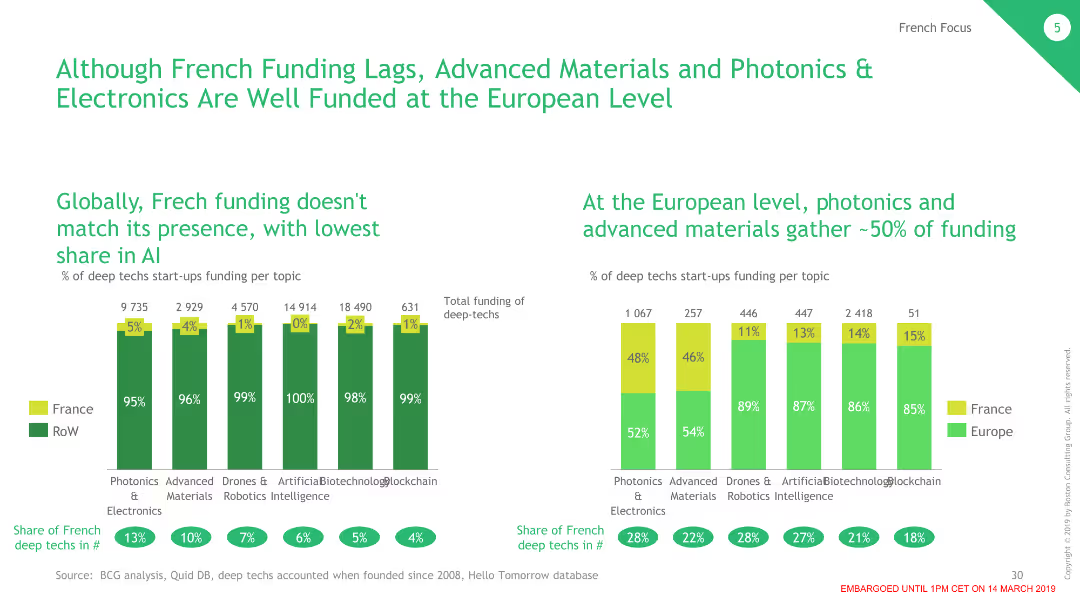
The slide contains two column charts. The left chart shows the percentage of French deep tech startups funding by category, and the right chart compares the funding shares between France and Europe.
Investment Analysis
Technology & Software
This slide discusses the disparity in funding for deep tech startups in France, noting strong funding in advanced materials and photonics & electronics, but overall lower investment compared to Europe.
Funding, France, Deep Tech, Investment, Comparison
false
Investment Analysis
Technology & Software technology-and-software
Multiple Chart
BCG
View slide
The slide shows a dark theme with two divided column charts comparing the unsecured funding mix between years. Text blocks detail the growth in deposits and total assets in bank entities.
Financial Performance
Financial Services
Aimed at depicting the funding strategy improvement over time, the slide contrasts the wholesale unsecured and deposit percentages from 2019 to 2022.
Funding, Liquidity, Deposits, Unsecured, Assets, Banks, Growth, Strategy
false
Financial Performance
Financial Services financial-services
Mixed Chart
Goldman Sachs
View slide
The slide showcases vertical column charts with a blue and grey color scheme, displaying the changes in private funding value across different sectors from 2019 to H1 2023 in the Philippines. Each sector is represented by a stacked column, showing the trend of funding before and after the pandemic peak, along with the number of deals. The layout is clear and informative, with a focus on presenting the data succinctly.
Investment Analysis
Financial Services
It illustrates the significant drop in private funding in the Philippines post-pandemic, with a specific focus on digital financial services. This slide serves as an analytical resource for investors and financial analysts to understand the impact of the pandemic on investment trends and to strategize for recovery and future funding allocations.
Funding, Pandemic, Philippines, Digital Financial Services, Investment Trends, Recovery, Analysis
false
Investment Analysis
Financial Services financial-services
Single Chart
Bain
View slide
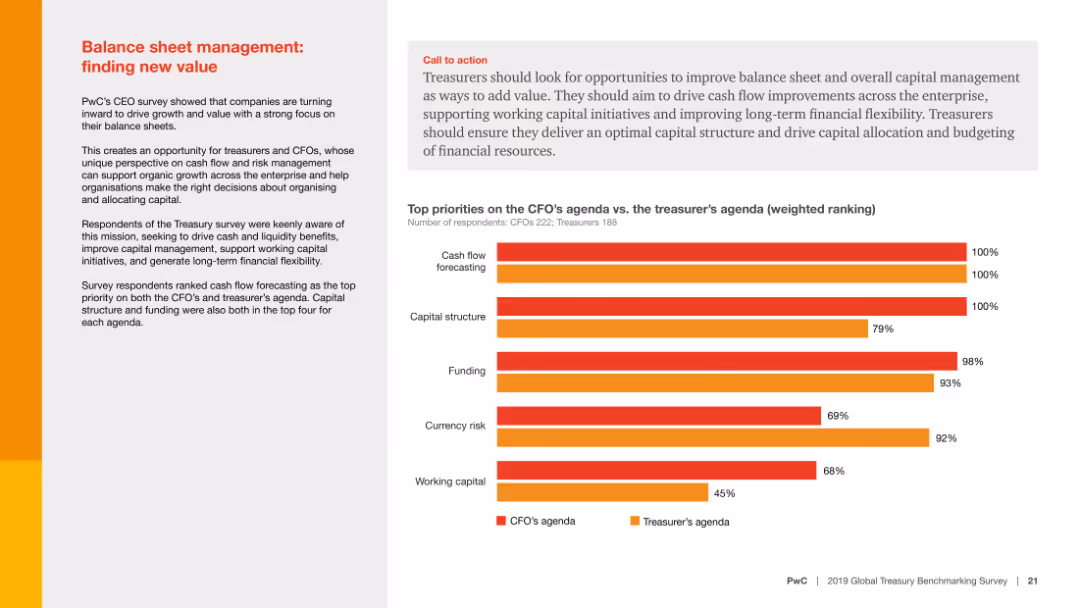
A column chart shows criteria for selecting banking partners. The text highlights the importance of long-term funding in banking relationships.
Investment Analysis
Financial Services
Emphasizes the need for long-term funding when choosing banking partners and provides criteria organizations consider important when selecting these partners.
Funding, banking, relationships, criteria, selection
false
Investment Analysis
Financial Services financial-services
Mixed Chart
PwC/Strategy&
View slide
Moderate complexity with multiple column charts representing funding stages from Seed to Series E+. Text blocks to the side provide context for the visual data.
Investment Analysis
Financial Services
Discusses trends in early-stage funding, noting its strength, and highlights the plateau in mid-stage funding with accompanying visual data on investment stages.
Funding, early-stage, mid-stage, plateau
false
Investment Analysis
Financial Services financial-services
Mixed Chart
Bain
View slide
Column charts showing group funding by year and quarter, with percentage breakdowns of shareholders equity, debt, and deposits.
Financial Performance
Financial Services
Overview of UBS group funding from 2020 to 3Q23, highlighting changes in shareholder equity, debt, and customer deposits.
Funding, equity, debt, deposits, trends
false
Financial Performance
Financial Services financial-services
Multiple Chart
UBS
View slide
Moderate complexity with four column charts comparing funding in key sectors, accompanied by a comprehensive text explanation on the right side.
Market Analysis and Trends
Financial Services
Evaluates funding trends in mature and consolidated sectors, indicating a slowdown, and offers a detailed analysis of unicorn and other investments.
Funding, mature sectors, consolidation, slowdown
false
Market Analysis and Trends
Financial Services financial-services
Mixed Chart
Bain
View slide
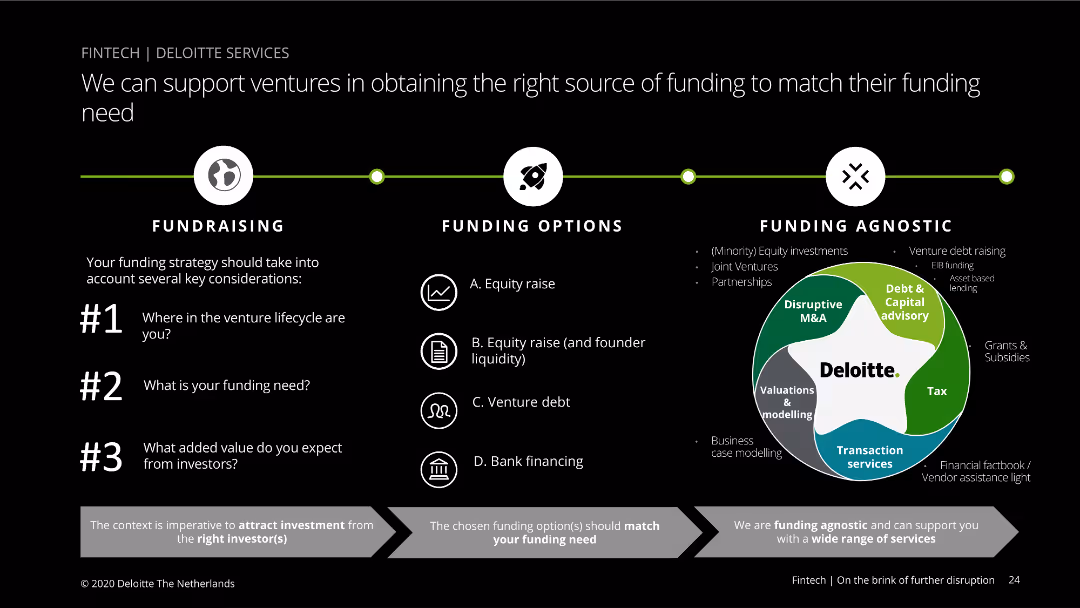
The slide features a diagram with three main funding categories: Fundraising, Funding Options, and Funding Agnostic. It includes bullet points and a circular diagram to explain different funding sources and strategies. Visual complexity is moderate.
Financial Performance
Financial Services
This slide explains the various funding options available for ventures, highlighting key considerations in the fundraising process and detailing different funding sources such as equity raise, venture debt, and bank financing.
Funding, ventures, options, equity, debt, bank, Deloitte
false
Financial Performance
Financial Services financial-services
Linear Flow
Deloitte
View slide
Contains column charts, textual information, and bullet points highlighting key metrics, with a dashed outline box.
Financial Performance
Financial Services
Slide shows strong performance and inflows in asset and wealth management, with a focus on alternatives fundraising surpassing targets. Likely used in investor relations or financial strategy meetings.
Fundraising, Asset Management, Performance, Inflows
false
Financial Performance
Financial Services financial-services
Mixed Chart
Goldman Sachs
View slide
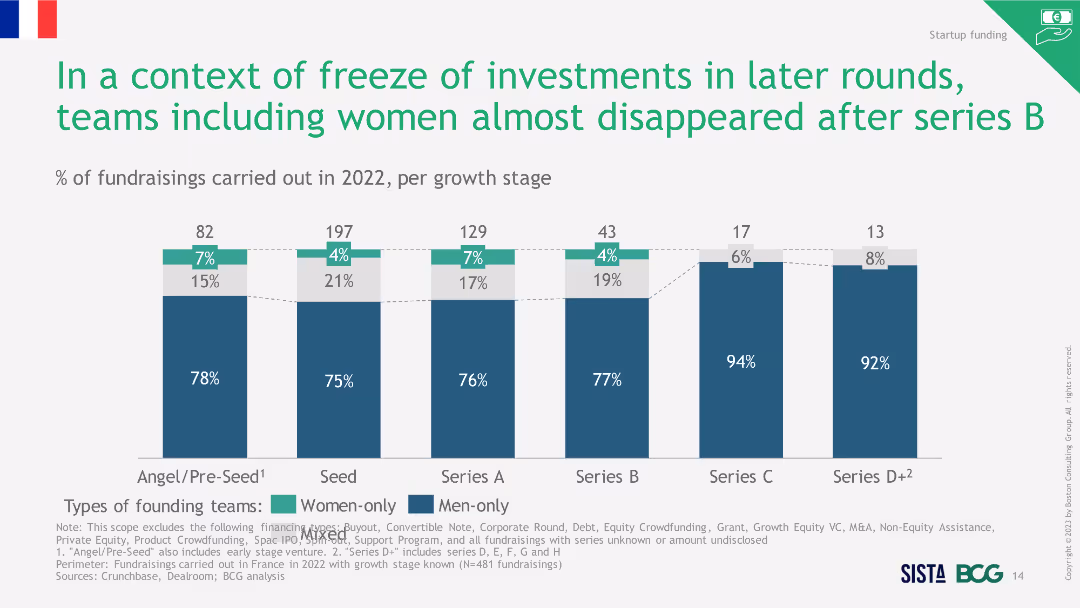
Column chart showing percentage of fundraisings in 2022 per growth stage. The slide uses a combination of blue and green bars to differentiate between women-only, men-only, and mixed founding teams.
Investment Analysis
Financial Services
This slide highlights the declining trend in fundraisings involving women after Series B funding stages in 2022. It shows the percentage distribution of different team types across various growth stages.
Fundraising, Investment, Women, Teams, Stages
false
Investment Analysis
Financial Services financial-services
Single Chart
BCG
View slide
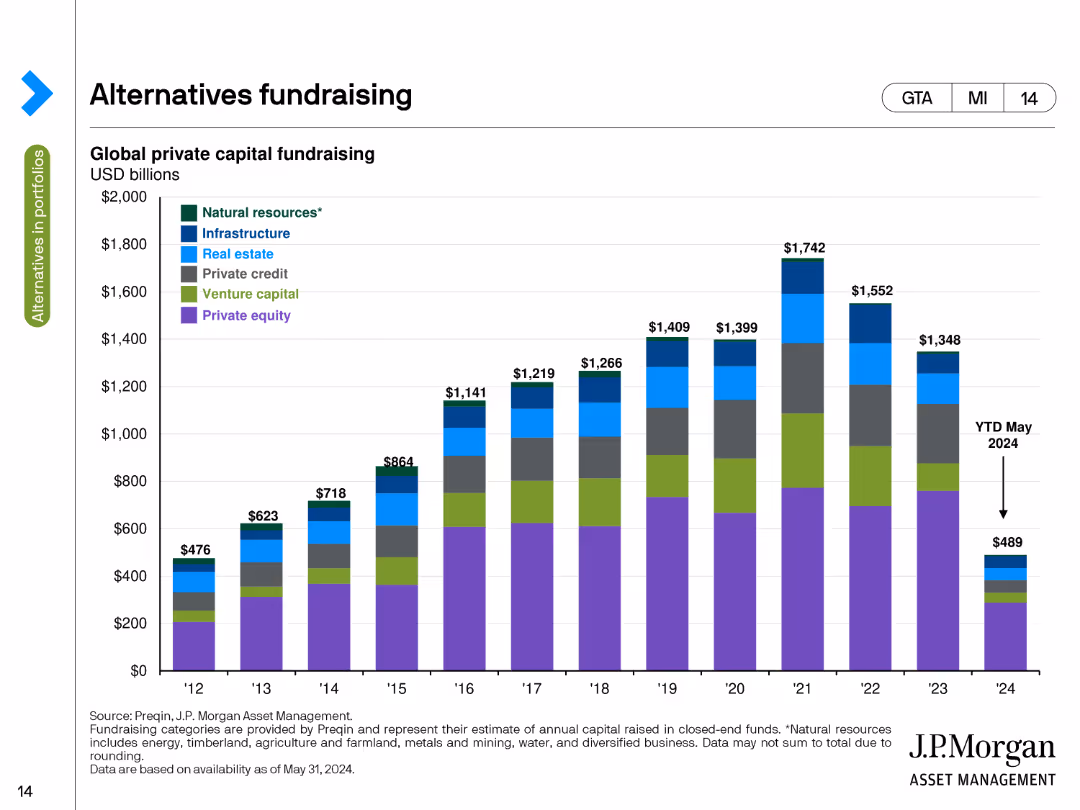
This slide contains a stacked column chart illustrating global private capital fundraising amounts in USD billions from 2012 to 2024. Different colors represent categories like natural resources, infrastructure, and private equity.
Market Analysis and Trends
Financial Services
The slide tracks global private capital fundraising by asset class over time, highlighting the amounts raised annually from 2012 to 2024, with a breakdown by categories such as natural resources, infrastructure, and private equity.
Fundraising, Private Capital, Asset Classes, USD Billions, Trends
false
Market Analysis and Trends
Financial Services financial-services
Single Chart
JP Morgan
View slide
The slide displays a stacked bar chart titled "Global private capital raised" with segments for different types of funds from 2003 to 2022. A decrease is highlighted in 2022, emphasized with "$1.3T".
Investment Analysis
Financial Services
Focuses on the challenges of fundraising in the private equity space, showing a year-on-year comparison of capital raised, which is essential for strategic planning and investment forecasting.
Fundraising, Private Equity, Capital Raised, Strategic Planning, Investment Forecasting
false
Investment Analysis
Financial Services financial-services
Single Chart
Bain
View slide
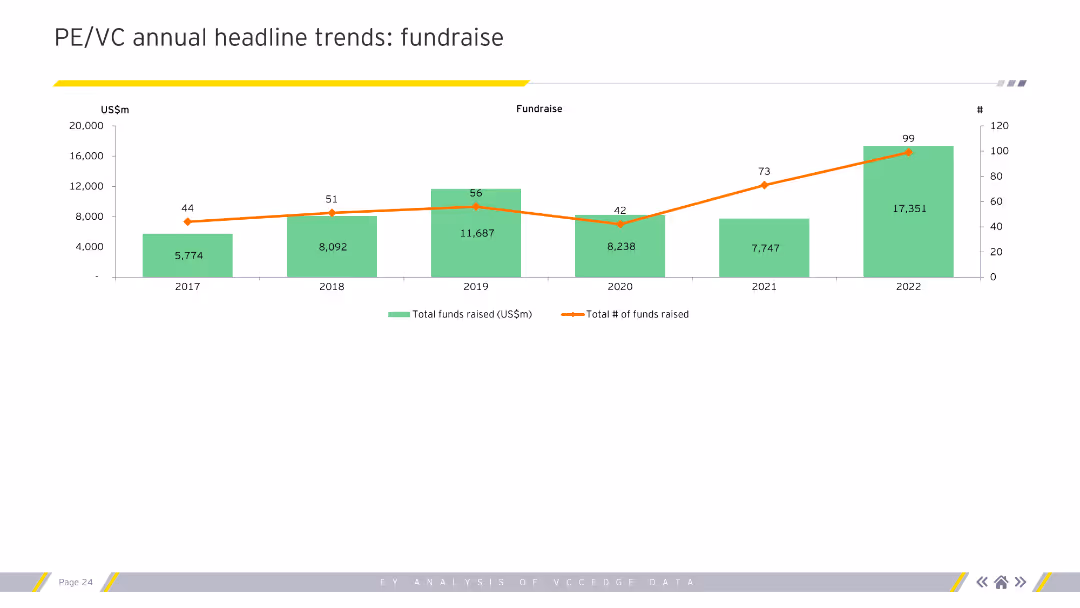
The slide features a column chart with a line graph overlay. The green columns represent the total funds raised (US$m), and the orange line represents the total number of funds raised.
Market Analysis and Trends
Financial Services
This slide shows the annual fundraising trends in private equity and venture capital from 2017 to 2022, indicating growth in total funds raised and number of funds over the years.
Fundraising, trends, PE/VC, funds raised, annual
false
Market Analysis and Trends
Financial Services financial-services
Single Chart
EY
View slide
It showcases a combination of column charts, star ratings, and graphical icons, using a color palette of blues, grays, and oranges. Each section provides data points and rankings.
Product and Service Analysis
Financial Services
Demonstrating asset management across various funds and strategies, this slide offers a comprehensive view on fund performance, AUM, and ranking, highlighting the franchise's cross-asset income strength.
Funds, Asset Management, Performance, AUM, Ranking, Franchise, Cross-Asset, Income Strategy, Infrastructure
false
Product and Service Analysis
Financial Services financial-services
Multiple Chart
JP Morgan
View slide
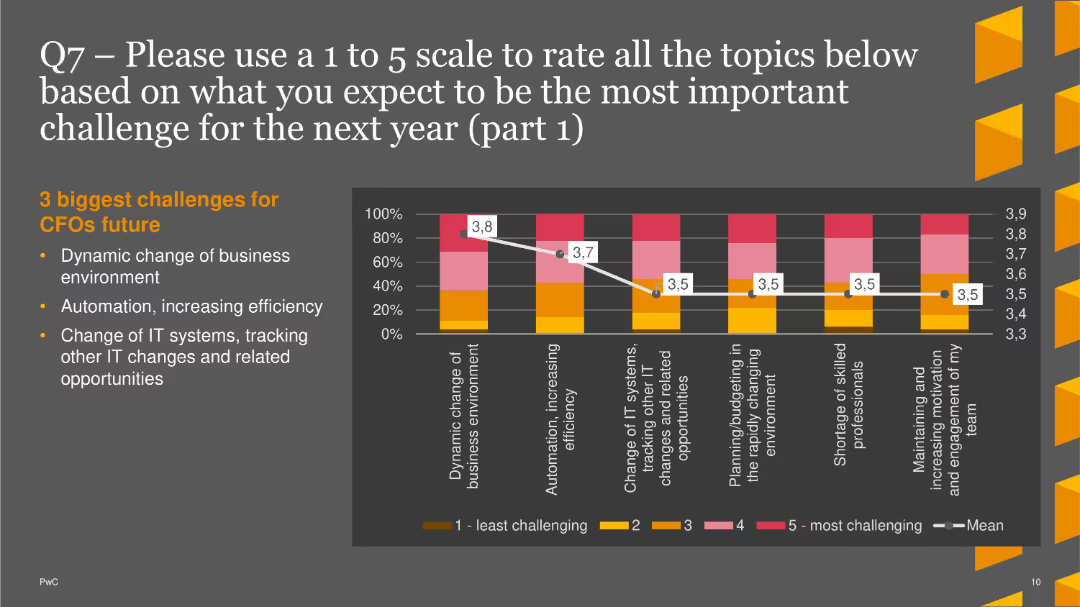
The slide includes a column chart showing anticipated challenges for CFOs, focusing on business environment changes and automation.
Market Analysis and Trends
Financial Services
This slide presents the top three expected challenges for CFOs in the coming year: dynamic business changes, automation, and IT system changes.
Future Challenges, CFOs, Column Chart, PwC, Survey, 2022, Automation
false
Market Analysis and Trends
Financial Services financial-services
Mixed Chart
PwC/Strategy&
View slide
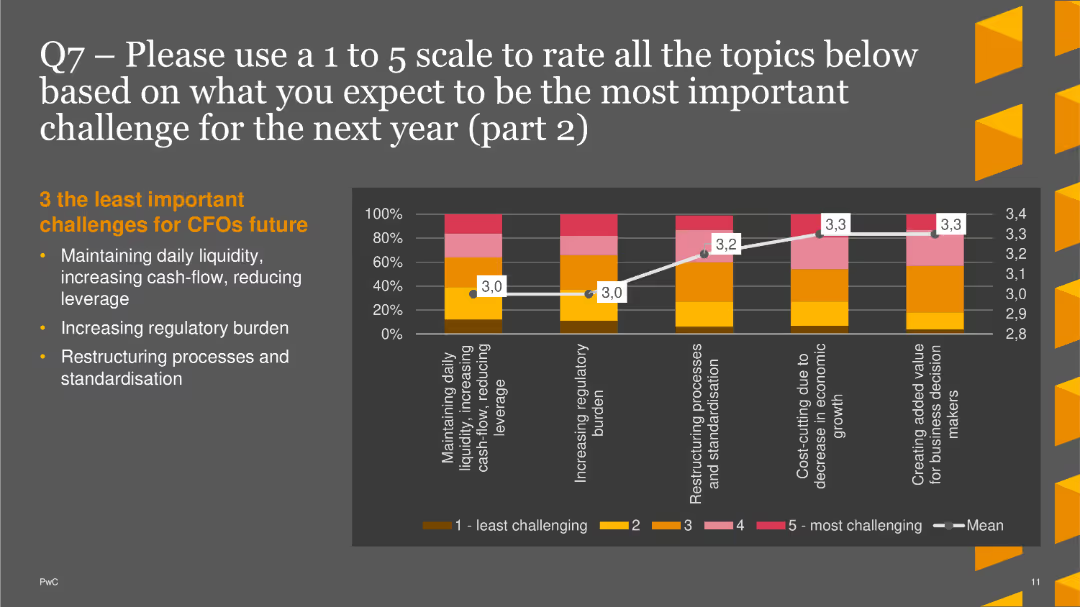
The slide features a column chart showing less significant expected challenges, including liquidity management and regulatory burden.
Market Analysis and Trends
Financial Services
This slide highlights the least important expected challenges for CFOs in the next year: daily liquidity, regulatory burden, and restructuring processes.
Future Challenges, CFOs, Column Chart, PwC, Survey, 2022, Regulatory Burden
false
Market Analysis and Trends
Financial Services financial-services
Mixed Chart
PwC/Strategy&
View slide
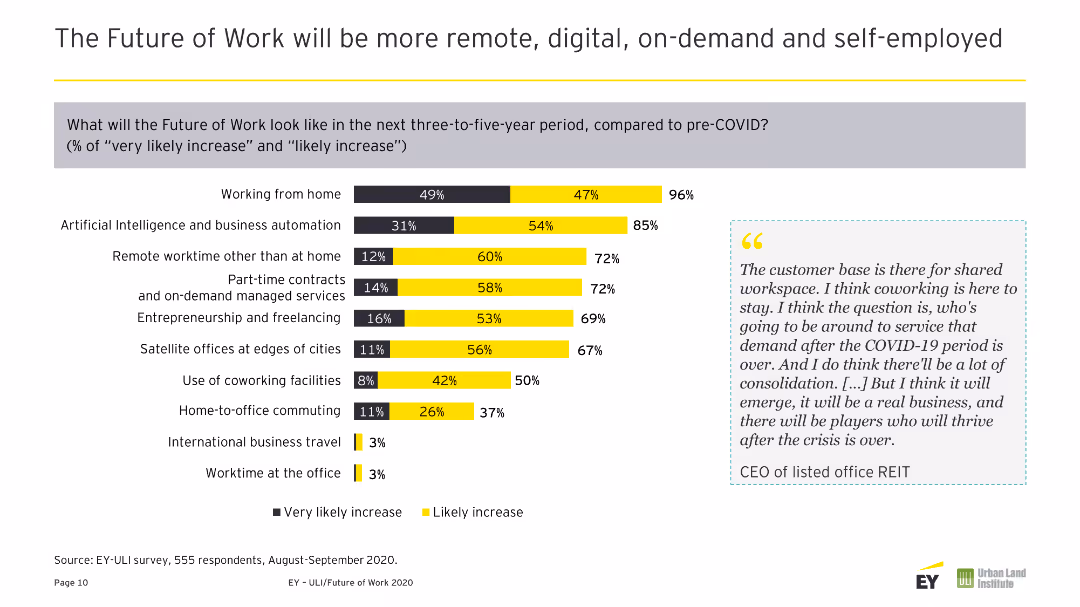
A column chart showing the likely increase in various work trends post-COVID-19, such as remote working, AI, and business automation.
Market Analysis and Trends
Technology & Software
The slide discusses anticipated work trends over the next three to five years, including remote work, AI, and increased reliance on digital tools and on-demand services.
Future Trends, Remote Work, AI, Digital Tools, On-Demand Services
false
Market Analysis and Trends
Technology & Software technology-and-software
Mixed Chart
EY
View slide
A unique spherical image of a cityscape with the title 'Future of Work' atop a stark white background. The slide's visual draws attention with its intricate design and spacing, intended to intrigue and introduce.
Industry Overview
Professional Services
This creative title slide introduces a section or presentation focused on the Future of Work, setting the stage for a discourse on evolving work patterns influenced by technology and globalization. Its eye-catching visual metaphor suggests a world reoriented by new work paradigms, appropriate for thought leadership conferences or strategy sessions.
Future of Work, Introduction, Technology, Globalization, Work Patterns, Strategy, Thought Leadership
false
Industry Overview
Professional Services professional-services
Title
Deloitte
View slide
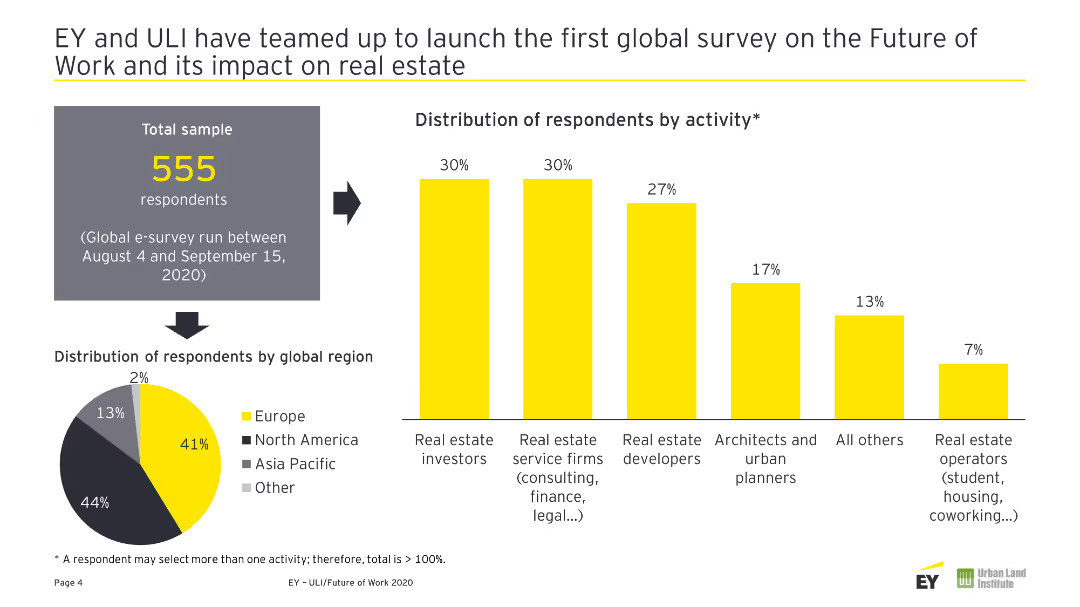
A pie chart showing the global distribution of respondents and a column chart showing respondents' activities.
Market Analysis and Trends
Real Estate & Construction
This slide presents the global distribution and activity breakdown of respondents in a survey on the future of work and its impact on real estate.
Future of Work, Real Estate, Survey, Respondents, Global Distribution
false
Market Analysis and Trends
Real Estate & Construction real-estate-and-construction
Multiple Chart
EY
View slide
A split design with infographics and key statistics.
Technology and Digital Transformation
Professional Services
The slide presents a comparative analysis of how technology is changing work practices and the implications for organizations.
Future of Work, Technology, Organizations, Change, Comparative Analysis
false
Technology and Digital Transformation
Professional Services professional-services
Framework
Deloitte
View slide
The slide uses a dark background with a yellow text box for the quote. Below, there is a question and four circular charts with percentages reflecting future expectations.
Market Analysis and Trends
Healthcare & Pharmaceuticals
The slide provides insights into Australian consumers' beliefs about the future of technology in healthcare, including AI, virtual presence, and digital monitoring.
Future of healthcare, technology, AI, virtual presence, Australia
false
Market Analysis and Trends
Healthcare & Pharmaceuticals healthcare-and-pharmaceuticals
Mixed Chart
EY
View slide
The slide uses a dark background with a yellow text box for the quote. Below, there is a question and four circular charts with percentages reflecting future expectations.
Market Analysis and Trends
Healthcare & Pharmaceuticals
The slide provides insights into Canadian consumers' beliefs about the future of technology in healthcare, including AI, virtual presence, and digital monitoring.
Future of healthcare, technology, AI, virtual presence, Canada
false
Market Analysis and Trends
Healthcare & Pharmaceuticals healthcare-and-pharmaceuticals
Mixed Chart
EY
View slide
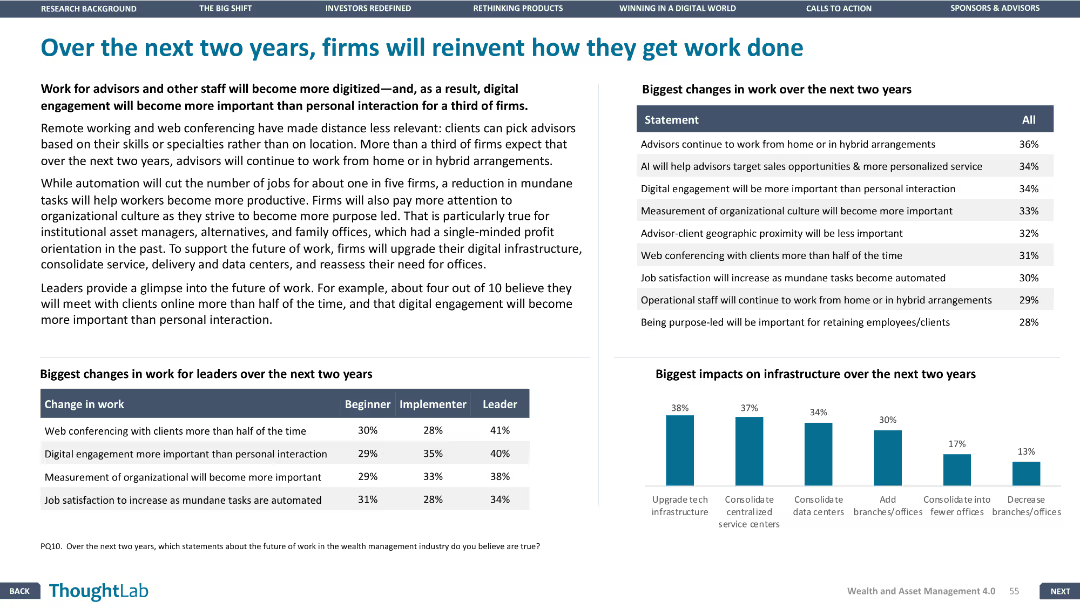
The slide features a column chart and a table, with a layout that presents future changes in work and infrastructure impacts clearly.
Strategic Planning
Financial Services
The slide discusses how firms plan to reinvent their work processes over the next two years, focusing on changes in work for leaders, the biggest impacts on infrastructure, and the adoption of digital engagement.
Future of work, digital engagement, infrastructure impacts, work changes
false
Strategic Planning
Financial Services financial-services
Mixed Chart
Deloitte
Previous
Loading...
Hold On!
We are searching in our database
If nothing, comes up, please try different filters!
Column Chart
Heatmap
Chevron
Org Chart
Infographic
Callouts
Timeline
List
Graphic
Picture
Process Flow
Diagram
Paragraph
Map
Table
Framework
Subtitle
Takeaway Box
Icon
Other Chart
Radar Chart
Waterfall Chart
Mekko Chart
Pie Chart
Scatter Plot
Line Chart
Bar chart
Bullet points
Create a FREE account to continue browsing
Receive Instant Access to 1,000+ slides from companies like McKinsey, Google, and Goldman Sachs
First Name
Last Name
Email
Password
I agree to all
Terms & Privacy Policy
Thank you! Your submission has been received!
Oops! Something went wrong while submitting the form.
Have an account?
Sign in
Upgrade to PRO to Save slides
Advanced Search and Filters
Access to 15,000+ slides
Access to Category Pages
Save/Bookmark Slides
PowerPoint Template Library
Pick a Plan
MONTHLY
$12/month
Billed every month, Cancel anytime.
YEARLY
$9/year
Billed $108 annually, Cancel anytime.
Checkout for $12/month
Checkout for $108/yr
Secured by Stripe | AES-256 bit encryption