My Account
My Slides
Search by Category
Templates
View All Templates
Download Template Slides
Leave Feedback
Login
Logout
Get Started
Browse all Slides
Browse all Slides
Create a FREE Account
Instant access to 1,000+ real slides from top companies like McKinsey, BCG, Goldman Sachs, Google and many more!
First Name
Last Name
Email
Password
I agree to all
Terms & Privacy Policy
Thank you! Your submission has been received!
Oops! Something went wrong while submitting the form.
Have an account?
Sign in
Spark Your Next Big Idea with New Presentation Templates
VIEW ALL Templates
Welcome,
Welcome
PRO
Show Featured Only
Checkbox 8
Companies
Mckinsey
Bain
BCG
EY
Deloitte
Accenture
PwC/Strategy&
JP Morgan
Goldman Sachs
Morgan Stanley
Citigroup
Deutsche Bank
Barclays
LEK
KPMG
Kearney
Oliver Wyman
Booz Allen Hamilton
Gartner
IPSOS
Nielsen
Slide type
Text Only
Linear Flow
Vertical Flow
Single Chart
Header Horizontal
Mixed Chart
Header Vertical
Pillar
Multiple Chart
Graphic
Agenda
Title
Table
Framework
Industry
Technology & Software
Artificial Intelligence
Financial Services
Retail & E-commerce
Consumer Goods
Industrial & Manufacturing
Transportation & Logistics
Telecommunications
Real Estate & Construction
Hospitality & Tourism
Professional Services
Education & Training
Media & Entertainment
Agriculture & Food Production
Healthcare & Pharmaceuticals
Environmental Services & Sustainability
Government & Public Sector
Use Case
Mergers and Acquisitions
Performance Metrics and KPIs
Client Case Studies
Competitive Landscape
Corporate Finance and Valuation
Product and Service Analysis
Customer and Market Segmentation
Organizational Structure and Change
Industry Overview
Regulatory and Compliance
Risk Assessment and Management
Investment Analysis
Organizational Structure and Change
Human Resources and Talent Management
Financial Performance
Market Analysis and Trends
Sales and Business Development
Human Resources and Talent Management
Clear all
Thank you! Your submission has been received!
Oops! Something went wrong while submitting the form.
Tag
View slide
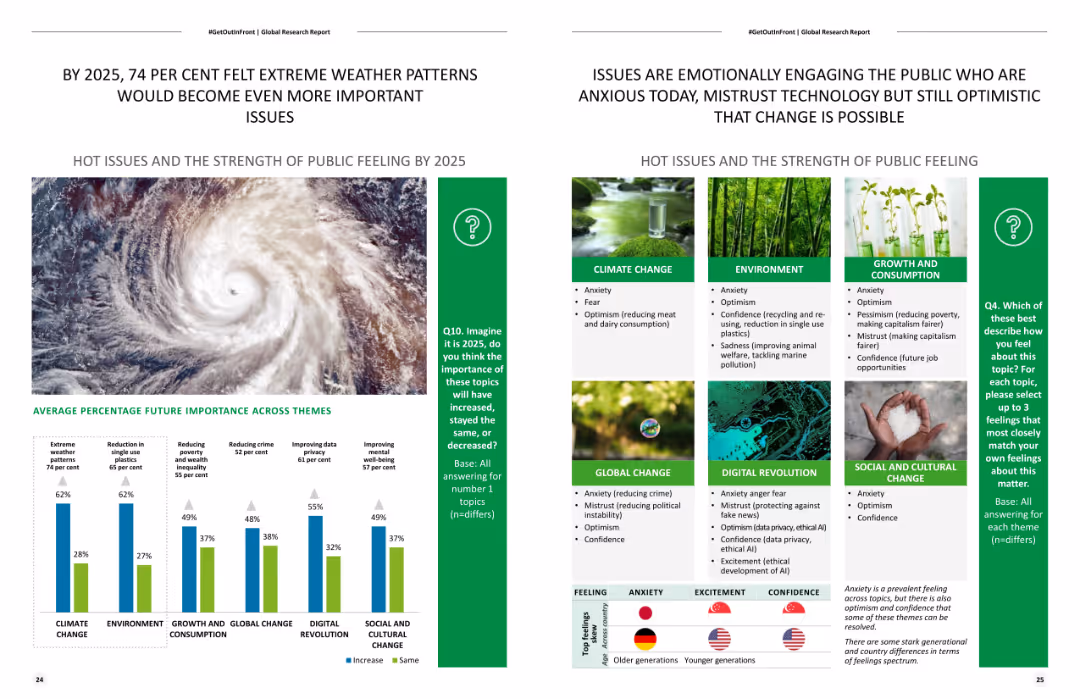
Features a column chart and a list of themes with percentages showing expected future importance of various issues. It also includes a large image of a hurricane.
Strategic Planning
Environmental Services & Sustainability
Predicts the future importance of various global issues by 2025, with a focus on extreme weather patterns and public sentiment analysis on environmental changes.
Future trends, extreme weather, environmental impact, strategic planning, public sentiment
false
Strategic Planning
Environmental Services & Sustainability environmental-services-and-sustainability
Mixed Chart
Deloitte
View slide
Engaging workplace setting with screens displaying virtual participants, yellow accents.
Strategic Planning
Technology & Software
The slide serves as a title slide for a section on the future of the workplace, indicating a focus on the evolution of work environments influenced by technology. It could be a conversation starter for discussions on hybrid work models, remote work policies, and technological integration in the professional services and tech industries.
Future, Workplace, Index, Technology, Hybrid Model, Remote Work, Professional Services, Evolution, Policies, Integration
false
Strategic Planning
Technology & Software technology-and-software
Title
EY
View slide
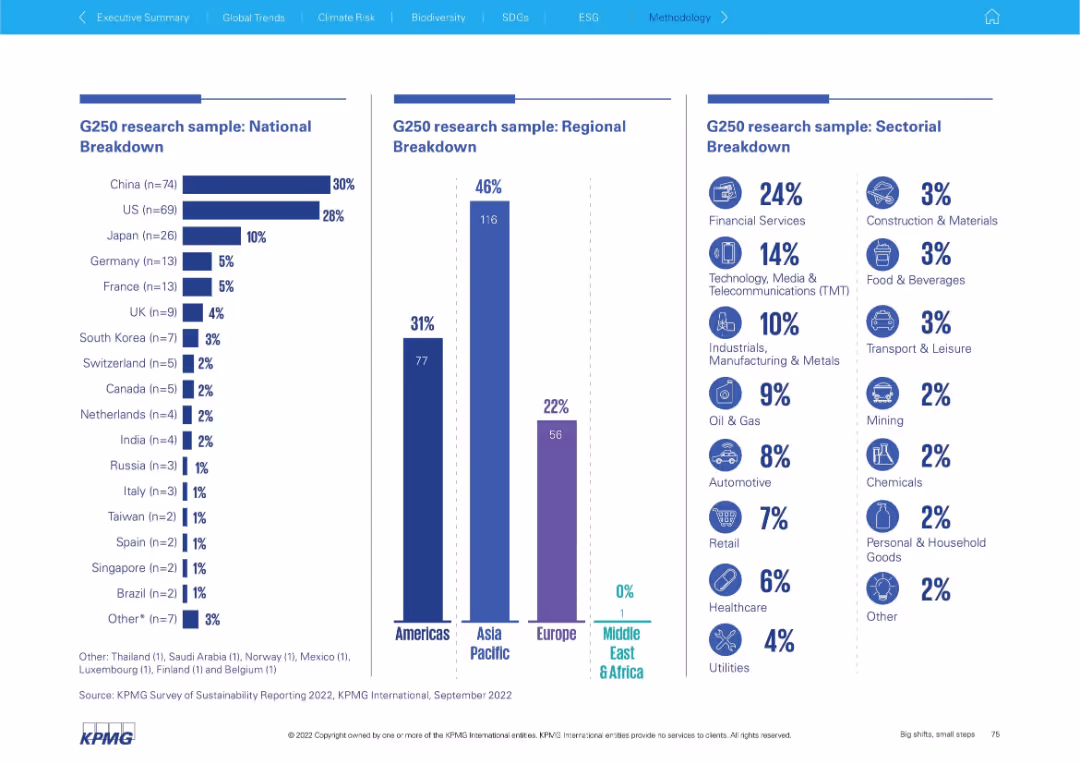
Three-column layout with vertical bar charts and icons for national, regional, and sectoral breakdowns
Market Analysis and Trends
Professional Services
Displays the geographic and sectoral breakdown of the G250 sample for sustainability reporting. Includes national (by country), regional (Americas, Asia Pacific, Europe, MEA), and sectoral (by industry) proportions.
G250, national breakdown, regional breakdown, sector analysis, bar chart, KPMG, sustainability, survey, sample demographics, industry sectors
false
Market Analysis and Trends
Professional Services professional-services
Multiple Chart
KPMG
View slide
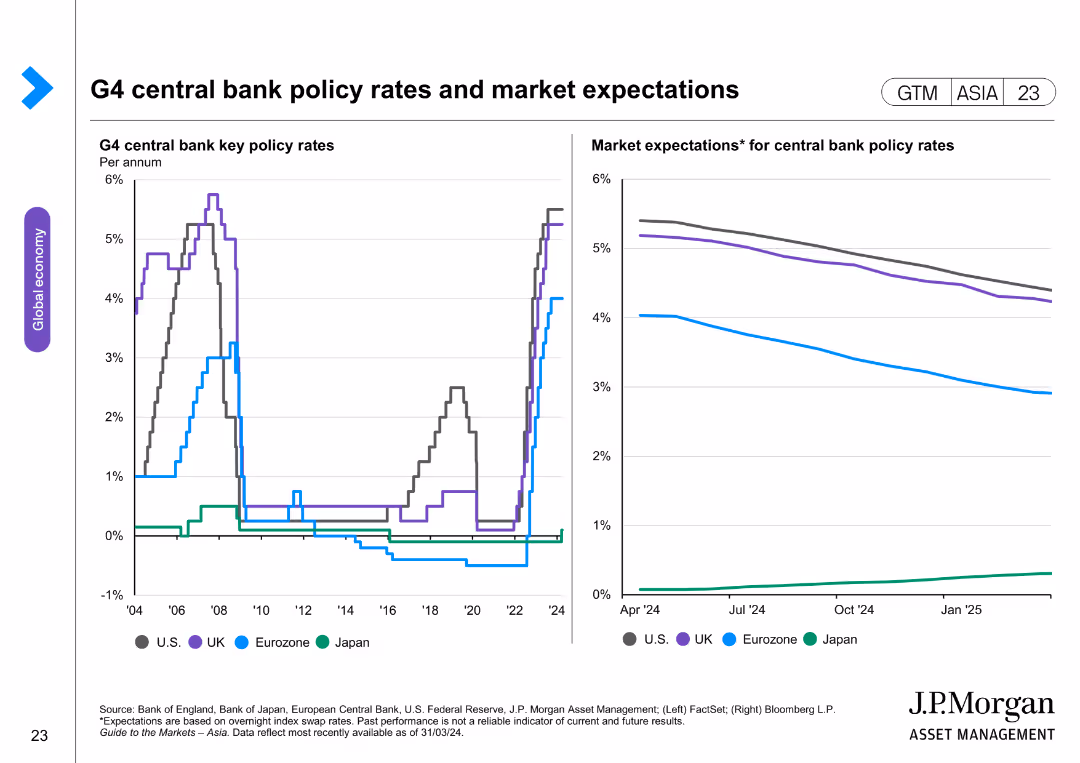
The slide features two line charts. The left chart displays key policy rates of G4 central banks (US, UK, Eurozone, Japan) over time. The right chart shows market expectations for these policy rates, with forecasted trends.
Market Analysis and Trends
Financial Services
The slide provides an analysis of G4 central bank policy rates and market expectations, highlighting monetary policy trends. It is used for financial market analysis and strategic planning.
G4 central banks, policy rates, market expectations, US, UK, Eurozone, Japan, monetary trends, financial analysis
false
Market Analysis and Trends
Financial Services financial-services
Multiple Chart
JP Morgan
View slide
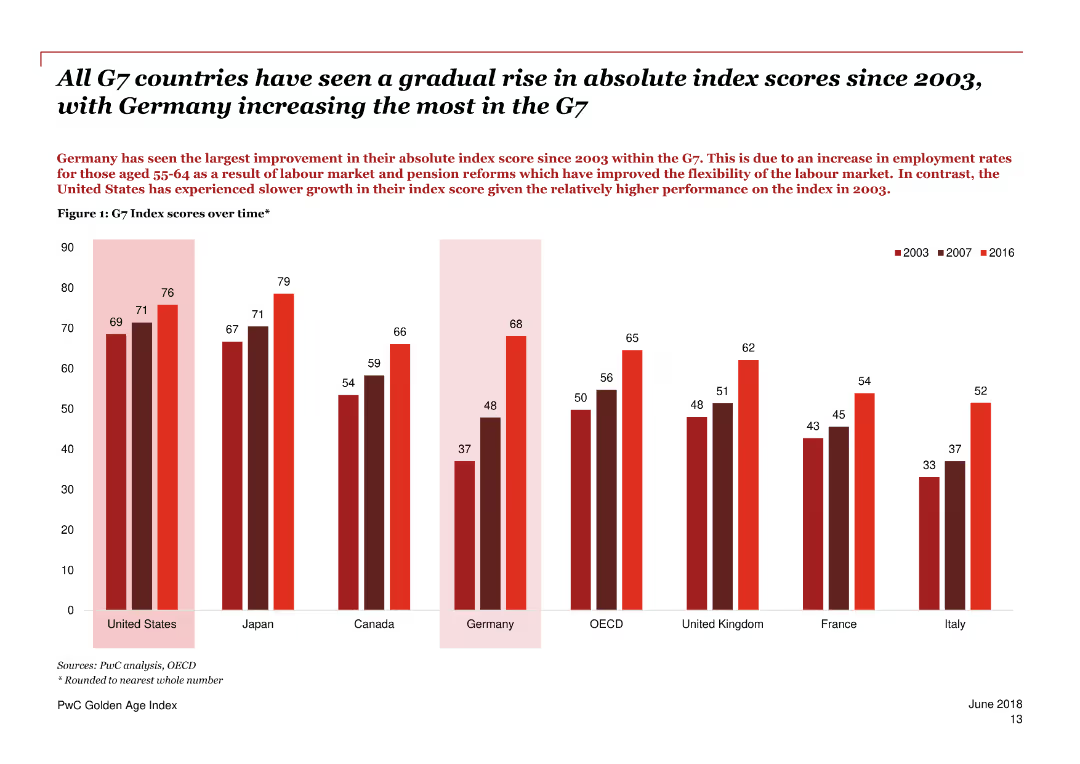
A series of column charts showing the G7 Index scores over time, comparing different countries.
Market Analysis and Trends
Government & Public Sector
Highlights the gradual rise in absolute index scores for G7 countries since 2003, with Germany showing the largest improvement.
G7 Index, scores, Germany, improvement, comparison, countries, trends, employment, older workers, economic performance
false
Market Analysis and Trends
Government & Public Sector government-and-public-sector
Single Chart
PwC/Strategy&
View slide
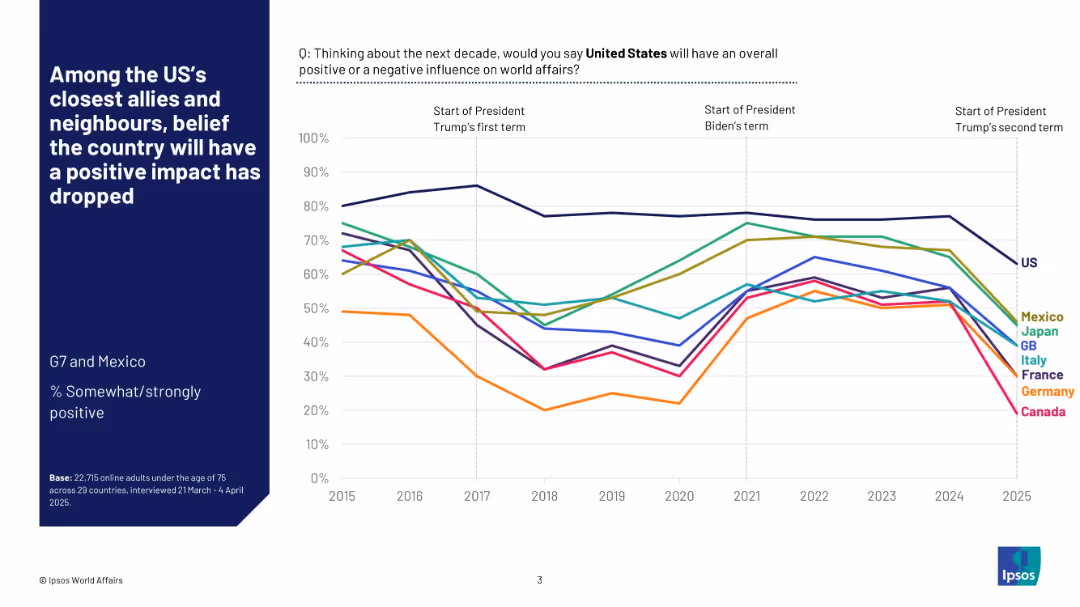
Line graph showing longitudinal data (2015–2025) across several countries regarding their views on U.S. influence.
Market Analysis and Trends
Government & Public Sector
This slide shows how perceptions of U.S. influence have changed over a decade in G7 countries and Mexico. It reveals a declining trend in positive sentiment, with major drops around transitions between U.S. presidential terms.
G7, Mexico, U.S. foreign policy, sentiment trend, line chart, global relations, public opinion, international trust, Ipsos, time series
false
Market Analysis and Trends
Government & Public Sector government-and-public-sector
Mixed Chart
IPSOS
View slide
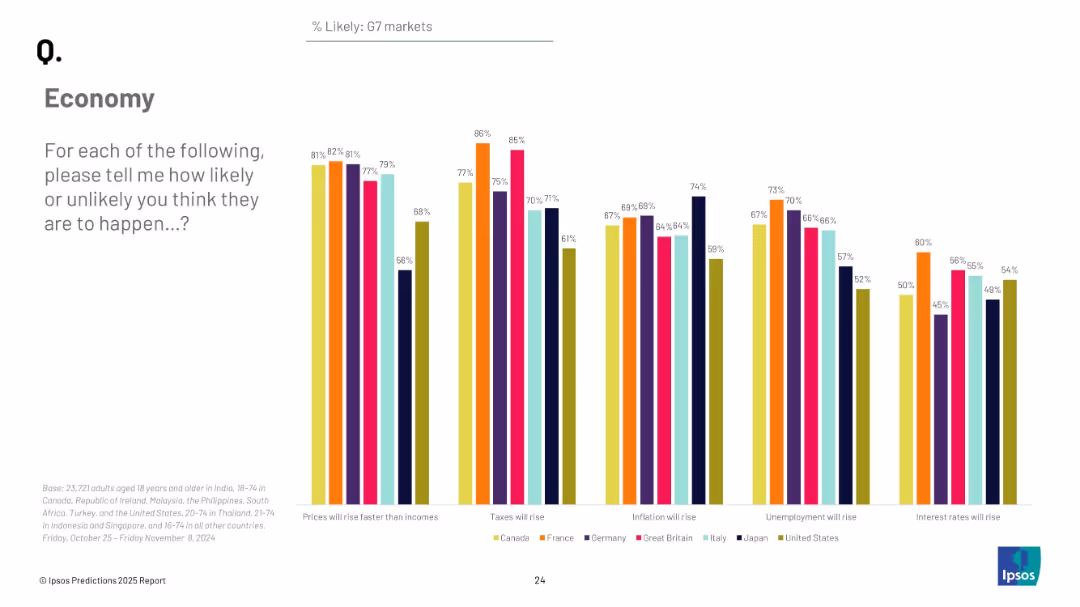
Vertical grouped bar chart for G7 countries showing likelihood of five key economic developments; color-coded by country.
Market Analysis and Trends
Financial Services
The slide compares the economic sentiment of G7 nations on five financial outcomes such as inflation, taxes, and unemployment. It highlights significant cross-country variation in perceptions.
G7, economic comparison, inflation, unemployment, tax outlook, interest rates, Ipsos, 2025
false
Market Analysis and Trends
Financial Services financial-services
Mixed Chart
IPSOS
View slide
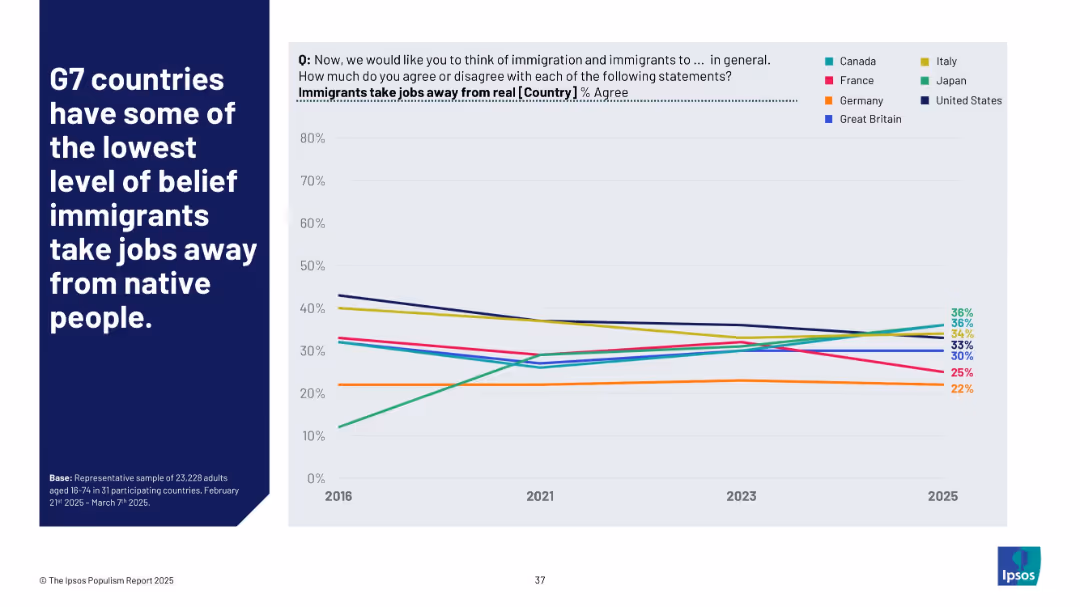
Line chart showing agreement % from 2016 to 2025 for G7 countries; legend on right; bold white text on blue background
Market Analysis and Trends
Government & Public Sector
This slide compares belief trends in G7 nations regarding whether immigrants take jobs from natives. The data suggests a general downward trend in agreement across most countries, except for Japan, where belief in job displacement by immigrants has risen significantly.
G7, immigration, job loss belief, trend analysis, comparative politics, Ipsos, public sentiment, international comparison
false
Market Analysis and Trends
Government & Public Sector government-and-public-sector
Mixed Chart
IPSOS
View slide
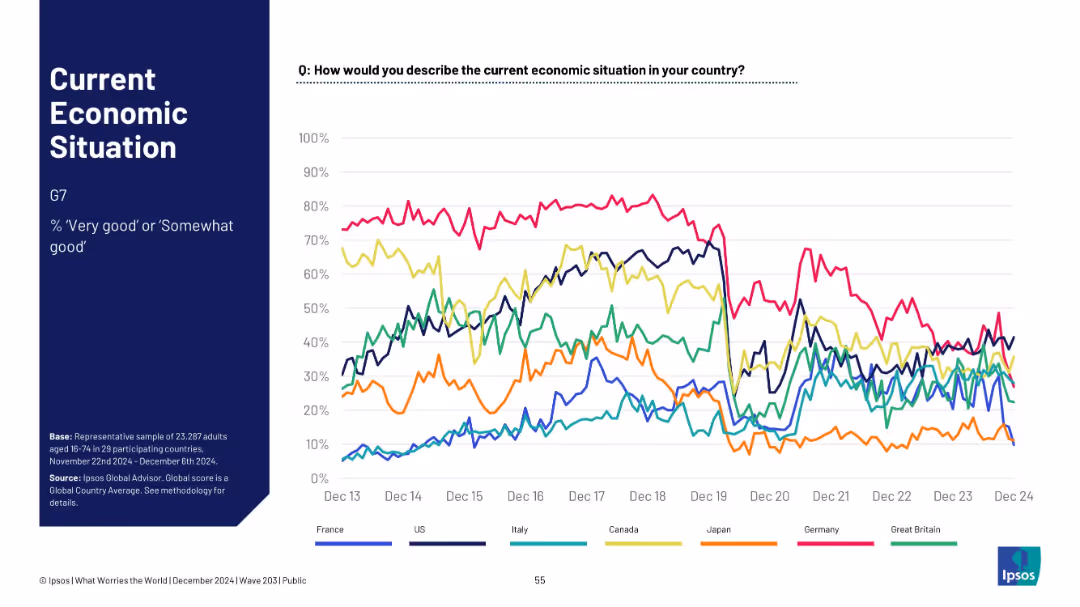
Multi-line trend chart showing % “very good” or “somewhat good” for G7 countries over time; clean line graph.
Market Analysis and Trends
Financial Services
This line chart tracks the economic sentiment over time for G7 nations from Dec 2013 to Dec 2024, showing trends in perceived economic positivity.
G7, trend lines, economic sentiment, long-term data, country comparison, Ipsos, 2024, line graph, public perception, macro trends
false
Market Analysis and Trends
Financial Services financial-services
Mixed Chart
IPSOS
View slide
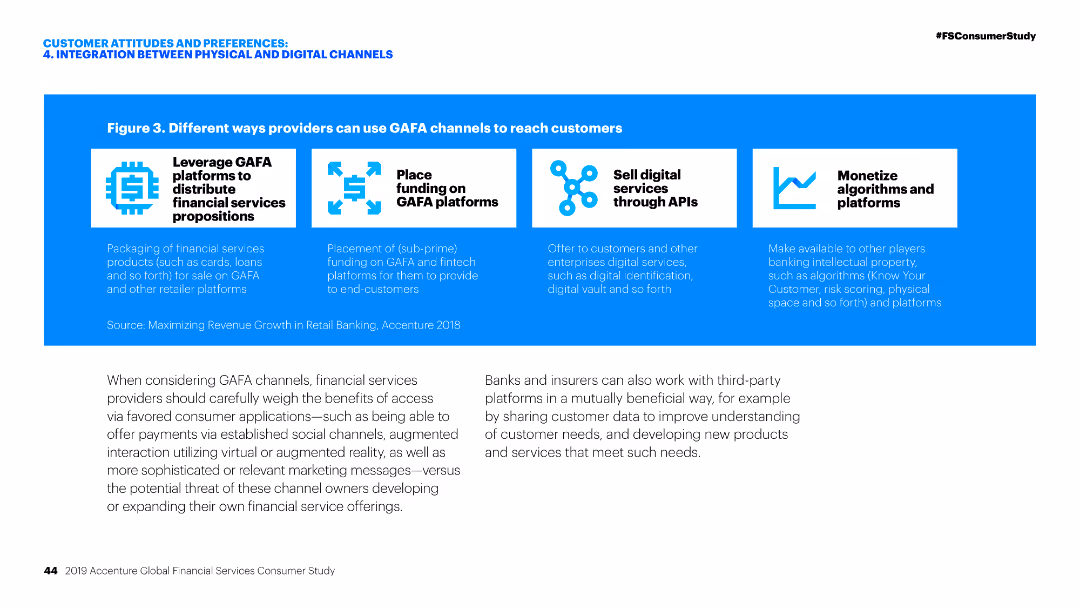
Diagram illustrating different ways financial service providers can leverage GAFA platforms for distributing services, funding, selling services, and monetizing algorithms.
Technology and Digital Transformation
Financial Services
The slide describes various strategies for financial service providers to use GAFA channels, focusing on distribution, funding, digital services, and monetization through algorithms.
GAFA channels, Financial services, Digital transformation, Distribution, Monetization
false
Technology and Digital Transformation
Financial Services financial-services
Pillar
Accenture
View slide
A visually balanced slide with a two-part structure; one side discusses the strategic priorities for GBM, while the other shows a column chart illustrating the growth in financing revenues from equities and FICC from 2013 to 2022. The data is easy to interpret with clear labeling and contrasting colors.
Sales and Business Development
Financial Services
Reviews growth in financing within GBM and how it aligns with strategic priorities, making it pertinent for financial strategy reviews and performance analysis.
GBM, financing growth, strategic priorities
false
Sales and Business Development
Financial Services financial-services
Mixed Chart
Goldman Sachs
View slide
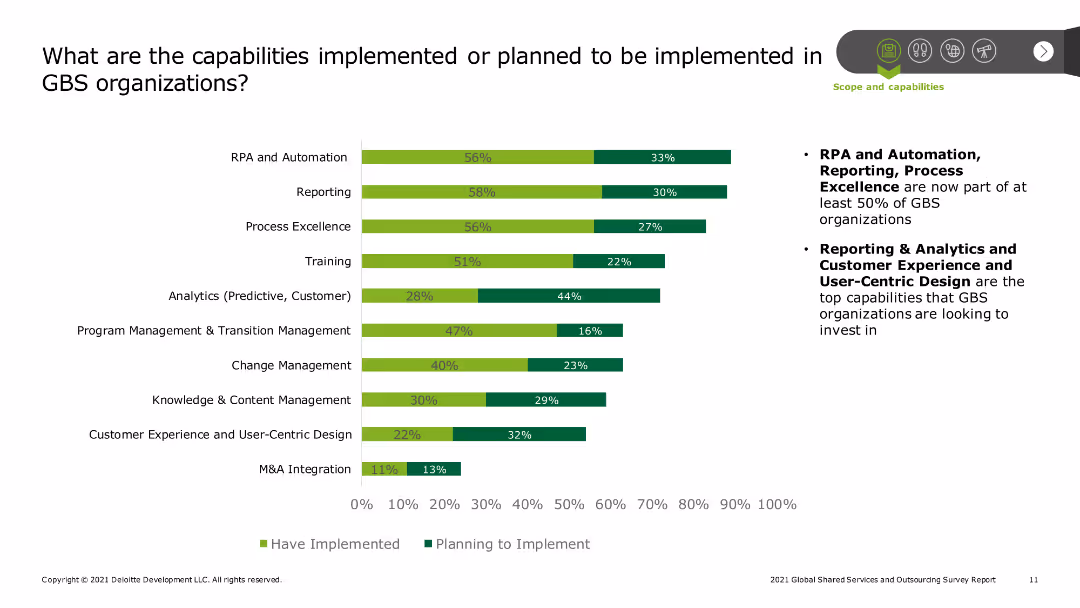
The slide contains a bar chart showing the implementation status of various capabilities in GBS organizations, such as RPA and automation, reporting, process excellence, training, analytics, and customer experience design, with percentages for implemented and planned capabilities.
Technology and Digital Transformation
Professional Services
The slide outlines the current and planned capabilities within Global Business Services (GBS) organizations. It highlights key areas of focus like RPA, reporting, process excellence, and customer experience design, showing the extent of implementation and future plans.
GBS capabilities, implementation status, RPA, automation, reporting, process excellence, training, analytics, customer experience, digital transformation
false
Technology and Digital Transformation
Professional Services professional-services
Mixed Chart
Deloitte
View slide
This slide contains pie charts and percentage data, alongside bulleted text describing governance models in shared services. Layout includes a balance of textual information and graphical representation.
Operational Efficiency
Professional Services
Discusses the adoption and considerations of the GBS model among organizations, highlighting trends in governance and the decision-making process regarding shared services models. It is useful for analyzing organizational strategies in governance.
GBS model, shared services, organizational strategy, governance trends, adoption rate
false
Operational Efficiency
Professional Services professional-services
Multiple Chart
Deloitte
View slide
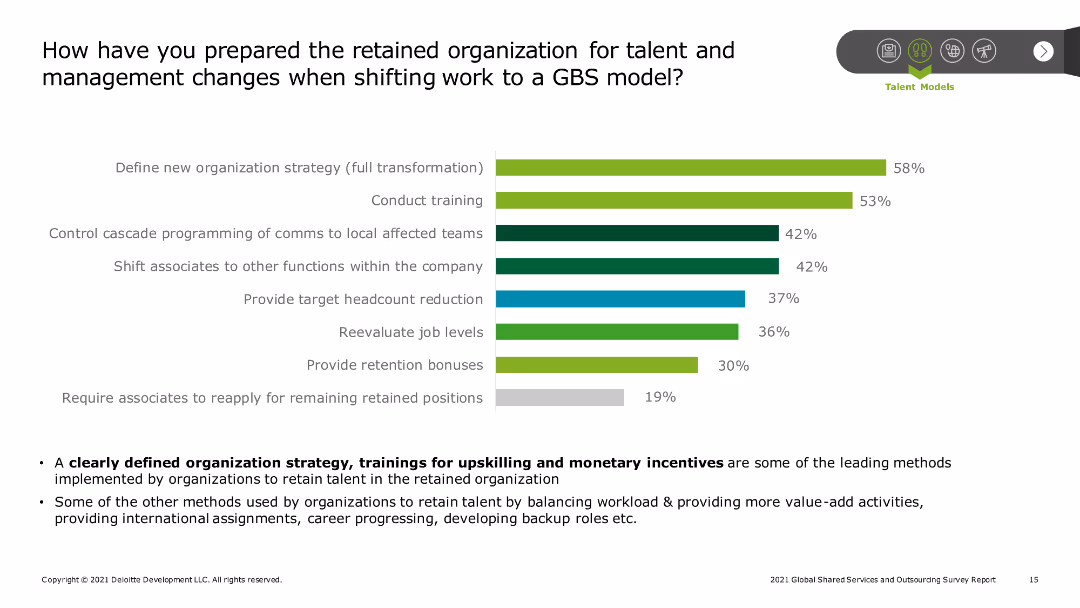
The slide features a column chart showing the preparation methods for retained organizations during a shift to a GBS model. Additional text outlines key strategies and percentages of adoption.
Human Resources and Talent Management
Professional Services
The slide outlines methods organizations use to prepare for talent and management changes when shifting work to a GBS model, including new strategies, training, headcount reduction, and job level reevaluation.
GBS model, talent management, training, strategy, headcount reduction
false
Human Resources and Talent Management
Professional Services professional-services
Mixed Chart
Deloitte
View slide
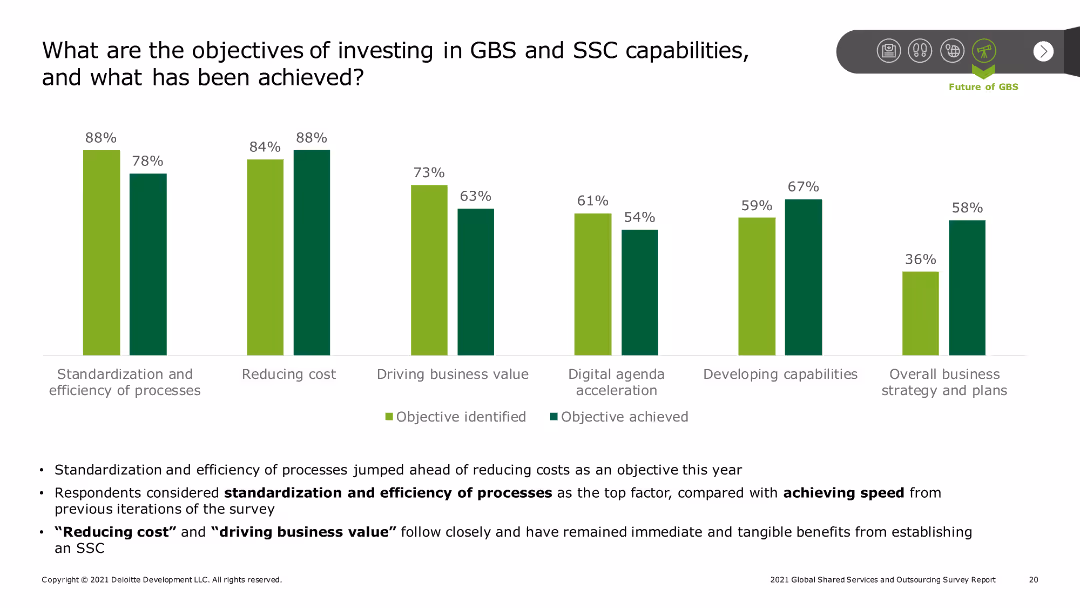
The slide includes a series of column charts displaying objectives and achievements in GBS and SSC investments, such as standardization, cost reduction, and driving business value. Additional text highlights key takeaways.
Strategic Planning
Professional Services
The slide reviews the objectives of investing in GBS and SSC capabilities, such as standardization and efficiency, cost reduction, and driving business value, along with the extent to which these objectives have been achieved.
GBS, SSC, investment objectives, cost reduction, business value
false
Strategic Planning
Professional Services professional-services
Mixed Chart
Deloitte
View slide
Includes a pie chart and a global map indicating preferred locations for shared services centers.
Strategic Planning
Professional Services
Analyzes trends in global business services, focusing on strategic realignment and preferred locations for service centers.
GBS, SSC, trends, bar chart, strategic realignment
false
Strategic Planning
Professional Services professional-services
Mixed Chart
Deloitte
View slide
Presents bar charts showing the percentage of GBS organizations implementing various capabilities like Process Excellence and Intelligent Automation.
Strategic Planning
Professional Services
Discusses current and future strategic capabilities within GBS organizations, emphasizing automation and process optimization.
GBS, capabilities, process excellence, automation, strategic planning
false
Strategic Planning
Professional Services professional-services
Mixed Chart
Deloitte
View slide
Features stacked bar charts comparing centralization of decision support areas between general accounting and strategic support.
Financial Performance
Professional Services
Highlights trends in GBS capability centralization and its impact on decision support effectiveness.
GBS, centralization, capabilities, decision support, trends
false
Financial Performance
Professional Services professional-services
Mixed Chart
Deloitte
View slide
Discusses challenges in implementing GBS models with bar graphs (Figure 8) showing challenge ratings.
Strategic Planning
Professional Services
Focuses on overcoming cultural, technological, and strategic challenges in GBS operations.
GBS, challenges, strategy, culture, technology
false
Strategic Planning
Professional Services professional-services
Mixed Chart
Deloitte
View slide
Features three pie charts illustrating different metrics for chargebacks in GBS across stages: overall, startup, and mature.
Financial Performance
Professional Services
Discusses how chargeback metrics within global business services (GBS) vary across different stages of business maturity, focusing on various operational and financial metrics.
GBS, chargebacks, metrics, stages
false
Financial Performance
Professional Services professional-services
Multiple Chart
Deloitte
View slide
Utilizes pie charts and bar charts to assess challenges in customer interactions and current strategies employed by GBS organizations to enhance customer experience.
Customer and Market Segmentation
Professional Services
Analyzes challenges and steps taken by GBS organizations to improve customer service and engagement.
GBS, customer experience, service improvement, engagement strategies, challenges
false
Customer and Market Segmentation
Professional Services professional-services
Multiple Chart
Deloitte
View slide
This slide includes bar charts and lists ranking key digital enablers and their projected focus areas in the next few years, such as automation and ERP systems.
Technology and Digital Transformation
Professional Services
Explores the core technological and strategic enablers used by GBS organizations to drive efficiency and innovation.
GBS, digital enablers, automation, ERP, technology adoption
false
Technology and Digital Transformation
Professional Services professional-services
Mixed Chart
Deloitte
View slide
Text-heavy with a column chart (Figure 1) showing the percentage increase in GBS functions.
Operational Efficiency
Professional Services
Explains GBS expansion strategies and benefits, focusing on function and geographic diversification.
GBS, expansion, functions, geography, strategy
false
Operational Efficiency
Professional Services professional-services
Mixed Chart
Deloitte
View slide
Contains multiple horizontal bar charts showing the percentage of respondents engaging in various business functions like Finance, HR, IT, and more. There is also a comparative analysis of these functions over the years 2019, 2021, and 2023.
Market Analysis and Trends
Professional Services
Presents a breakdown of key functions within GBS organizations, tracking changes in function focus and importance over time.
GBS, functions, finance, HR, IT, trend analysis
false
Market Analysis and Trends
Professional Services professional-services
Mixed Chart
Deloitte
View slide
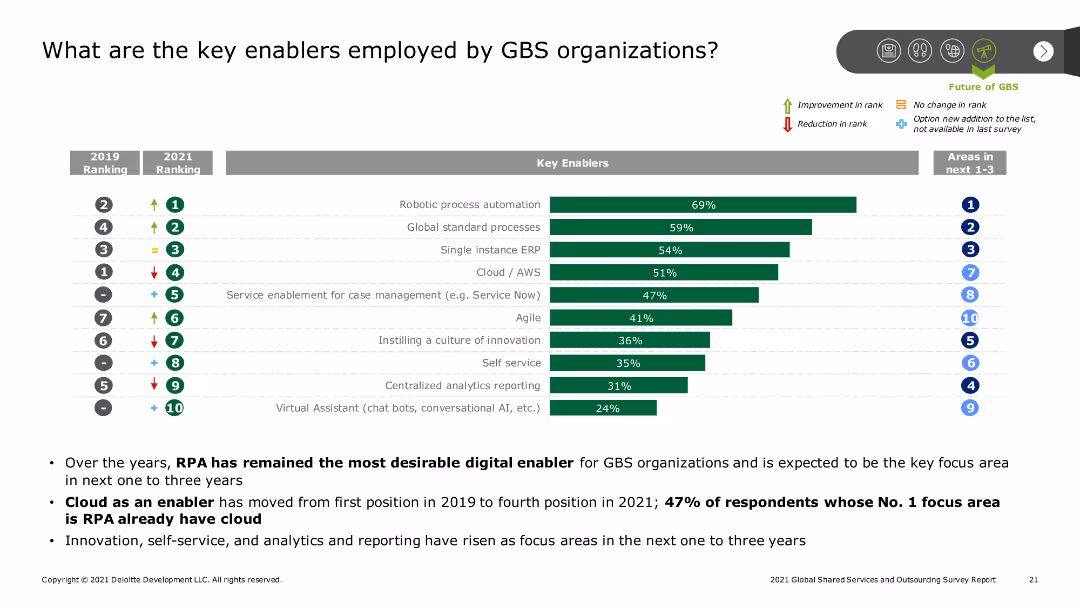
A bar chart ranks key enablers employed by GBS organizations, such as robotic process automation and cloud services, with indicators of rank changes from 2019 to 2021. Additional text provides context and key findings.
Technology and Digital Transformation
Professional Services
The slide identifies key enablers for GBS organizations, highlighting the importance of robotic process automation, cloud services, and global standard processes, along with changes in their ranking over time.
GBS, key enablers, RPA, cloud services, ranking changes
false
Technology and Digital Transformation
Professional Services professional-services
Mixed Chart
Deloitte
View slide
This slide contains multiple horizontal bar charts detailing factors in location selection for business services, with bars representing varying degrees of importance.
Market Analysis and Trends
Professional Services
The slide analyzes various factors such as labor quality and cost, which influence location decisions for global business services, highlighting priorities beyond just cost.
GBS, location, labor, cost, analysis
false
Market Analysis and Trends
Professional Services professional-services
Single Chart
Deloitte
View slide
Pie charts and a column chart illustrating the scope and reporting structure of shared services within organizations.
Operational Efficiency
Professional Services
Examines the maturity and scope of global business services, reporting structures, and the extent of service functions.
GBS, maturity, scope, pie chart, bar chart, reporting structure
false
Operational Efficiency
Professional Services professional-services
Multiple Chart
Deloitte
View slide
Text-heavy discussing geographical spread and operational models of GBS with a pie chart (Figure 7) showing operational models.
Strategic Planning
Professional Services
Analyzes the benefits and considerations of various GBS deployment models, such as hub-and-spoke.
GBS, models, hub-and-spoke, deployment, benefits
false
Strategic Planning
Professional Services professional-services
Mixed Chart
Deloitte
View slide
Utilizes a series of column charts to compare objectives identified in 2021 with those achieved by 2023 across various strategic areas like cost reduction and risk management.
Strategic Planning
Professional Services
Evaluates the success of GBS initiatives in achieving strategic objectives over time, highlighting areas of strength and opportunity.
GBS, objectives, strategic planning, cost reduction, risk management
false
Strategic Planning
Professional Services professional-services
Mixed Chart
Deloitte
View slide
Dense text layout discussing the potential of GBS to streamline operations and enhance performance.
Strategic Planning
Professional Services
Outlines approaches to optimize global shared services through outsourcing and centralization.
GBS, optimization, shared services, outsourcing, centralization
false
Strategic Planning
Professional Services professional-services
Mixed Chart
Deloitte
Previous
Loading...
Hold On!
We are searching in our database
If nothing, comes up, please try different filters!
Column Chart
Heatmap
Chevron
Org Chart
Infographic
Callouts
Timeline
List
Graphic
Picture
Process Flow
Diagram
Paragraph
Map
Table
Framework
Subtitle
Takeaway Box
Icon
Other Chart
Radar Chart
Waterfall Chart
Mekko Chart
Pie Chart
Scatter Plot
Line Chart
Bar chart
Bullet points
Create a FREE account to continue browsing
Receive Instant Access to 1,000+ slides from companies like McKinsey, Google, and Goldman Sachs
First Name
Last Name
Email
Password
I agree to all
Terms & Privacy Policy
Thank you! Your submission has been received!
Oops! Something went wrong while submitting the form.
Have an account?
Sign in
Upgrade to PRO to Save slides
Advanced Search and Filters
Access to 15,000+ slides
Access to Category Pages
Save/Bookmark Slides
PowerPoint Template Library
Pick a Plan
MONTHLY
$12/month
Billed every month, Cancel anytime.
YEARLY
$9/year
Billed $108 annually, Cancel anytime.
Checkout for $12/month
Checkout for $108/yr
Secured by Stripe | AES-256 bit encryption


![61% of respondents consider their collection of SSCs and outsourcing to be a GBS organization, of which over half indicate a reporting line to the head of GBS [Figure 9]](https://cdn.prod.website-files.com/654e70fb59937215cac87b19/670368a197134cdd71c8587b_VxGhH7fq4EilnfOPRmPgHmApkeoU_aikR0LPw-TPurM.avif)