My Account
My Slides
Search by Category
Templates
View All Templates
Download Template Slides
Leave Feedback
Login
Logout
Get Started
Browse all Slides
Browse all Slides
Create a FREE Account
Instant access to 1,000+ real slides from top companies like McKinsey, BCG, Goldman Sachs, Google and many more!
First Name
Last Name
Email
Password
I agree to all
Terms & Privacy Policy
Thank you! Your submission has been received!
Oops! Something went wrong while submitting the form.
Have an account?
Sign in
Spark Your Next Big Idea with New Presentation Templates
VIEW ALL Templates
Welcome,
Welcome
PRO
Show Featured Only
Checkbox 8
Companies
Mckinsey
Bain
BCG
EY
Deloitte
Accenture
PwC/Strategy&
JP Morgan
Goldman Sachs
Morgan Stanley
Citigroup
Deutsche Bank
Barclays
LEK
KPMG
Kearney
Oliver Wyman
Booz Allen Hamilton
Gartner
IPSOS
Nielsen
Slide type
Text Only
Linear Flow
Vertical Flow
Single Chart
Header Horizontal
Mixed Chart
Header Vertical
Pillar
Multiple Chart
Graphic
Agenda
Title
Table
Framework
Industry
Technology & Software
Artificial Intelligence
Financial Services
Retail & E-commerce
Consumer Goods
Industrial & Manufacturing
Transportation & Logistics
Telecommunications
Real Estate & Construction
Hospitality & Tourism
Professional Services
Education & Training
Media & Entertainment
Agriculture & Food Production
Healthcare & Pharmaceuticals
Environmental Services & Sustainability
Government & Public Sector
Use Case
Mergers and Acquisitions
Performance Metrics and KPIs
Client Case Studies
Competitive Landscape
Corporate Finance and Valuation
Product and Service Analysis
Customer and Market Segmentation
Organizational Structure and Change
Industry Overview
Regulatory and Compliance
Risk Assessment and Management
Investment Analysis
Organizational Structure and Change
Human Resources and Talent Management
Financial Performance
Market Analysis and Trends
Sales and Business Development
Human Resources and Talent Management
Clear all
Thank you! Your submission has been received!
Oops! Something went wrong while submitting the form.
Tag
View slide
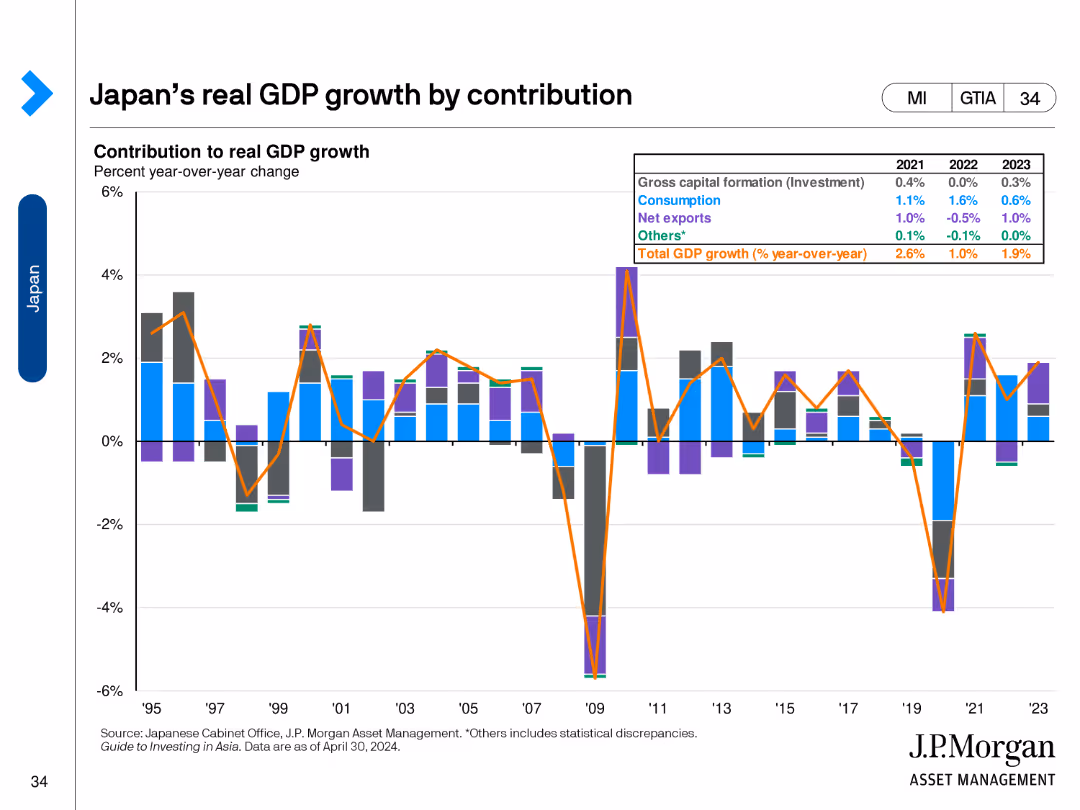
The slide features a stacked column chart illustrating Japan's real GDP growth contributions by investment, consumption, net exports, and other factors over time.
Financial Performance
Financial Services
This slide analyzes Japan's GDP growth contributions from various sectors like investment, consumption, and net exports.
GDP, Japan, Growth, Investment, Consumption
false
Financial Performance
Financial Services financial-services
Single Chart
JP Morgan
View slide
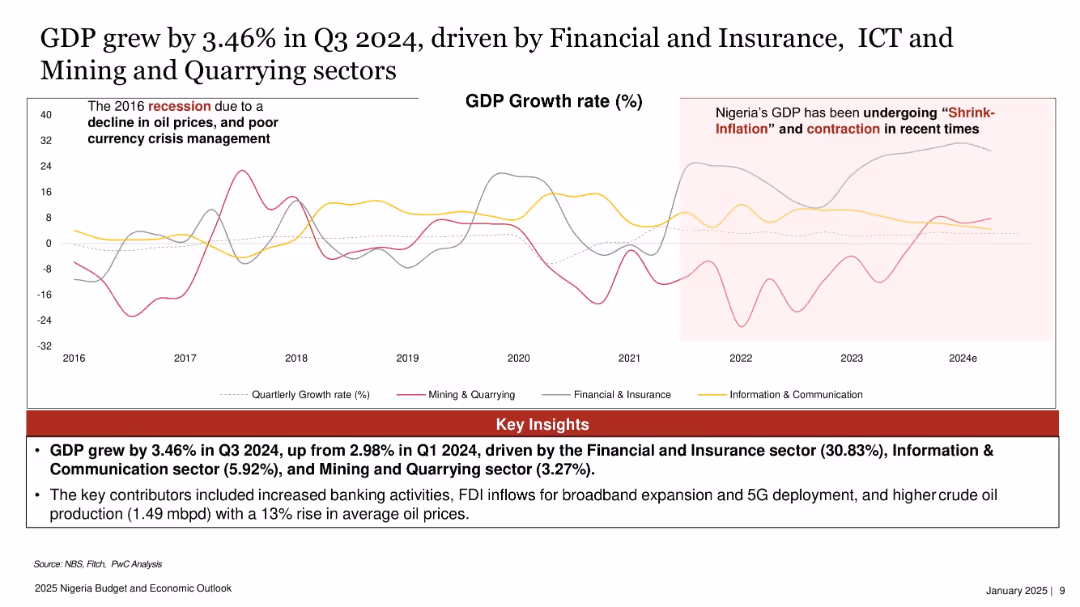
Line graph with three color-coded lines tracking sectoral GDP growth rates over time, with callouts and shaded highlights.
Market Analysis and Trends
Government & Public Sector
GDP in Nigeria grew by 3.46% in Q3 2024, driven primarily by Financial & Insurance (30.83%), ICT (5.92%), and Mining & Quarrying (3.27%). The slide shows sectoral trends since 2016, noting impacts from oil price fluctuations and currency crises.
GDP, Nigeria, sector growth, ICT, financial services, mining, quarterly growth, PwC
false
Market Analysis and Trends
Government & Public Sector government-and-public-sector
Mixed Chart
PwC/Strategy&
View slide
Contains multiple line graphs depicting a hypothetical recurrent virus impact on GDP. Colored lines represent different regions.
Market Analysis and Trends
Financial Services
Discusses how a potential virus recurrence could impact GDP in various major economies, useful for strategic economic planning.
GDP, Recurrence, Virus, Economic impact, Planning
false
Market Analysis and Trends
Financial Services financial-services
Single Chart
McKinsey
View slide
This slide is structured with a left side dedicated to graphical data regarding GDP contribution to growth, with a bar chart, and a right side presenting two line graphs depicting industrial production and retail trade. The design is clean and allows for direct comparison between different economic metrics.
Financial Performance
Financial Services
This slide reviews key economic contributors to Russia's GDP decline, presenting data on private consumption, inventories, and net trade. The information is strategically organized to highlight areas of economic stagnation, offering valuable insight for financial analysts and economic policymakers.
GDP, Russia, Private Consumption, Trade, Economic, Stagnation
false
Financial Performance
Financial Services financial-services
Multiple Chart
McKinsey
View slide
Two-column charts depicting the U.S. real GDP year-over-year changes and S&P 500 Price Index calendar year returns from 1947 to 2022.
Market Analysis and Trends
Financial Services
This slide shows the relationship between U.S. government configurations and the economy, highlighting real GDP changes and S&P 500 returns under different political scenarios.
GDP, S&P 500, stock market, government, economy
false
Market Analysis and Trends
Financial Services financial-services
Multiple Chart
JP Morgan
View slide
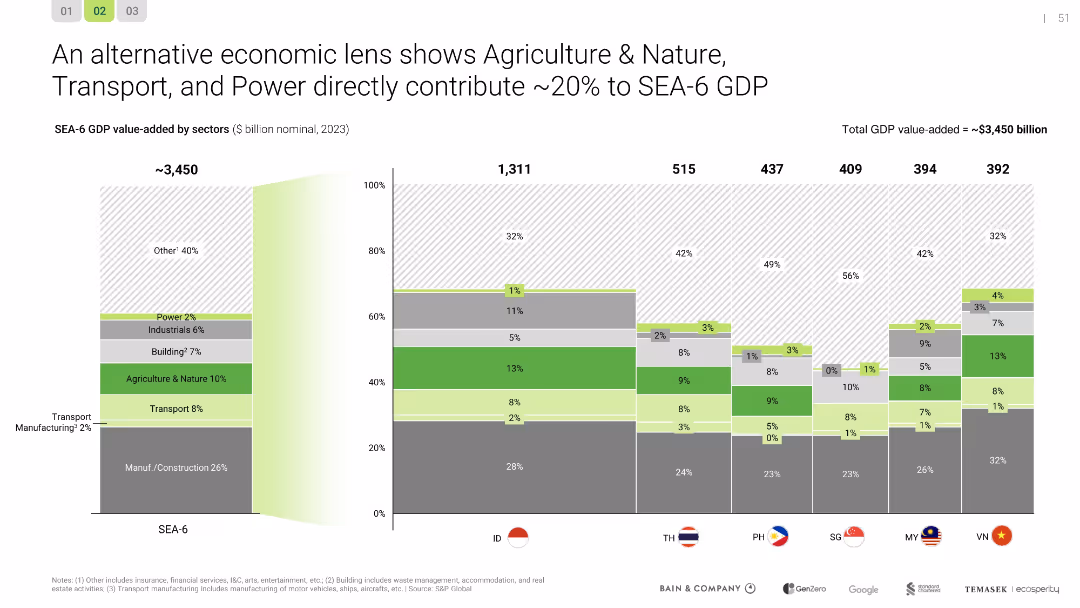
Stacked bar chart showing sectoral GDP contribution per SEA country; SEA-6 aggregated
Financial Performance
Agriculture & Food Production
The economic value of Agriculture & Nature, Power, and Transport is outlined as ~20% of SEA-6 GDP. The chart reveals the proportionate contributions by country, linking sectoral performance to strategic decarbonization priorities.
GDP, SEA, agriculture, transport, power, economy, sectoral analysis
false
Financial Performance
Agriculture & Food Production agriculture-and-food-production
Single Chart
Bain
View slide
Slide includes comparative line graphs for various GDP scenarios worldwide. Uses shades of blue for differentiation.
Market Analysis and Trends
Financial Services
This slide analyzes multiple global GDP scenarios, aiding in understanding potential economic futures based on virus impacts.
GDP, Scenarios, Global, Economy, Forecast
false
Market Analysis and Trends
Financial Services financial-services
Single Chart
McKinsey
View slide
This slide contains multiple line graphs comparing incremental GDP changes with broadband speeds. Graphs are color-coded, representing different models from Briglauer et al. (2021) and Accenture (2023). Includes textual annotations on the right.
Market Analysis and Trends
Technology & Software
Analyzes the impact of broadband speed on GDP growth, contrasting different models and their implications for economic forecasting. Discusses methodological differences and data interpretations.
GDP, broadband, economic analysis, models, line graph
false
Market Analysis and Trends
Technology & Software technology-and-software
Mixed Chart
Accenture
View slide
Features a line graph showing the relationship between broadband speed and GDP changes. Graph is color-coded to illustrate different time periods and predicted impacts, accompanied by a detailed legend and textual insights on the left.
Market Analysis and Trends
Technology & Software
Highlights statistical findings on broadband's effect on GDP from historical data and projected future trends. Compares these results to other international studies.
GDP, broadband, statistics, projections, line graph
false
Market Analysis and Trends
Technology & Software technology-and-software
Mixed Chart
Accenture
View slide
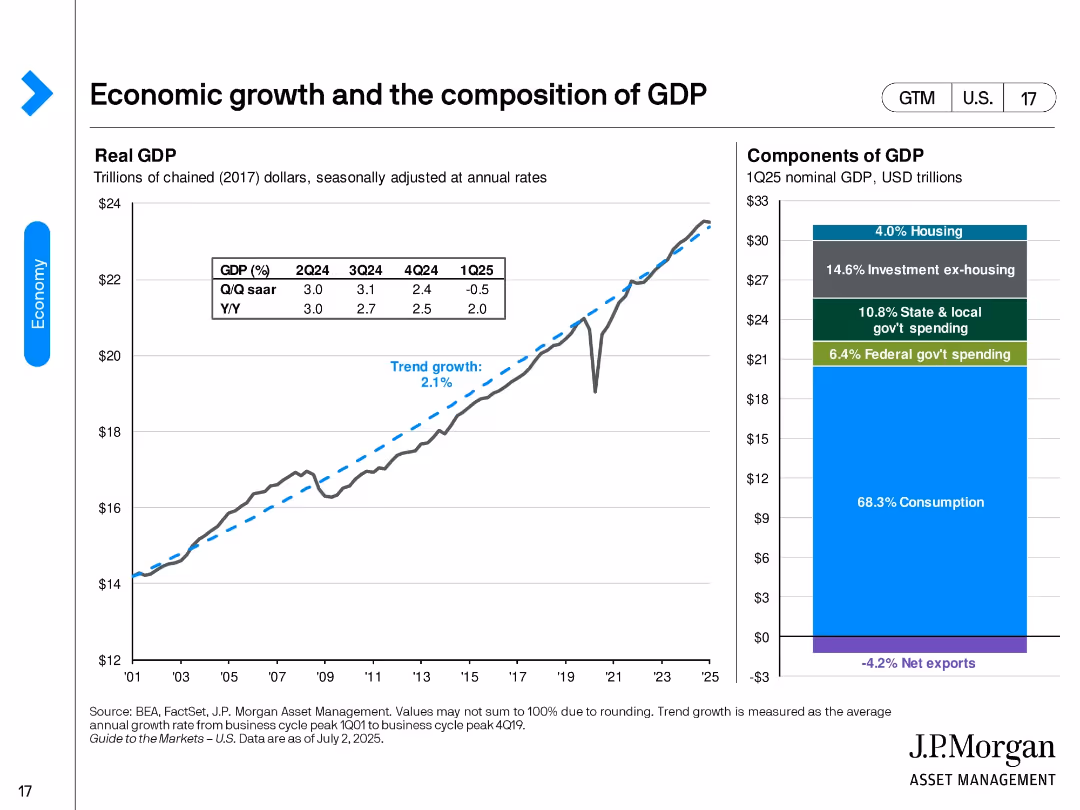
Split layout with a line chart on the left showing real GDP trend from 2001 to 2025 and a stacked bar chart on the right illustrating the components of 1Q25 nominal GDP. Simple design with blue highlights and clean axis labels.
Market Analysis and Trends
Financial Services
The slide shows long-term real GDP growth versus trend growth (2.1%) and Q/Q and Y/Y changes into Q1 2025. The GDP composition highlights consumption (68.3%) as the largest share, followed by investment, government spending, and net exports.
GDP, consumption, trend growth, investment, net exports, government, economy, real GDP, Q1 2025, economic composition
false
Market Analysis and Trends
Financial Services financial-services
Multiple Chart
JP Morgan
View slide
This slide presents line graphs detailing economic recovery under a scenario of virus recurrence with muted recovery, highlighting GDP changes and recovery timelines.
Financial Performance
Financial Services
Evaluates the potential economic outcomes of a recurring COVID-19 scenario, focusing on delayed or subdued economic recovery across key global markets.
GDP, economic downturn, COVID-19, muted recovery, markets
false
Financial Performance
Financial Services financial-services
Single Chart
McKinsey
View slide
The slide includes a stacked bar chart of GDP components and a line chart of real GDP trend, displaying contributions from various sectors over time.
Market Analysis and Trends
Financial Services
This slide breaks down the components of real GDP growth and trends in Australia, highlighting sector contributions and overall economic performance.
GDP, economic growth, Australia, sector contributions, market analysis
false
Market Analysis and Trends
Financial Services financial-services
Multiple Chart
JP Morgan
View slide
Slide displays a line chart comparing the nominal GDP growth of BRICS, MINT, Next 11, and MIST countries up to 2030. Uses a simple color scheme and clear labels for easy understanding.
Market Analysis and Trends
Financial Services
This slide analyzes the GDP growth trajectories of various country groups, illustrating which might lead in economic growth. Used to highlight investment or development opportunities in these regions.
GDP, economic growth, BRICS, MINT, investment, development
false
Market Analysis and Trends
Financial Services financial-services
Mixed Chart
Roland Berger
View slide
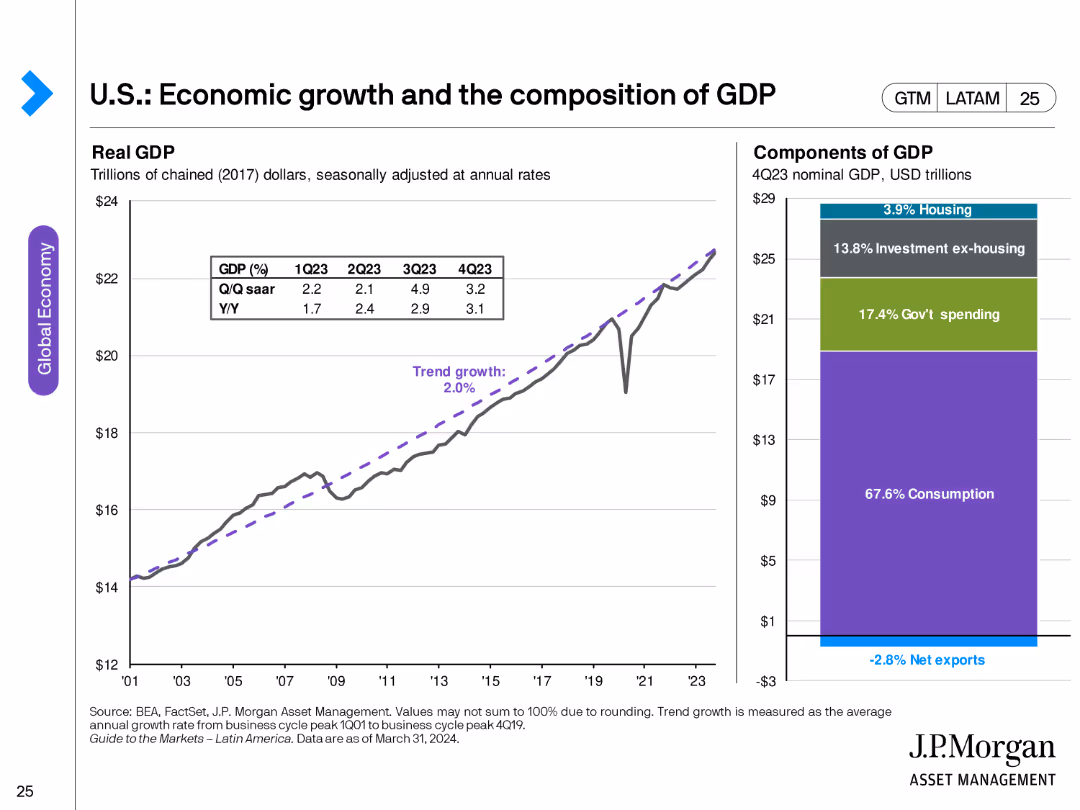
The slide displays a line chart on the left showing real GDP trends in trillions of chained dollars, seasonally adjusted. On the right, it includes a stacked column chart depicting the components of GDP in USD trillions for 4Q23.
Market Analysis and Trends
Financial Services
This slide provides an analysis of U.S. economic growth, detailing real GDP changes and the composition of GDP, including housing, government spending, consumption, and net exports.
GDP, economic growth, U.S. economy, consumption, government spending, housing, net exports
false
Market Analysis and Trends
Financial Services financial-services
Multiple Chart
JP Morgan
View slide
The slide contains two main charts: a column chart showing the component contribution to GDP and a line chart showing real GDP trends. The layout is moderately complex.
Market Analysis and Trends
Financial Services
This slide analyzes the quarterly changes in GDP, showing different contributions like consumption and investment. It also forecasts GDP trends based on current data.
GDP, economic growth, consumption, investment, forecast
false
Market Analysis and Trends
Financial Services financial-services
Multiple Chart
JP Morgan
View slide
A line chart displaying trends in GDP per capita from 2011 to 2016 for several US metro areas, each represented by a different colored line, with highlighted points for areas like San Francisco and Washington DC.
Financial Performance
Transportation & Logistics
Analyzes economic growth in U.S. metropolitan areas through GDP per capita over time, highlighting regions with significant changes. Useful for economic planning and assessment.
GDP, economic growth, metro areas, US, trends, financial analysis
false
Financial Performance
Transportation & Logistics transportation-and-logistics
Single Chart
BCG
View slide
Slide with column charts showing GDP growth indexed to 2015 levels for several countries, demonstrating the economic impact of COVID-19.
Risk Assessment and Management
Technology & Software
Analyzes the regression in economic growth due to COVID-19 across various countries, serving as a basis for risk assessment and recovery planning.
GDP, economic impact, COVID-19, country comparison, regression, column chart, risk management
false
Risk Assessment and Management
Technology & Software technology-and-software
Single Chart
Bain
View slide
Features line graphs comparing the GDP trajectories of major economies under different COVID-19 scenarios, annotated with specific percentage changes and recovery timelines.
Financial Performance
Financial Services
Analyzes the economic impact of the COVID-19 pandemic across major global economies, offering scenario-based projections for GDP growth and recovery.
GDP, economic impact, COVID-19, recovery, scenario analysis
false
Financial Performance
Financial Services financial-services
Single Chart
McKinsey
View slide
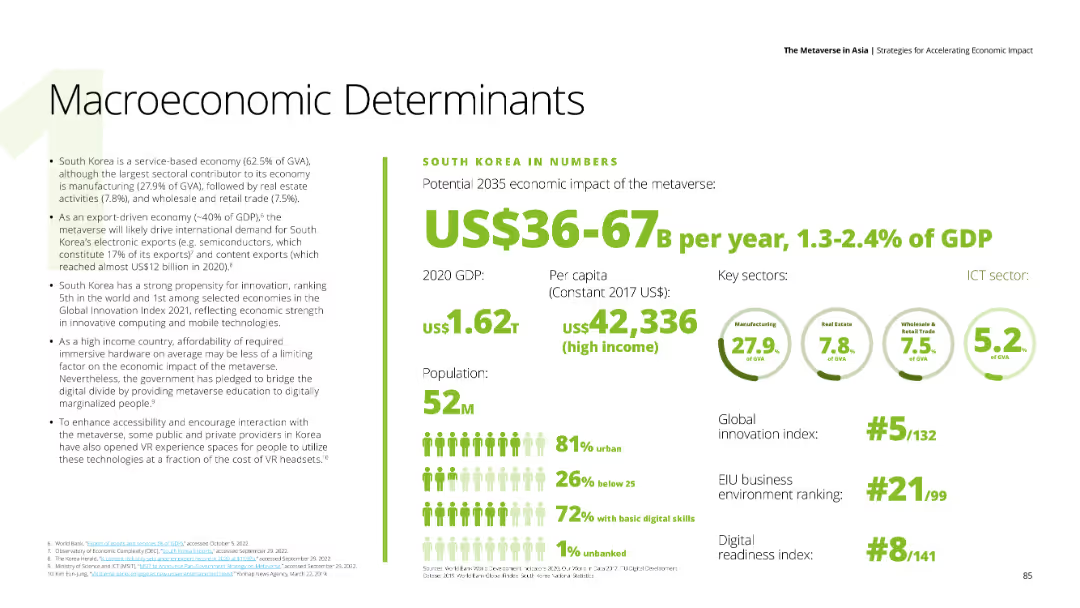
The slide includes textual content on the left detailing South Korea's economic strengths and challenges. On the right, there are key economic indicators presented as numbers and icons, highlighting potential economic impacts.
Market Analysis and Trends
Financial Services
Highlights South Korea's economic indicators, including GDP, population, and innovation index, with potential metaverse impacts estimated at US$36-67 billion annually.
GDP, economic impact, innovation, metaverse, South Korea
false
Market Analysis and Trends
Financial Services financial-services
Mixed Chart
Deloitte
View slide
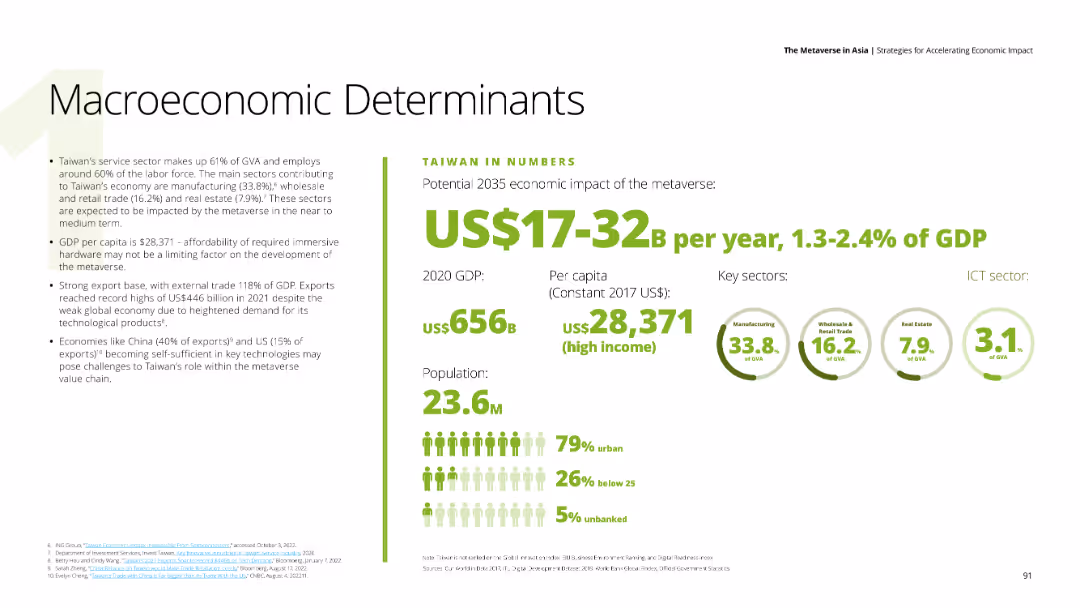
The slide features textual content on the left detailing Taiwan's economic strengths and challenges. On the right, key economic indicators are presented, highlighting potential economic impacts in the metaverse.
Market Analysis and Trends
Financial Services
Details Taiwan's economic metrics, including GDP, population, and sectoral contributions, with potential metaverse impacts estimated at US$17-32 billion annually.
GDP, economic impact, metaverse, Taiwan, market analysis
false
Market Analysis and Trends
Financial Services financial-services
Mixed Chart
Deloitte
View slide
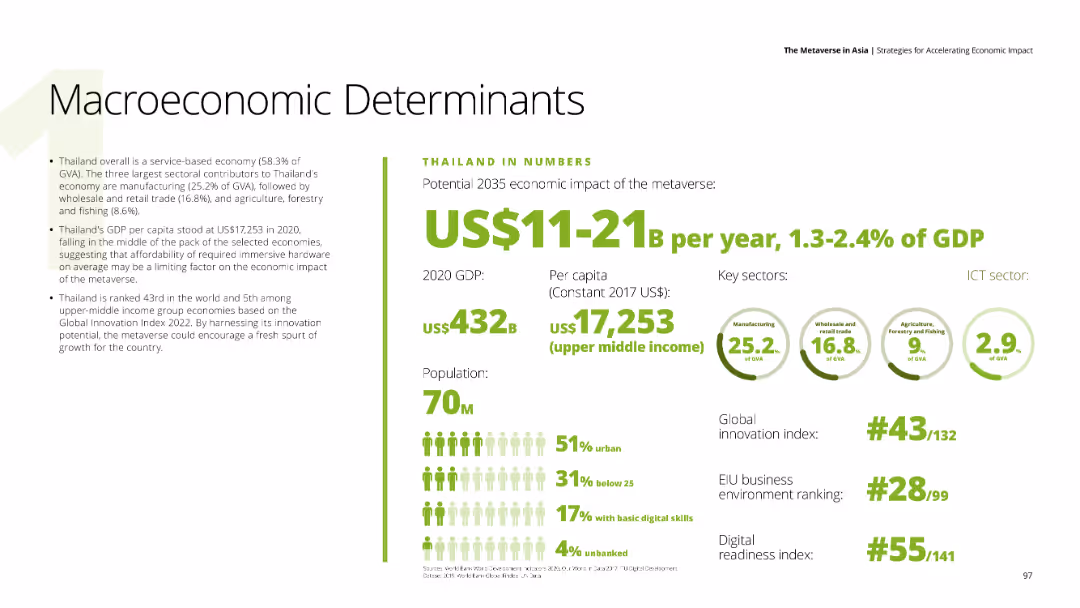
The slide features textual content on the left detailing Thailand's economic strengths and challenges. Key economic indicators are presented on the right, with a focus on potential economic impacts in the metaverse.
Market Analysis and Trends
Financial Services
Covers Thailand's economic indicators, including GDP, population, and sectoral contributions, with potential metaverse impacts estimated at US$11-21 billion annually.
GDP, economic impact, metaverse, Thailand, market analysis
false
Market Analysis and Trends
Financial Services financial-services
Mixed Chart
Deloitte
View slide
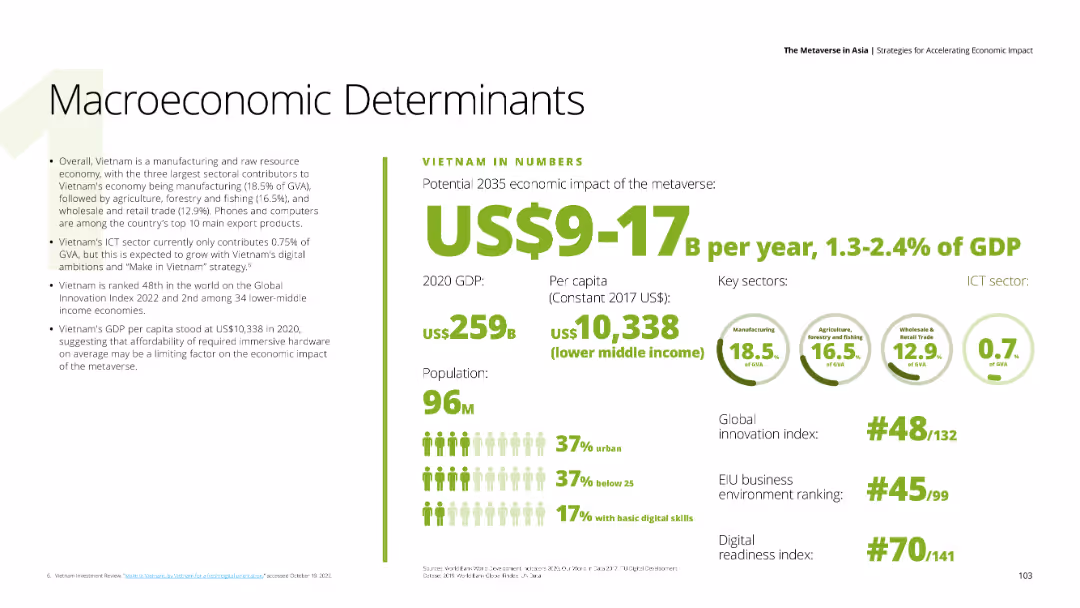
The slide features textual content on the left detailing Vietnam's economic strengths and challenges. Key economic indicators are presented on the right, highlighting potential economic impacts in the metaverse.
Market Analysis and Trends
Financial Services
Describes Vietnam's economic metrics, including GDP, population, and sectoral contributions, with potential metaverse impacts estimated at US$9-17 billion annually.
GDP, economic impact, metaverse, Vietnam, market analysis
false
Market Analysis and Trends
Financial Services financial-services
Mixed Chart
Deloitte
View slide
Features a set of horizontal bar graphs displaying GDP forecast levels for multiple countries (US, Europe, China, Japan, India) from 2019 to 2021. Each country's forecast is color-coded, and the slide uses a minimalist design to focus on the comparison of economic projections.
Strategic Planning
Financial Services
Predicts the GDP levels for several large economies, comparing projected recoveries to 2019 levels. It highlights the economic resilience and expected recovery timeline, providing a visual comparison of pre and post-COVID economic forecasts.
GDP, economic recovery, 2021, forecast, COVID-19, countries, comparison
false
Strategic Planning
Financial Services financial-services
Single Chart
BCG
View slide
A comparative chart showcasing GDP forecasts for various economies with indicators for past and projected levels.
Financial Performance
Financial Services
This slide compares GDP levels of major economies, predicting recovery trends post-2021, relevant for economic forecasting and policy planning.
GDP, economic recovery, forecast, policy planning, financial analysis
false
Financial Performance
Financial Services financial-services
Multiple Chart
BCG
View slide
The slide includes multiple column charts comparing projected GDP levels for several countries.
Strategic Planning
Financial Services
Focuses on the projected GDP growth post-COVID-19, with comparative data for countries like the US, Europe, and China, highlighting economic recovery timelines.
GDP, economic recovery, projections, data
false
Strategic Planning
Financial Services financial-services
Multiple Chart
BCG
View slide
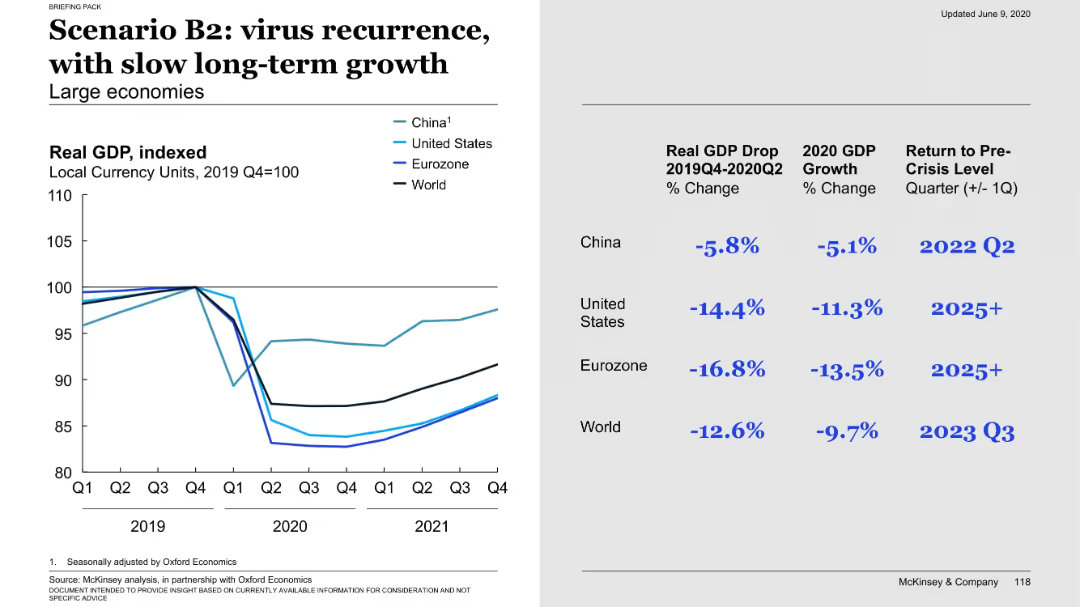
Split-slide layout with a line graph on the left and a data table on the right. Visualizes GDP recovery paths for major economies post-COVID-19.
Market Analysis and Trends
Financial Services
Projects slow economic recovery for China, US, Eurozone, and world under Scenario B2, highlighting GDP drop and projected return to pre-crisis levels. US and Eurozone recover slower than China and world average.
GDP, economic scenarios, recovery, COVID-19, China, US, Eurozone, forecast
false
Market Analysis and Trends
Financial Services financial-services
Mixed Chart
McKinsey
View slide
The scatter plot correlates the average years of education completed to GDP per capita PPP across various countries, highlighted by dots labeled with country names.
Market Analysis and Trends
Education & Training
Discussing the correlation between the length of education and economic prosperity measured in GDP per capita PPP in 2020, this slide illustrates significant positive relationships across various countries, with detailed data points.
GDP, education, correlation, economic, prosperity
false
Market Analysis and Trends
Education & Training education-and-training
Single Chart
Roland Berger
View slide
The slide features a scatter plot showing GDP per capita (PPP) versus tertiary GER (Gross Enrollment Ratio) for various countries in 2017. The data points are color-coded by continent. The chart is divided into three phases of economic growth, with annotations explaining each phase.
Market Analysis and Trends
Education & Training
This slide presents the correlation between education and economic growth, using a scatter plot to compare GDP per capita with tertiary GER across different countries. It highlights the relationship between higher education enrollment and economic development stages globally.
GDP, education, economic growth, global comparison, enrollment
false
Market Analysis and Trends
Education & Training education-and-training
Single Chart
LEK
View slide
The slide features a line graph showing the GDP and employment trends in Canada, illustrating a steep drop-off and recovery.
Market Analysis and Trends
Financial Services
It depicts the economic impact of the pandemic on GDP and employment, showing a classic "V" shaped recovery pattern.
GDP, employment, Canada, economic impact, pandemic, recovery, V-shape, trends, line graph, analysis
false
Market Analysis and Trends
Financial Services financial-services
Single Chart
IPSOS
View slide
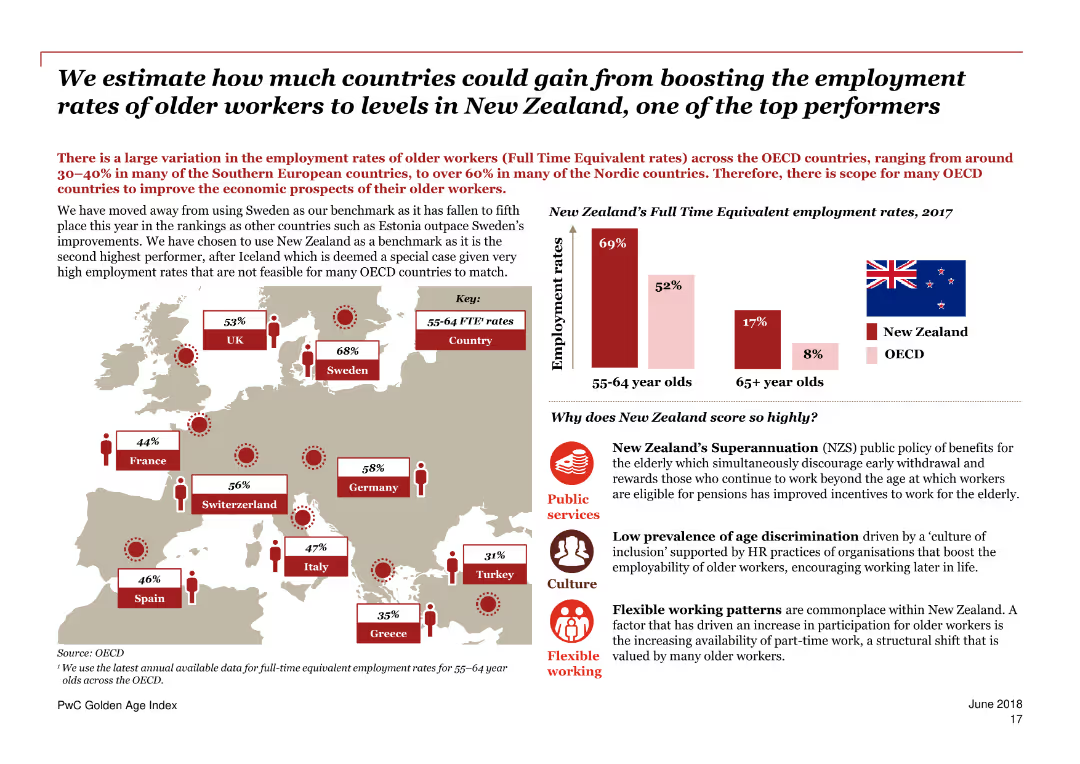
Contains a combination of maps, column charts, and text blocks. Mainly red color scheme.
Market Analysis and Trends
Government & Public Sector
Estimates the potential GDP gains for OECD countries by increasing older worker employment rates to match those of New Zealand.
GDP, employment, older workers, New Zealand, OECD, potential gains, trends, comparison, countries, economic analysis
false
Market Analysis and Trends
Government & Public Sector government-and-public-sector
Mixed Chart
PwC/Strategy&
Previous
Loading...
Hold On!
We are searching in our database
If nothing, comes up, please try different filters!
Column Chart
Heatmap
Chevron
Org Chart
Infographic
Callouts
Timeline
List
Graphic
Picture
Process Flow
Diagram
Paragraph
Map
Table
Framework
Subtitle
Takeaway Box
Icon
Other Chart
Radar Chart
Waterfall Chart
Mekko Chart
Pie Chart
Scatter Plot
Line Chart
Bar chart
Bullet points
Create a FREE account to continue browsing
Receive Instant Access to 1,000+ slides from companies like McKinsey, Google, and Goldman Sachs
First Name
Last Name
Email
Password
I agree to all
Terms & Privacy Policy
Thank you! Your submission has been received!
Oops! Something went wrong while submitting the form.
Have an account?
Sign in
Upgrade to PRO to Save slides
Advanced Search and Filters
Access to 15,000+ slides
Access to Category Pages
Save/Bookmark Slides
PowerPoint Template Library
Pick a Plan
MONTHLY
$12/month
Billed every month, Cancel anytime.
YEARLY
$9/year
Billed $108 annually, Cancel anytime.
Checkout for $12/month
Checkout for $108/yr
Secured by Stripe | AES-256 bit encryption