My Account
My Slides
Search by Category
Templates
View All Templates
Download Template Slides
Leave Feedback
Login
Logout
Get Started
Browse all Slides
Browse all Slides
Create a FREE Account
Instant access to 1,000+ real slides from top companies like McKinsey, BCG, Goldman Sachs, Google and many more!
First Name
Last Name
Email
Password
I agree to all
Terms & Privacy Policy
Thank you! Your submission has been received!
Oops! Something went wrong while submitting the form.
Have an account?
Sign in
Spark Your Next Big Idea with New Presentation Templates
VIEW ALL Templates
Welcome,
Welcome
PRO
Show Featured Only
Checkbox 8
Companies
Mckinsey
Bain
BCG
EY
Deloitte
Accenture
PwC/Strategy&
JP Morgan
Goldman Sachs
Morgan Stanley
Citigroup
Deutsche Bank
Barclays
LEK
KPMG
Kearney
Oliver Wyman
Booz Allen Hamilton
Gartner
IPSOS
Nielsen
Slide type
Text Only
Linear Flow
Vertical Flow
Single Chart
Header Horizontal
Mixed Chart
Header Vertical
Pillar
Multiple Chart
Graphic
Agenda
Title
Table
Framework
Industry
Technology & Software
Artificial Intelligence
Financial Services
Retail & E-commerce
Consumer Goods
Industrial & Manufacturing
Transportation & Logistics
Telecommunications
Real Estate & Construction
Hospitality & Tourism
Professional Services
Education & Training
Media & Entertainment
Agriculture & Food Production
Healthcare & Pharmaceuticals
Environmental Services & Sustainability
Government & Public Sector
Use Case
Mergers and Acquisitions
Performance Metrics and KPIs
Client Case Studies
Competitive Landscape
Corporate Finance and Valuation
Product and Service Analysis
Customer and Market Segmentation
Organizational Structure and Change
Industry Overview
Regulatory and Compliance
Risk Assessment and Management
Investment Analysis
Organizational Structure and Change
Human Resources and Talent Management
Financial Performance
Market Analysis and Trends
Sales and Business Development
Human Resources and Talent Management
Clear all
Thank you! Your submission has been received!
Oops! Something went wrong while submitting the form.
Tag
View slide
This slide features comparative column charts that contrast the growth in real GDP per capita against the expenditures on food and beverages from 2015 to 2030 in various regions, including OECD, Western Europe, Developing countries, BRIC, and China. The charts are color-coded to distinguish between the years compared, and each region's data points are clearly labeled to facilitate easy interpretation.
Market Analysis and Trends
Financial Services
The slide examines economic growth versus expenditure trends on food and beverages in various global regions. It highlights a general trend where increased prosperity leads to a relative decrease in the proportion of spending on food, indicating a shift in consumer behavior and economic priorities.
GDP growth, consumer spending, economic analysis, developed countries, developing countries, expenditure trends, food and beverages, prosperity effects, market trends, fiscal policies
false
Market Analysis and Trends
Financial Services financial-services
Single Chart
Roland Berger
View slide
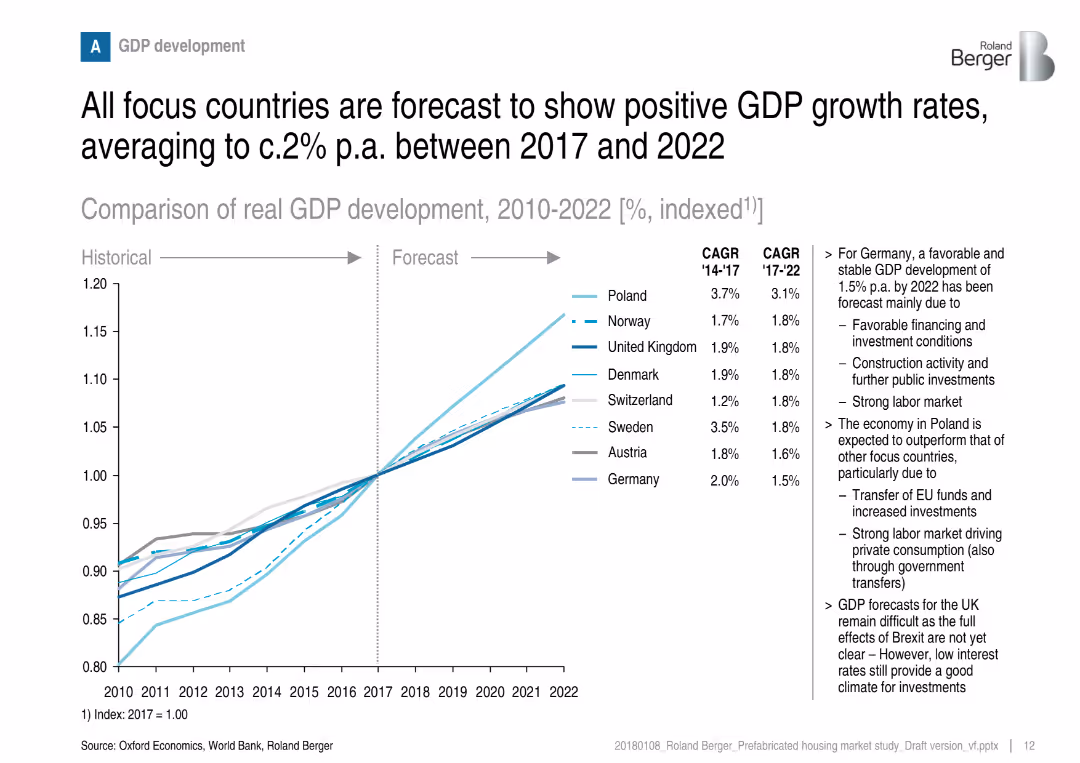
Line graph with GDP growth trends from 2010–2022 by country, accompanied by CAGR data and textual analysis.
Strategic Planning
Real Estate & Construction
The slide presents historical and forecasted GDP growth for eight European countries. It emphasizes stable economic development and highlights GDP as a critical driver for construction markets, especially in Germany and Poland.
GDP growth, economic forecast, prefabricated housing, construction demand, Poland, Germany, CAGR, economic indicators
false
Strategic Planning
Real Estate & Construction real-estate-and-construction
Mixed Chart
Roland Berger
View slide
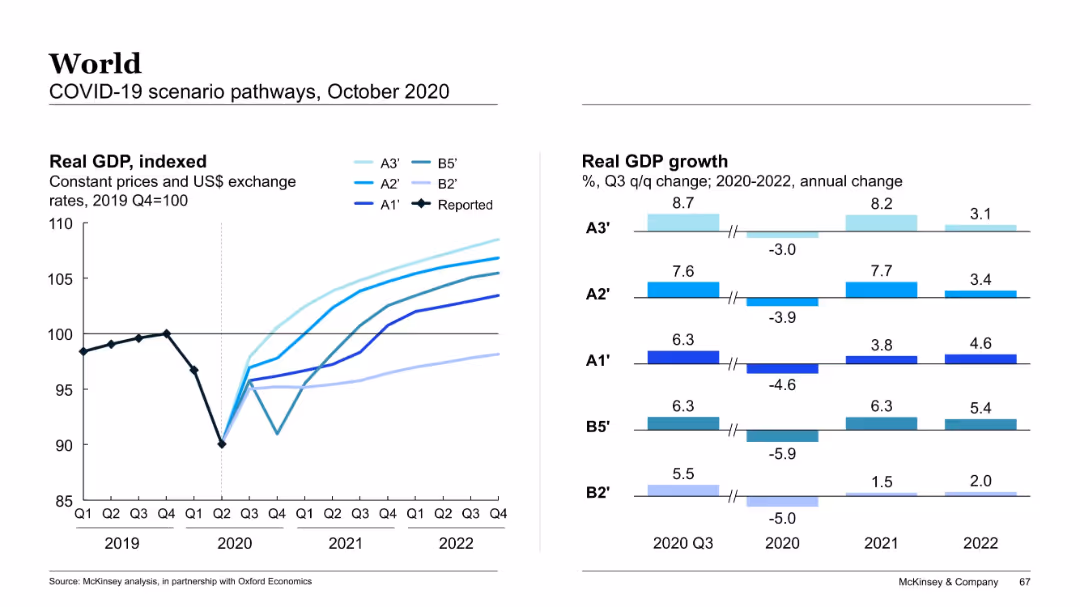
Dual panel: left GDP line graph with scenarios; right bar chart of real GDP growth rates from 2020 to 2022
Market Analysis and Trends
Financial Services
The slide presents projected real GDP growth for different COVID-19 recovery paths. Each scenario (A3' to B2') includes quarterly growth for 2020 Q3 and annual rates for 2020–2022, showing variance based on severity and policy responses.
GDP growth, economic forecast, scenario analysis, COVID-19, recovery
false
Market Analysis and Trends
Financial Services financial-services
Multiple Chart
McKinsey
View slide
Comparative bar charts displaying GDP growth forecasts against baseline for 2020 and 2021, offering a global perspective with specific focus on major economies.
Financial Performance
Financial Services
Offers insights into the projected global economic downturn in 2020 and recovery prospects for 2021, based on GDP growth forecasts from various sources.
GDP growth, economic forecasts, 2020 downturn, 2021 recovery, global economy, financial analysis, investment planning
false
Financial Performance
Financial Services financial-services
Multiple Chart
BCG
View slide
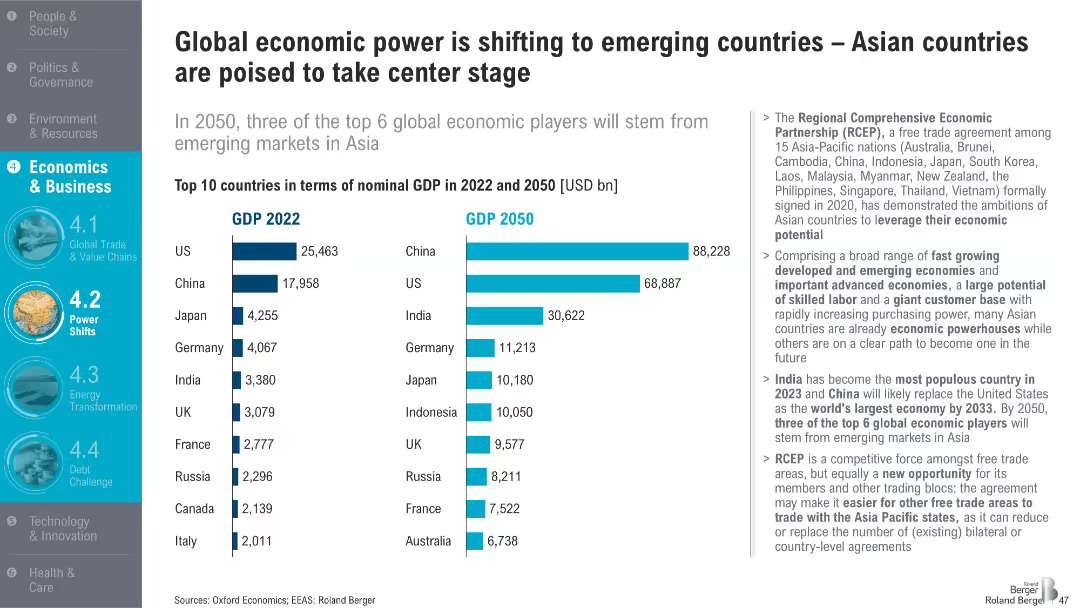
Side-by-side bar chart comparing GDP in 2022 vs. projected 2050; right-hand text box summarizes key implications; simple layout with bold labels
Strategic Planning
Financial Services
The slide forecasts a major global power shift by 2050, with emerging markets like China and India overtaking developed nations in GDP rankings. The Regional Comprehensive Economic Partnership (RCEP) is highlighted as a driver of this trend.
GDP growth, emerging markets, RCEP, China, India, economic power shift, Asia, 2050 projection, global economy, trade
false
Strategic Planning
Financial Services financial-services
Mixed Chart
Roland Berger
View slide
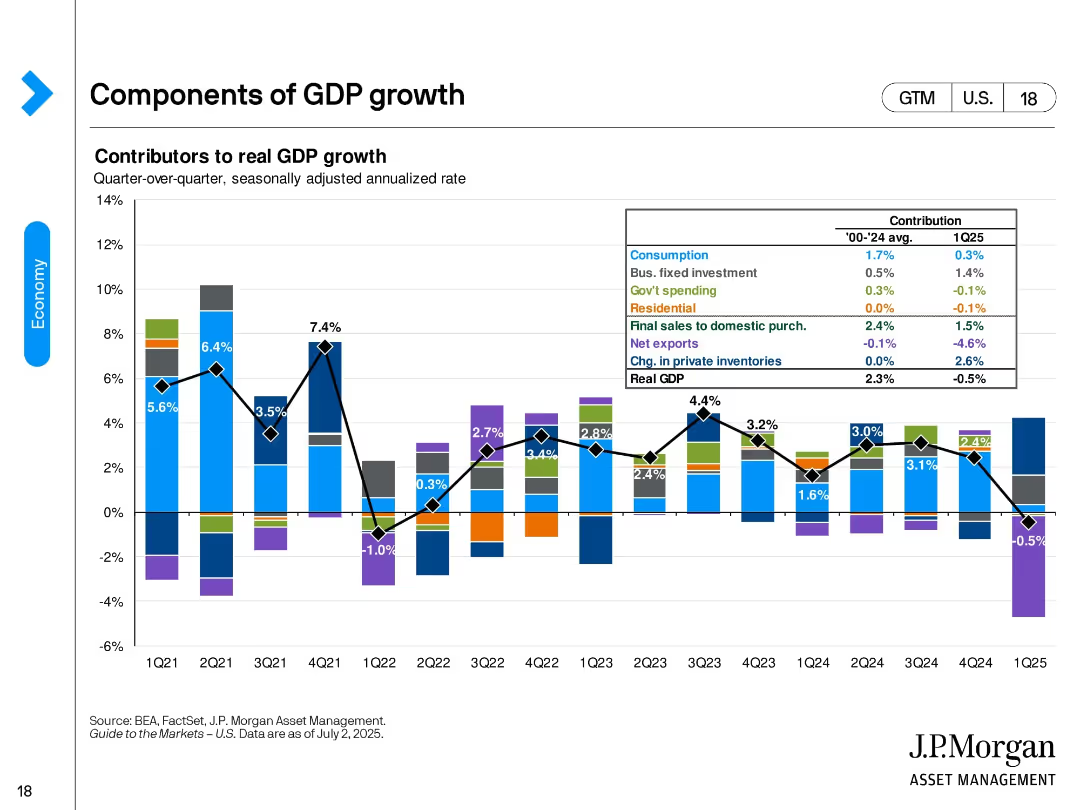
Bar chart with overlaid line chart. Each bar segment is color-coded to show contribution by GDP component per quarter, from Q1 2021 to Q1 2025. A box summary in top-right shows average contributions and Q1 2025 values.
Market Analysis and Trends
Financial Services
This slide dissects the components contributing to quarterly GDP growth, highlighting changes in consumption, investment, net exports, and inventories. It shows a -0.5% decline in real GDP in Q1 2025, largely driven by a -4.6% drag from net exports.
GDP growth, investment, net exports, consumption, inventories, quarterly trends, Q1 2025, economic contribution, real GDP
false
Market Analysis and Trends
Financial Services financial-services
Single Chart
JP Morgan
View slide
Column chart comparing GDP growth vs. Net Income growth across different regions (Developed Economies, United States, etc.), bars in red and grey, descriptive annotations.
Financial Performance
Financial Services
This slide compares GDP growth with net income growth across various regions, illustrating a golden age of corporate profitability. Useful for economic insights and financial trend analysis.
GDP growth, net income, corporate profitability, economic analysis, financial trends, regions, comparison
false
Financial Performance
Financial Services financial-services
Single Chart
Bain
View slide
The slide presents a pie chart comparison for 2020 and 2030 with text annotations. The visual elements are well-arranged, utilizing white space effectively on a purple background.
Market Analysis and Trends
Technology & Software
This slide predicts economic shifts in Indonesia, focusing on the growing importance of non-metropolitan areas in GDP contribution.
GDP growth, non-metropolitan, economic importance, forecast
false
Market Analysis and Trends
Technology & Software technology-and-software
Table
Kearney
View slide
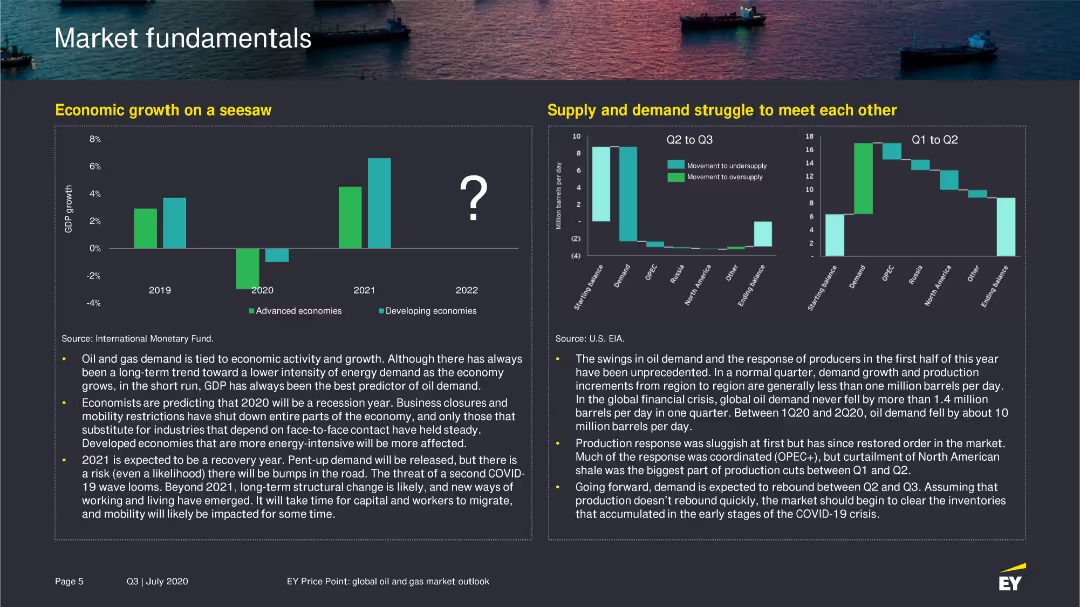
The slide contains a column chart showing GDP growth from 2019 to 2022 for advanced and developing economies, and a column chart on supply and demand fluctuations in the oil market.
Market Analysis and Trends
Energy & Utilities
Explains the variability in economic growth and oil demand, emphasizing the factors affecting these trends in the context of the global economy and energy sector.
GDP growth, oil demand, economic trends, 2022
false
Market Analysis and Trends
Energy & Utilities energy-and-utilities
Multiple Chart
EY
View slide
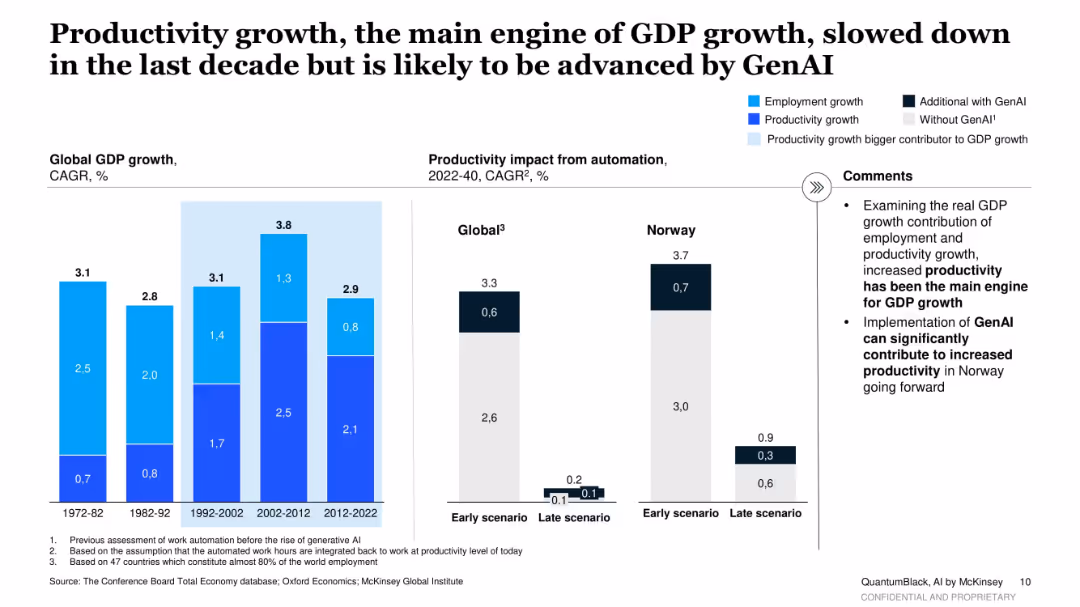
Side-by-side bar charts. Left shows historical GDP growth decomposition. Right shows future productivity gains under GenAI scenarios (global & Norway).
Performance Metrics and KPIs
Artificial Intelligence
This slide highlights the role of productivity in driving GDP growth, noting its recent slowdown and forecasting its rebound due to GenAI. It compares historical trends and future projections under GenAI.
GDP growth, productivity, GenAI, Norway, economic performance, automation, scenario analysis
false
Performance Metrics and KPIs
Artificial Intelligence artificial-intelligence
Multiple Chart
McKinsey
View slide
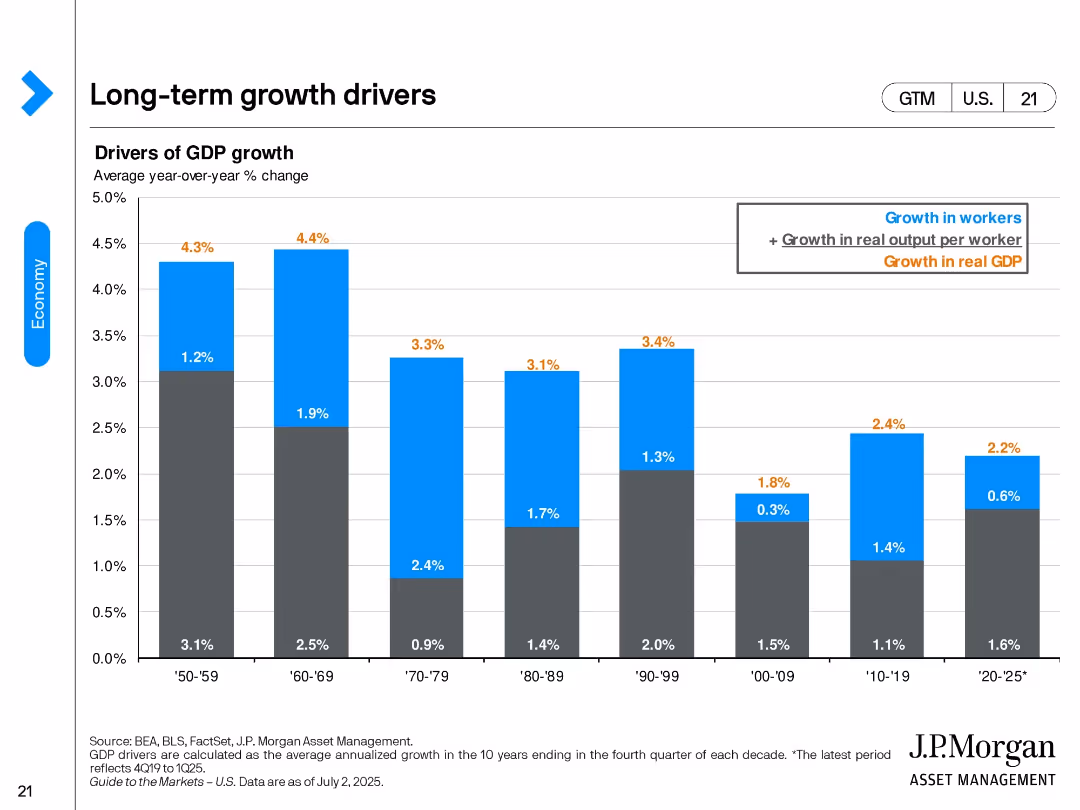
Vertical bar chart showing decade-wise GDP growth since the 1950s. Each bar is split into components: growth in workers and productivity per worker. The most recent bar shows 2020–2025 as a partial period.
Strategic Planning
Financial Services
Highlights long-term GDP growth drivers by decade, emphasizing shifts in labor force expansion and productivity. It notes slowing growth in the 2020s, with output per worker now a more significant contributor than workforce growth.
GDP growth, productivity, workforce, output per worker, historical trends, long-term planning, economic potential
false
Strategic Planning
Financial Services financial-services
Single Chart
JP Morgan
View slide
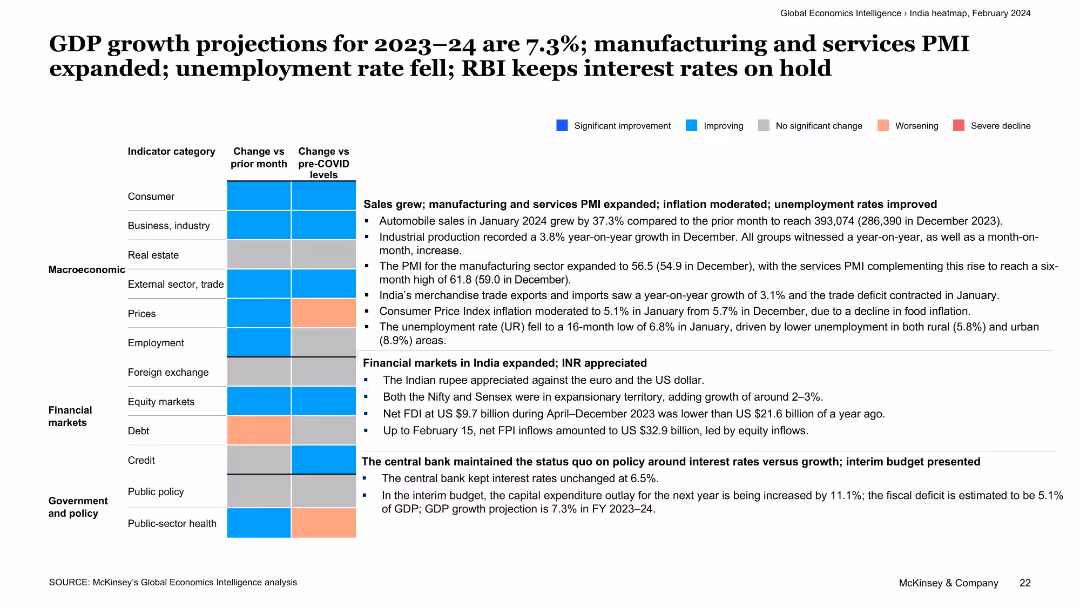
The slide features a detailed text summary with color-coded economic indicators. It covers various categories, including consumer, business, macroeconomic factors, and financial markets.
Market Analysis and Trends
Financial Services
This slide outlines the GDP growth projections of 7.3% for 2023–24, noting expansions in manufacturing and services PMI, improved employment rates, and stable interest rates by the RBI. It provides an overview of India's economic outlook.
GDP growth, projections, manufacturing, services PMI, employment rates
false
Market Analysis and Trends
Financial Services financial-services
Table
McKinsey
View slide
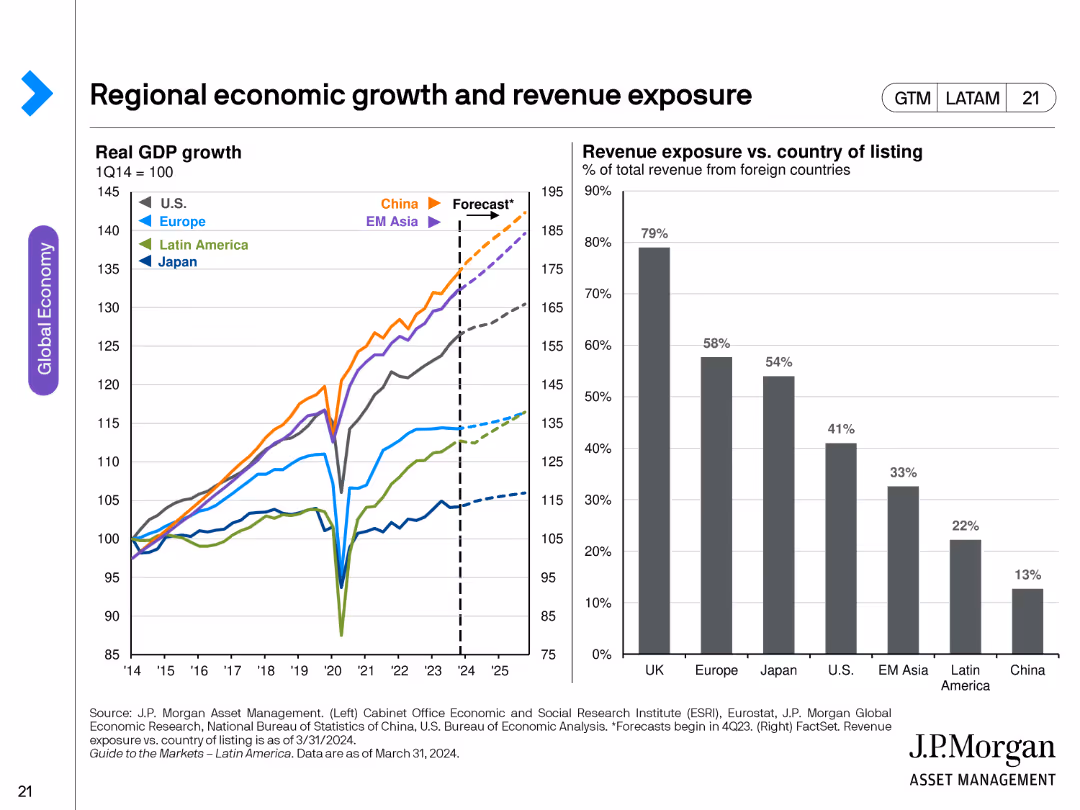
The slide features two charts: a line chart for real GDP growth and a column chart for revenue exposure vs. country of listing.
Market Analysis and Trends
Financial Services
This slide compares regional economic growth and revenue exposure for various countries, highlighting trends and forecasted GDP growth as of 1Q14 to March 2024.
GDP growth, revenue exposure, global economy, trends, regional growth
false
Market Analysis and Trends
Financial Services financial-services
Multiple Chart
JP Morgan
View slide
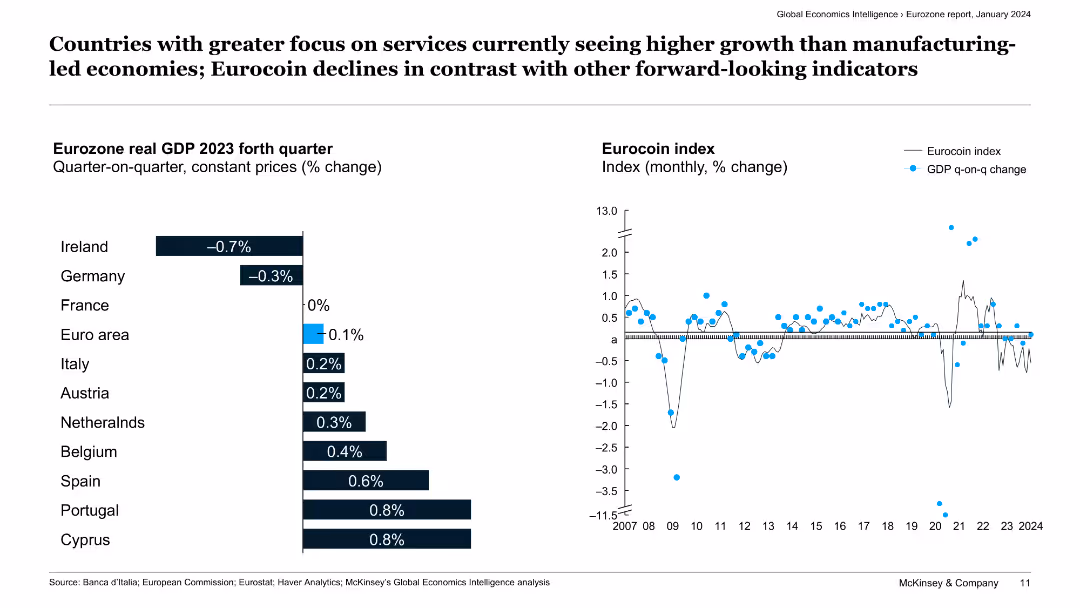
The slide displays a bar chart comparing GDP growth by country and a line chart tracking the Eurocoin index, with accompanying text on economic performance.
Market Analysis and Trends
Financial Services
This slide compares GDP growth in service-focused countries versus manufacturing-led economies, using a bar chart and Eurocoin index line chart to illustrate the differences.
GDP growth, services, manufacturing, economies, Eurocoin index, comparison, financial services, economic performance, overview, trends
false
Market Analysis and Trends
Financial Services financial-services
Multiple Chart
McKinsey
View slide
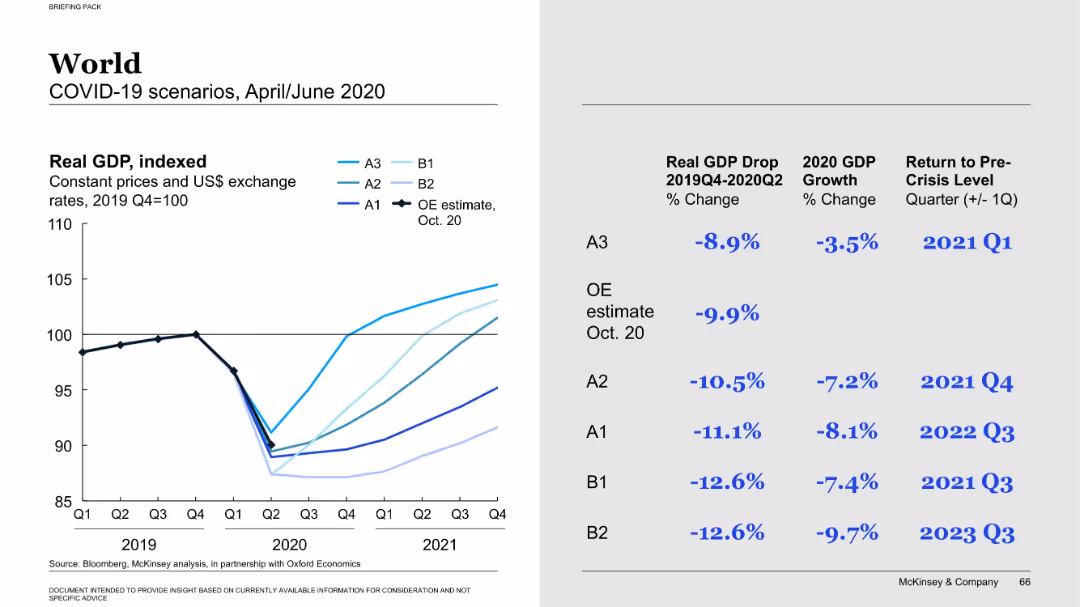
Split layout: left shows GDP line graph; right shows tabular comparison of GDP drop, growth, and recovery timing
Market Analysis and Trends
Financial Services
This slide compares various COVID-19 GDP impact scenarios with an Oxford Economics estimate. It highlights the percent GDP decline, projected 2020 growth, and the expected return to pre-crisis levels across multiple scenarios (A3 to B2).
GDP impact, COVID-19, economic recovery, scenarios, Oxford Economics
false
Market Analysis and Trends
Financial Services financial-services
Mixed Chart
McKinsey
View slide
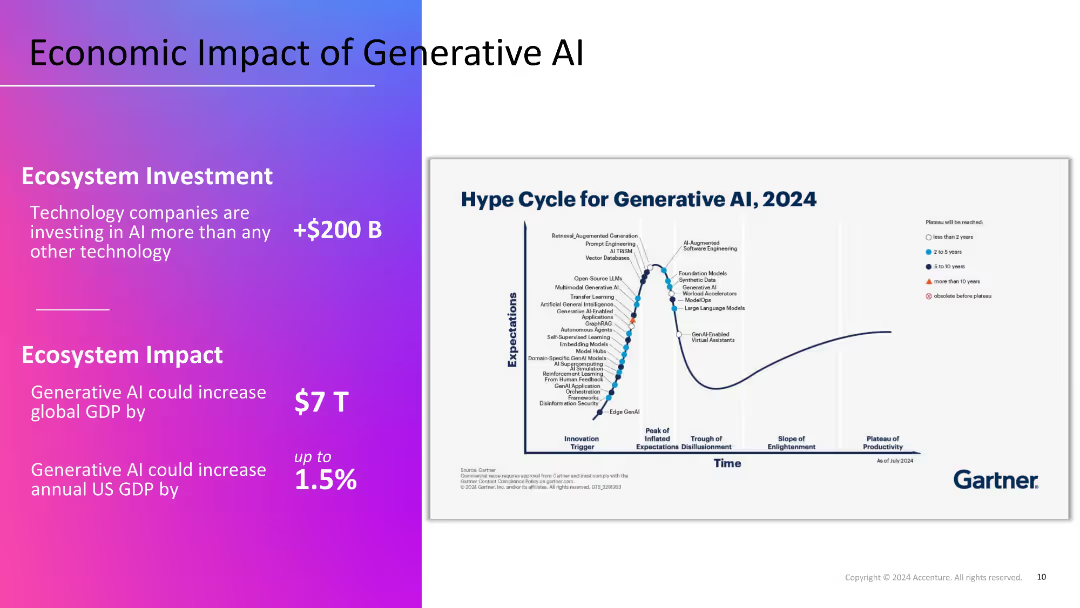
Split layout: left section with gradient background and key economic figures in white text; right section features Gartner's 2024 hype cycle graph on a white background.
Market Analysis and Trends
Artificial Intelligence
Highlights the economic potential of Generative AI, with over $200B in investments and a projected $7T boost to global GDP. The Gartner hype cycle visualizes the maturity of various GenAI technologies, indicating current expectations and future productivity.
GDP impact, investment, hype cycle, GenAI, Gartner, technology trends
false
Market Analysis and Trends
Artificial Intelligence artificial-intelligence
Mixed Chart
Accenture
View slide
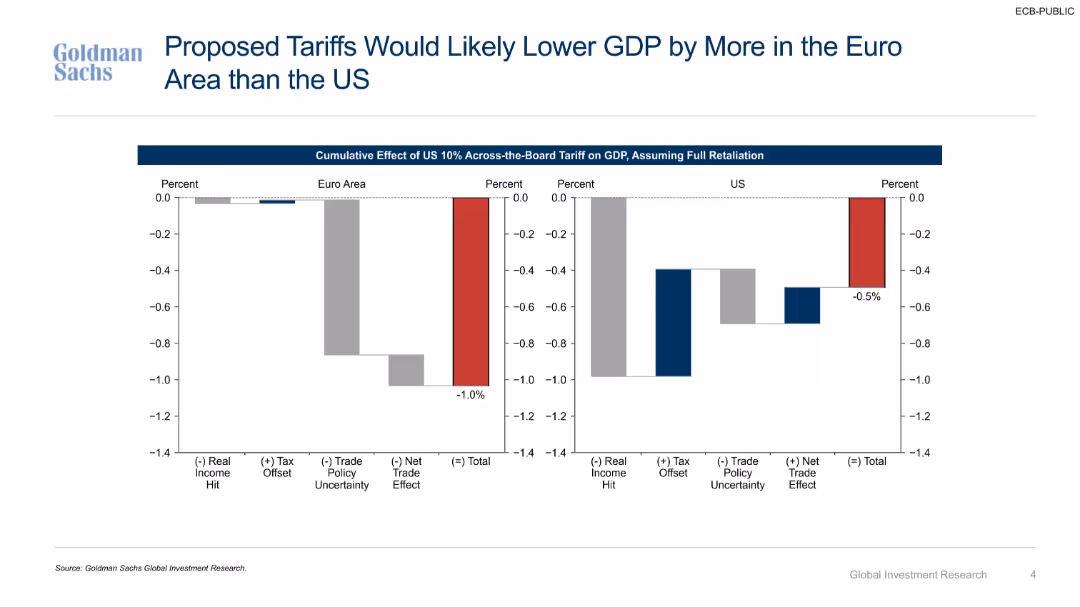
Dual bar charts analyzing GDP reduction from proposed tariffs, segmented by real income, trade, tax offsets.
Market Analysis and Trends
Government & Public Sector
Estimates GDP decline in both Euro Area and U.S. under 10% U.S. tariff scenario with full retaliation. Suggests Euro Area would face deeper contraction driven by trade policy uncertainty and reduced investment.
GDP impact, tariffs, Euro Area, US economy, trade uncertainty, retaliation, macroeconomic forecast, policy effects
false
Market Analysis and Trends
Government & Public Sector government-and-public-sector
Multiple Chart
Goldman Sachs
View slide
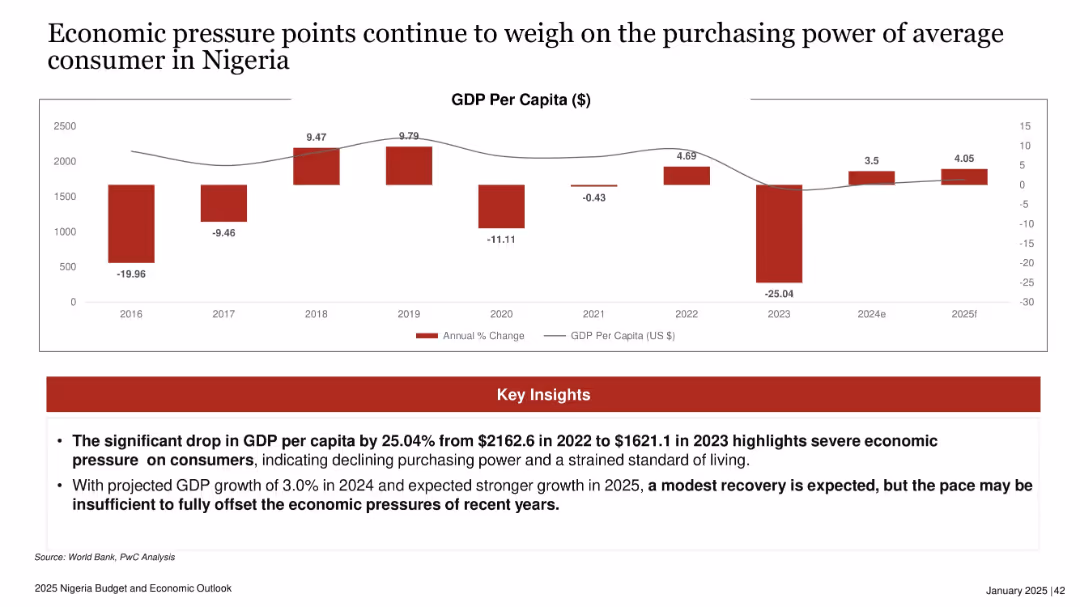
Bar graph of GDP per capita and annual % change from 2016–2025f; insights on drop in red box.
Performance Metrics and KPIs
Financial Services
Shows steep GDP per capita decline in 2023, with only modest projected recovery in 2024–2025. Indicates sustained economic pressure on consumers due to declining purchasing power and weak standard of living recovery.
GDP per capita, Nigeria, consumer pressure, economic downturn, recovery, 2025 forecast, standard of living
false
Performance Metrics and KPIs
Financial Services financial-services
Mixed Chart
PwC/Strategy&
View slide
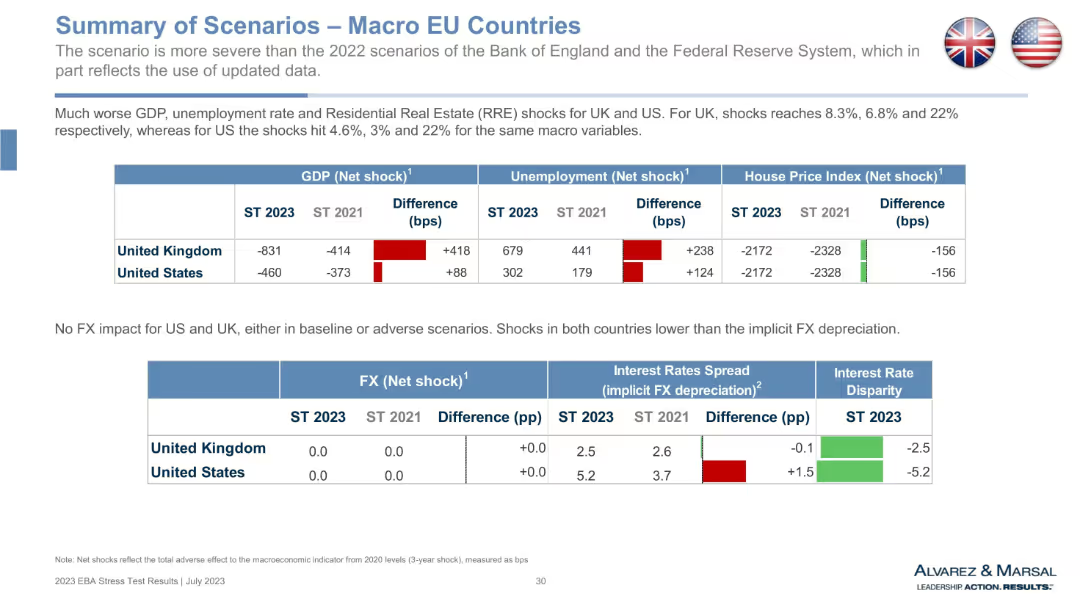
Continuation of macro table for UK and US, with added FX and interest rate spread metrics. Mix of bar graphs and tabular comparisons.
Market Analysis and Trends
Government & Public Sector
This slide presents a comparative macro stress scenario for the UK and US. It shows increased GDP and unemployment shocks in 2023 vs 2021, along with decreased house prices. Additional rows examine FX and interest rate spread impacts, providing a broader view of financial environment changes. Notably, the UK sees worse deterioration than the US under this stress test scenario.
GDP shock, FX spread, UK economy, US economy, macroeconomic comparison, unemployment, house price, interest rates, EBA stress test
false
Market Analysis and Trends
Government & Public Sector government-and-public-sector
Single Chart
Alvarez & Marsal
View slide
This slide includes a line chart showing the GDP distribution among continents from 2015 to 2030, emphasizing the rise of Asia Pacific.
Financial Performance
Professional Services
Highlights the shifting global economic power from North America and Europe to Asia Pacific, projecting future GDP distributions.
GDP, Asia Pacific, economic shift, financial forecasting, global economy
false
Financial Performance
Professional Services professional-services
Multiple Chart
Roland Berger
View slide
Features a line chart with projections of 'FTE Automation Output' against 'Historical FTE' trends, presented in blue and orange lines. The background is a simple gradient.
Financial Performance
Financial Services
Explores the impact of automation on GDP per capita growth, showing projected increases in productivity necessary to meet future GDP growth rates, based on automation scenarios.
GDP, Automation, Productivity, Economic Growth, Forecast
false
Financial Performance
Financial Services financial-services
Single Chart
McKinsey
View slide
Line graph showing historical US GDP changes, with blue shades indicating projected impacts under mild and extreme scenarios. A clear timeline from 1900 to 2020.
Market Analysis and Trends
Financial Services
Illustrates the potential impact of COVID-19 on the US economy by comparing historical GDP data and future projections.
GDP, COVID-19, impact, projections, economy, historical, US, scenarios
false
Market Analysis and Trends
Financial Services financial-services
Single Chart
McKinsey
View slide
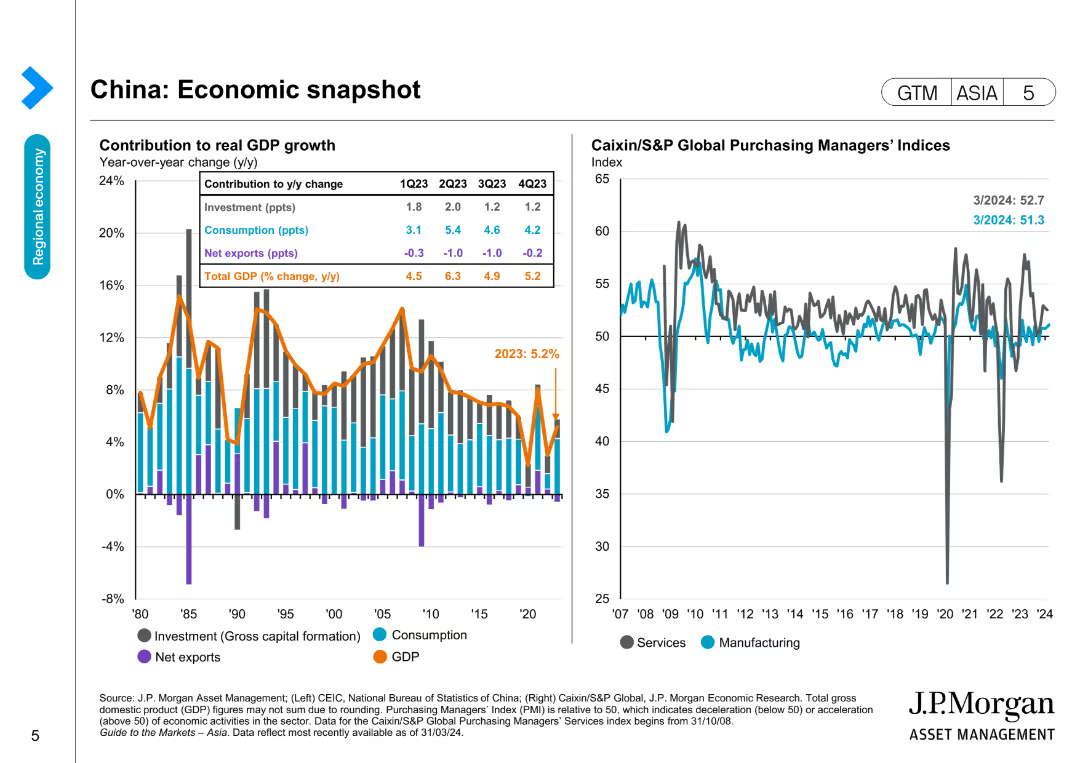
The slide contains a column chart showing GDP growth contributions and a line chart depicting Caixin/S&P Global Purchasing Managers’ Indices for services and manufacturing.
Market Analysis and Trends
Financial Services
It provides an overview of China's economic performance with data on GDP growth contributions and purchasing managers' indices, useful for market trend analysis.
GDP, China, Economic snapshot, Growth, Trends, Manufacturing, Services, Financial data, PMI
false
Market Analysis and Trends
Financial Services financial-services
Multiple Chart
JP Morgan
View slide
This slide presents a column chart showing real GDP contraction over quarters, with colored segments representing different economic sectors. The design is clean with a clear title and a source citation.
Financial Performance
Financial Services
It illustrates economic performance through GDP data, analyzing the contraction in GDP across two quarters and forecasting future trends, serving as a financial performance review.
GDP, Economic Analysis, Financial Reporting, Forecasting, Performance, Contraction, Analysis, Finance, Data
false
Financial Performance
Financial Services financial-services
Single Chart
Citigroup
View slide
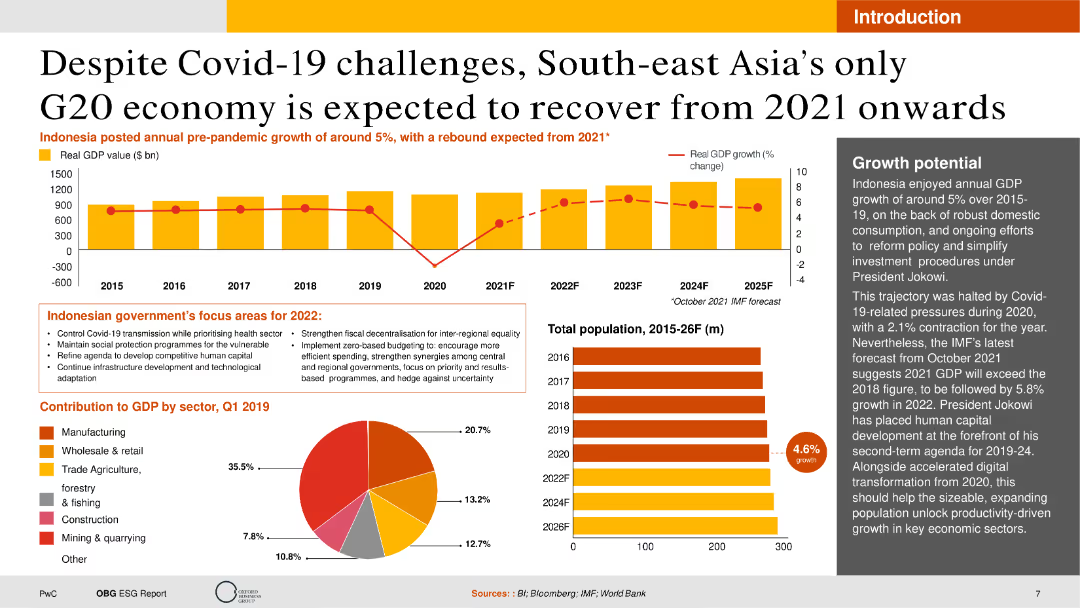
The slide contains a combination of text, a column chart showing GDP growth, and a pie chart detailing sector contributions to GDP. The layout is rich with data and visuals but remains clear and accessible.
Market Analysis and Trends
Financial Services
This slide provides an analysis of Indonesia's economic recovery post-Covid-19, focusing on GDP growth, government policies, and sector contributions. It's useful for understanding market recovery trends and economic forecasts.
GDP, Economic Recovery, Covid-19, Indonesia, Growth
false
Market Analysis and Trends
Financial Services financial-services
Multiple Chart
PwC/Strategy&
View slide
Slide features multiple line graphs comparing GDP growth scenarios for China, USA, Eurozone, and the world. Clean layout with distinct colors for each region.
Market Analysis and Trends
Financial Services
The slide compares projected GDP growth under a scenario where the virus is contained. It's useful for discussions on economic recovery and policy planning.
GDP, Economic growth, Virus, Containment, Forecast
false
Market Analysis and Trends
Financial Services financial-services
Single Chart
McKinsey
View slide
Features an evocative night sky image with a barren tree on the left and two bar charts alongside a line graph on the right discussing GDP growth and global economic outlook.
Strategic Planning
Government & Public Sector
Analyzes the impact of low economic growth on fiscal health, comparing GDP growth rates and economic outlooks of different regions. Suitable for economic forecasts and policy planning discussions.
GDP, Economic, Growth, Outlook, Fiscal
false
Strategic Planning
Government & Public Sector government-and-public-sector
Multiple Chart
PwC/Strategy&
View slide
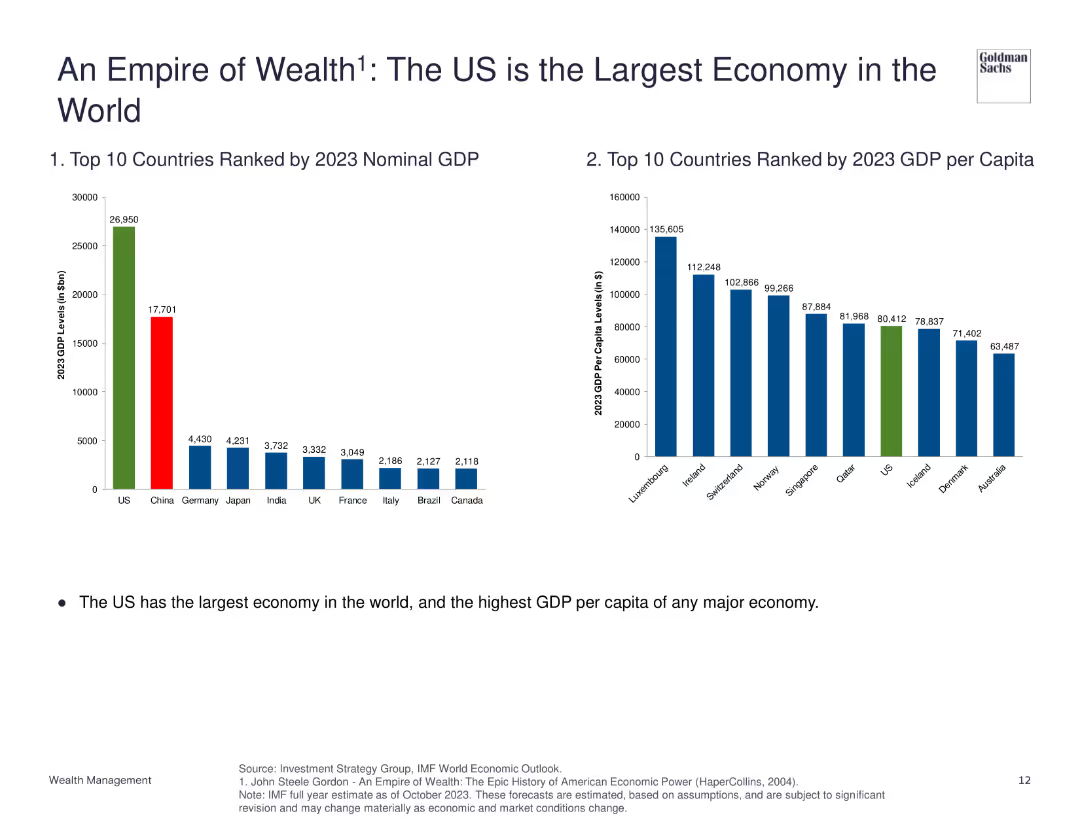
The slide contains two column charts comparing GDP by country and GDP per capita for 2023, emphasizing the US's leading position.
Market Analysis and Trends
Financial Services
The slide highlights the US as the largest economy by GDP and GDP per capita, showing its economic dominance compared to other countries.
GDP, Economy, US, Comparison, Global
false
Market Analysis and Trends
Financial Services financial-services
Multiple Chart
Goldman Sachs
View slide
The slide features six column charts side by side, each representing the real GDP forecast for different regions (United States, Japan, Australia, Eurozone, China) from Q1 2024 to Q4 2025. Each bar in the chart is color-coded by quarter.
Market Analysis and Trends
Financial Services
The slide forecasts quarterly real GDP growth rates for several major economies, useful for assessing global economic trends and making investment decisions based on expected economic performance.
GDP, Forecast, Global, Economy, Growth
false
Market Analysis and Trends
Financial Services financial-services
Multiple Chart
JP Morgan
View slide
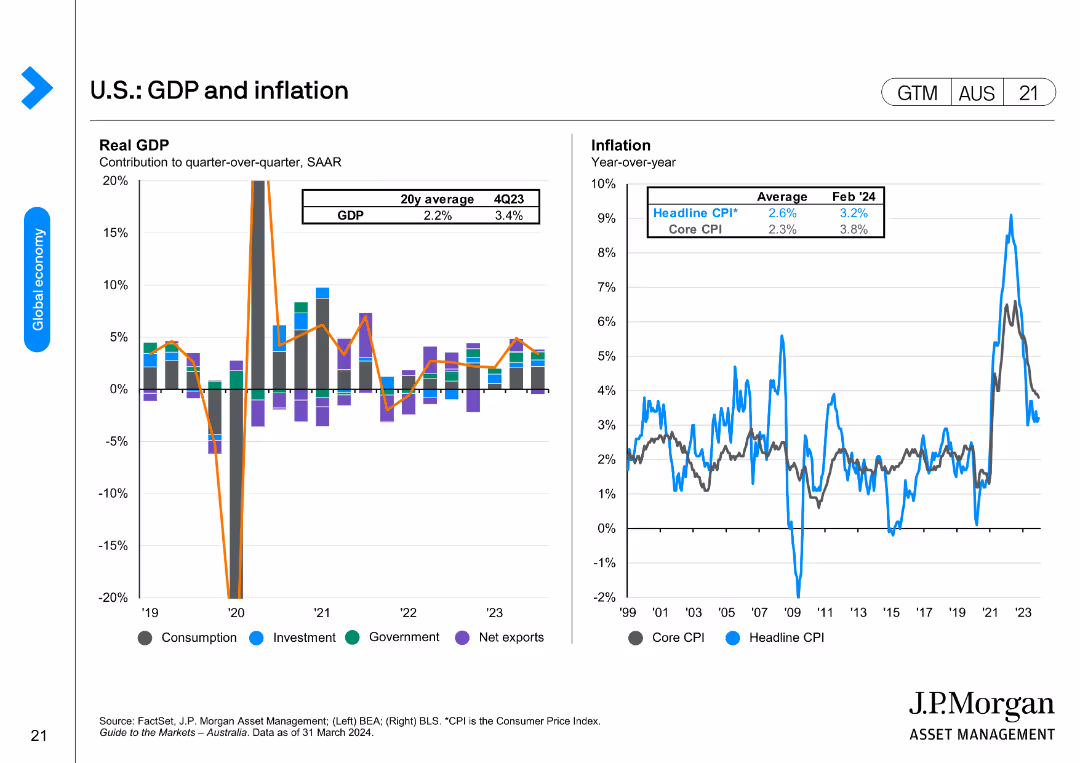
The slide includes two main visual elements: a column chart on the left showing U.S. real GDP contributions by component (consumption, investment, government, net exports) from Q1 2019 to Q4 2023, and a line chart on the right depicting headline and core CPI from 1999 to 2024.
Financial Performance
Financial Services
This slide provides a detailed overview of U.S. economic performance by showing GDP contributions and inflation rates, helping to analyze economic growth and price stability.
GDP, Inflation, U.S., Economy, Growth
false
Financial Performance
Financial Services financial-services
Multiple Chart
JP Morgan
Previous
Loading...
Hold On!
We are searching in our database
If nothing, comes up, please try different filters!
Column Chart
Heatmap
Chevron
Org Chart
Infographic
Callouts
Timeline
List
Graphic
Picture
Process Flow
Diagram
Paragraph
Map
Table
Framework
Subtitle
Takeaway Box
Icon
Other Chart
Radar Chart
Waterfall Chart
Mekko Chart
Pie Chart
Scatter Plot
Line Chart
Bar chart
Bullet points
Create a FREE account to continue browsing
Receive Instant Access to 1,000+ slides from companies like McKinsey, Google, and Goldman Sachs
First Name
Last Name
Email
Password
I agree to all
Terms & Privacy Policy
Thank you! Your submission has been received!
Oops! Something went wrong while submitting the form.
Have an account?
Sign in
Upgrade to PRO to Save slides
Advanced Search and Filters
Access to 15,000+ slides
Access to Category Pages
Save/Bookmark Slides
PowerPoint Template Library
Pick a Plan
MONTHLY
$12/month
Billed every month, Cancel anytime.
YEARLY
$9/year
Billed $108 annually, Cancel anytime.
Checkout for $12/month
Checkout for $108/yr
Secured by Stripe | AES-256 bit encryption