My Account
My Slides
Search by Category
Templates
Leave Feedback
Login
Logout
Get Started
Browse all Slides
Browse all Slides
Create a FREE Account
Instant access to 1,000+ real slides from top companies like McKinsey, BCG, Goldman Sachs, Google and many more!
First Name
Last Name
Email
Password
I agree to all
Terms & Privacy Policy
Thank you! Your submission has been received!
Oops! Something went wrong while submitting the form.
Have an account?
Sign in
📢 Ready to start building slides? Check out our new template library
VIEW TEMPLATES
Welcome,
Welcome
PRO
Show Featured Only
Checkbox 8
Companies
Mckinsey
Bain
BCG
EY
Deloitte
Accenture
PwC/Strategy&
JP Morgan
Goldman Sachs
Morgan Stanley
Citigroup
Deutsche Bank
Barclays
LEK
KPMG
Kearney
Oliver Wyman
Booz Allen Hamilton
Gartner
IPSOS
Nielsen
Slide type
Text Only
Linear Flow
Vertical Flow
Single Chart
Header Horizontal
Mixed Chart
Header Vertical
Pillar
Multiple Chart
Graphic
Agenda
Title
Table
Framework
Industry
Technology & Software
Artificial Intelligence
Financial Services
Retail & E-commerce
Consumer Goods
Industrial & Manufacturing
Transportation & Logistics
Telecommunications
Real Estate & Construction
Hospitality & Tourism
Professional Services
Education & Training
Media & Entertainment
Agriculture & Food Production
Healthcare & Pharmaceuticals
Environmental Services & Sustainability
Government & Public Sector
Use Case
Mergers and Acquisitions
Performance Metrics and KPIs
Client Case Studies
Competitive Landscape
Corporate Finance and Valuation
Product and Service Analysis
Customer and Market Segmentation
Organizational Structure and Change
Industry Overview
Regulatory and Compliance
Risk Assessment and Management
Investment Analysis
Organizational Structure and Change
Human Resources and Talent Management
Financial Performance
Market Analysis and Trends
Sales and Business Development
Human Resources and Talent Management
Clear all
Thank you! Your submission has been received!
Oops! Something went wrong while submitting the form.
Tag
View slide
The slide features a title with a prominent image of a scenic landscape and a number "1". It includes a column chart depicting GVA growth in UK regions.
Market Analysis and Trends
Government & Public Sector
The slide discusses UK and regional economic performance in 2022, highlighting GVA growth in various regions and sectors with comparative analysis.
GVA, economic growth, UK regions, 2022, column chart
false
Market Analysis and Trends
Government & Public Sector government-and-public-sector
Mixed Chart
EY
View slide
A combination of text, charts, and graphics, this slide presents data with a balance between visuals and written content. It includes a pie chart, a bar graph, and numerical highlights in callout boxes. The color scheme is consistent with the presentation theme.
Financial Performance
Industrial & Manufacturing
Details the estimated GVA and employment contributions of the Tempest programme to the UK economy from 2021 to 2050, with specific metrics and projections.
GVA, employment, Tempest, projections, UK economy, indirect contribution, induced contribution
false
Financial Performance
Industrial & Manufacturing industrial-and-manufacturing
Mixed Chart
PwC/Strategy&
View slide
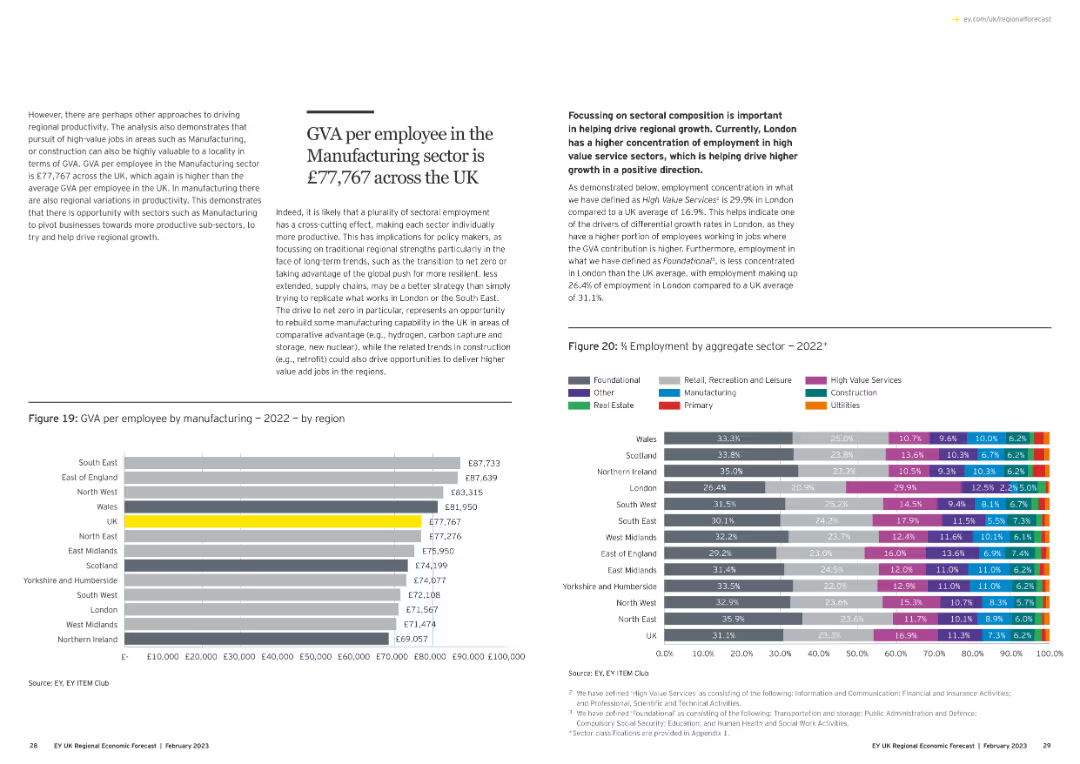
The slide has a text box on the left explaining GVA in manufacturing. On the right, there are two charts: a column chart showing GVA per employee by region and a stacked bar chart showing employment by aggregate sector.
Operational Efficiency
Industrial & Manufacturing
This slide explains the GVA per employee in the UK manufacturing sector and compares it across various regions and sectors, highlighting the importance of sectoral composition in regional economic growth.
GVA, manufacturing, regional comparison, sectoral composition, employment
false
Operational Efficiency
Industrial & Manufacturing industrial-and-manufacturing
Multiple Chart
EY
View slide
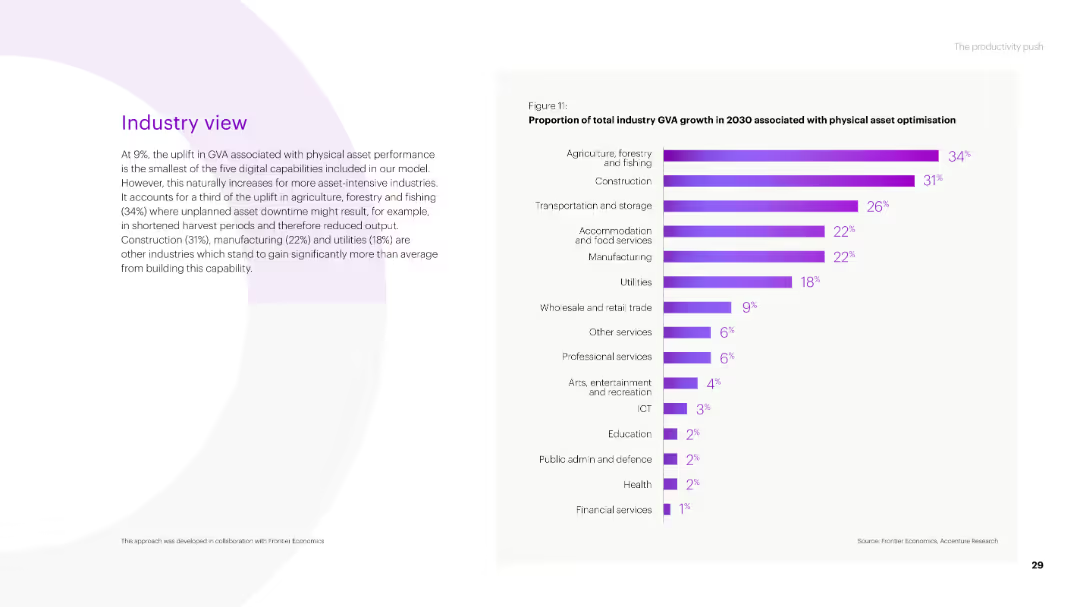
The slide features a column chart on the right side showing the proportion of total industry GVA growth by 2030 associated with physical asset optimization.
Market Analysis and Trends
Agriculture & Food Production
The slide discusses the impact of physical asset performance on GVA growth across various industries, highlighting agriculture, forestry, and fishing as having the highest uplift.
GVA, physical asset, growth, agriculture, forestry, fishing, construction, manufacturing, utilities, industry
false
Market Analysis and Trends
Agriculture & Food Production agriculture-and-food-production
Mixed Chart
Accenture
View slide
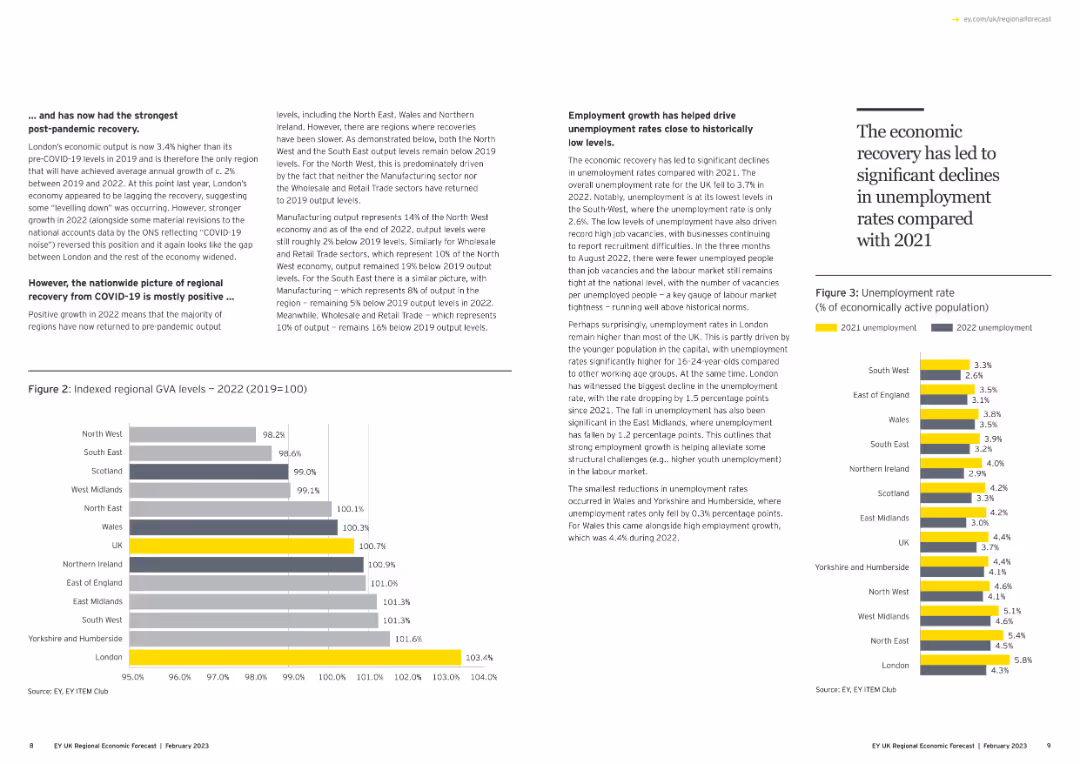
Contains a column chart showing indexed regional GVA levels and another column chart showing unemployment rates. Text discusses economic recovery trends.
Market Analysis and Trends
Government & Public Sector
Analyzes regional GVA levels post-COVID-19 and the employment growth that has helped drive down unemployment rates to historically low levels.
GVA, unemployment, economic recovery, regional analysis, column chart
false
Market Analysis and Trends
Government & Public Sector government-and-public-sector
Multiple Chart
EY
View slide
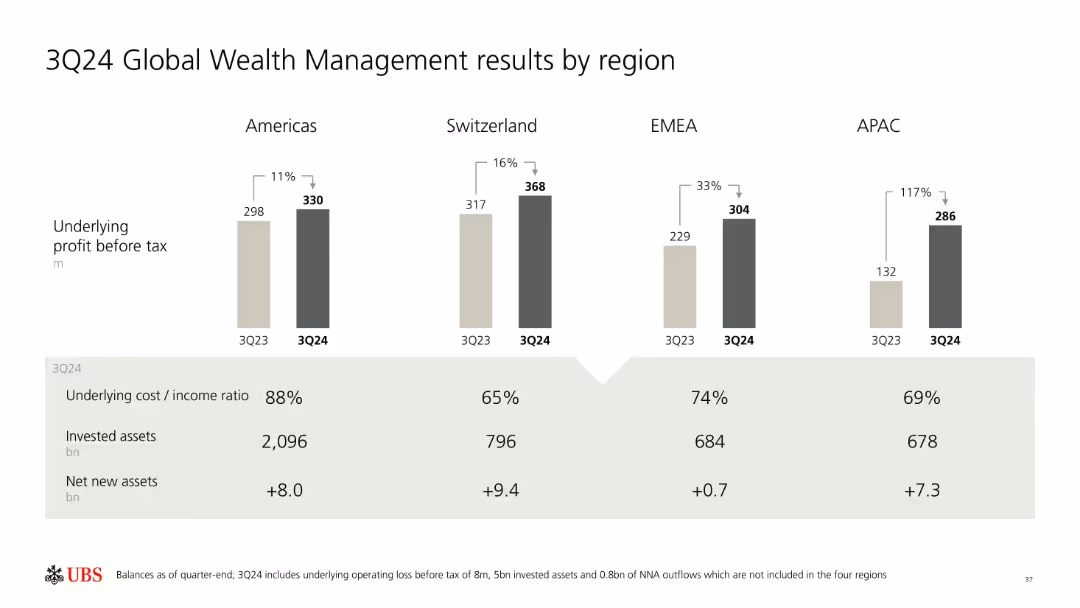
Bar chart showing YoY profit change across regions; summary table below with cost/income ratios and net new/invested assets.
Performance Metrics and KPIs
Financial Services
UBS presents its Global Wealth Management performance by region for 3Q24. Regional profits, cost/income ratios, invested assets, and net new assets are compared to 3Q23, highlighting notable growth in APAC and Switzerland.
GWM, profit before tax, UBS, net new assets, APAC, EMEA, Switzerland, Americas, regional performance
false
Performance Metrics and KPIs
Financial Services financial-services
Mixed Chart
UBS
View slide
The slide features two column charts showing the percentages of participants who experienced gains or losses from crypto assets and crypto investment funds.
Financial Performance
Financial Services
This slide provides insights into the financial outcomes (gains or losses) for participants holding crypto assets and investment funds.
Gains, losses, crypto assets, investment funds, financial outcomes
false
Financial Performance
Financial Services financial-services
Multiple Chart
IPSOS
View slide
A two-section slide with a medium level of detail. The top half categorizes industries using Web3 with icons and brief descriptions, while the bottom half lists details for each industry with icons, all against a blue background.
Market Analysis and Trends
Technology & Software
Highlights industries like media, retail, and financial services that are beginning to adopt Web3 technologies. It outlines how each sector is leveraging these innovations for gaming, digital art, retail experiences, and decentralized finance.
Gaming, Retail, DeFi, Digital Art, Innovation
false
Market Analysis and Trends
Technology & Software technology-and-software
Header Horizontal
McKinsey
View slide
The slide includes a Gartner Emerging Technologies Hype Cycle graph, showing various technologies at different stages of maturity and adoption. Key points about the technologies’ current state and future potential are noted on the right side.
Strategic Planning
Technology & Software
The slide uses the Gartner Hype Cycle to illustrate the current and projected adoption stages of various emerging technologies, stressing the timely importance of blockchain development amidst fluctuating market perceptions.
Gartner Hype Cycle, technology adoption, blockchain, market trends, strategic timing
false
Strategic Planning
Technology & Software technology-and-software
Mixed Chart
EY
View slide
The slide contains two line charts showing the growth of contract value and free cash flow over the years, with key data points marked from 2013 to 2023.
Financial Performance
Professional Services
It presents Gartner’s historical financial performance, highlighting the consistent growth in contract value and free cash flow over a decade, indicating robust performance.
Gartner, financial performance, contract value, free cash flow, growth, historical performance
false
Financial Performance
Professional Services professional-services
Multiple Chart
Gartner
View slide
Slide with three pie charts showing 2024 revenue guidance by segment, 2023 gross margin mix, and 2023 revenue by geography.
Financial Performance
Professional Services
This slide breaks down Gartner's financial performance, presenting revenue guidance, gross margin mix, and revenue distribution by geography.
Gartner, financial performance, revenue guidance, gross margin, geography
false
Financial Performance
Professional Services professional-services
Multiple Chart
Gartner
View slide
The slide presents a timeline of Gartner's company history and strategic acquisitions, highlighting key milestones and market opportunities from 1979 to 2024 & beyond.
Strategic Planning
Professional Services
It outlines Gartner's history of organic growth and strategic acquisitions, showing significant milestones and market opportunities that have driven their expansion.
Gartner, growth, strategic acquisitions, timeline, market opportunities
false
Strategic Planning
Professional Services professional-services
Linear Flow
Gartner
View slide
The slide has three sections detailing growth, margin expansion, and free cash flow, with icons and bullet points highlighting key financial metrics and strategies.
Investment Analysis
Financial Services
It explains why investors value Gartner, focusing on growth, margin expansion, and free cash flow as key financial performance indicators and investment attractions.
Gartner, investors, growth, margin expansion, free cash flow, financial performance
false
Investment Analysis
Financial Services financial-services
Pillar
Gartner
View slide
The slide features two line charts showing quarterly revenue and contribution margin trends. Text explains Gartner's research services for executives and their teams.
Industry Overview
Professional Services
It provides an overview of Gartner's research services, highlighting ongoing access to research, on-demand response, and support for major enterprise functions.
Gartner, research, revenue, contribution margin, executives, services, trends
false
Industry Overview
Professional Services professional-services
Multiple Chart
Gartner
View slide
The slide contains a donut chart showing the subscription mix of Gartner's research revenue. The chart highlights that 92% of revenue is subscription-based.
Financial Performance
Professional Services
It highlights the dominance of subscription revenue in Gartner’s research segment, indicating a stable and recurring revenue model.
Gartner, research, subscription, revenue, recurring, financial performance, model
false
Financial Performance
Professional Services professional-services
Single Chart
Gartner
View slide
Two column charts displaying Henry Hub and UK NBP gas price estimates. The charts show bank/broker and consultant ranges from 2020 to 2024.
Market Analysis and Trends
Energy & Utilities
This slide presents higher gas price forecasts for Henry Hub compared to UK NBP. Consultant ranges suggest prices based on sustainable development scenarios.
Gas, price, forecast, Henry Hub, UK NBP, bank, broker, consultant, estimate, range
false
Market Analysis and Trends
Energy & Utilities energy-and-utilities
Multiple Chart
EY
View slide
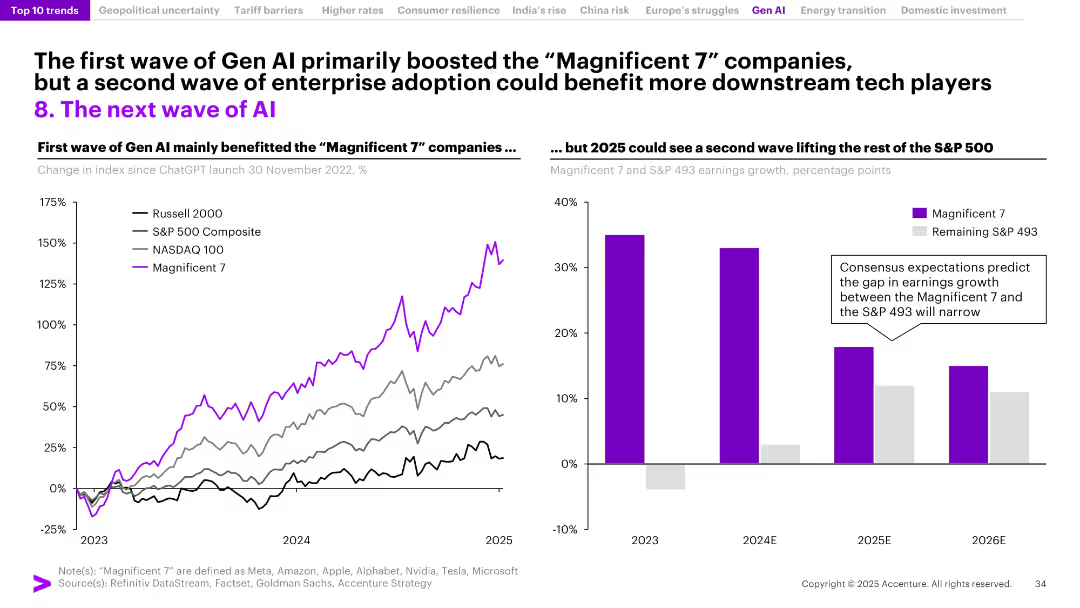
Two-part layout: left graph of index growth post-Gen AI launch; right bar chart comparing Magnificent 7 vs. S&P 493 earnings growth.
Technology and Digital Transformation
Artificial Intelligence
This slide contrasts the Gen AI-driven boom of the Magnificent 7 stocks with forecasts for broader adoption. It suggests that while early gains were concentrated in tech giants, enterprise AI adoption in 2025 may distribute benefits more evenly across the S&P 500.
Gen AI, Magnificent 7, S&P 500, earnings growth, stock indices, enterprise AI, adoption wave, technology sector, market trends
false
Technology and Digital Transformation
Artificial Intelligence artificial-intelligence
Multiple Chart
Accenture
View slide
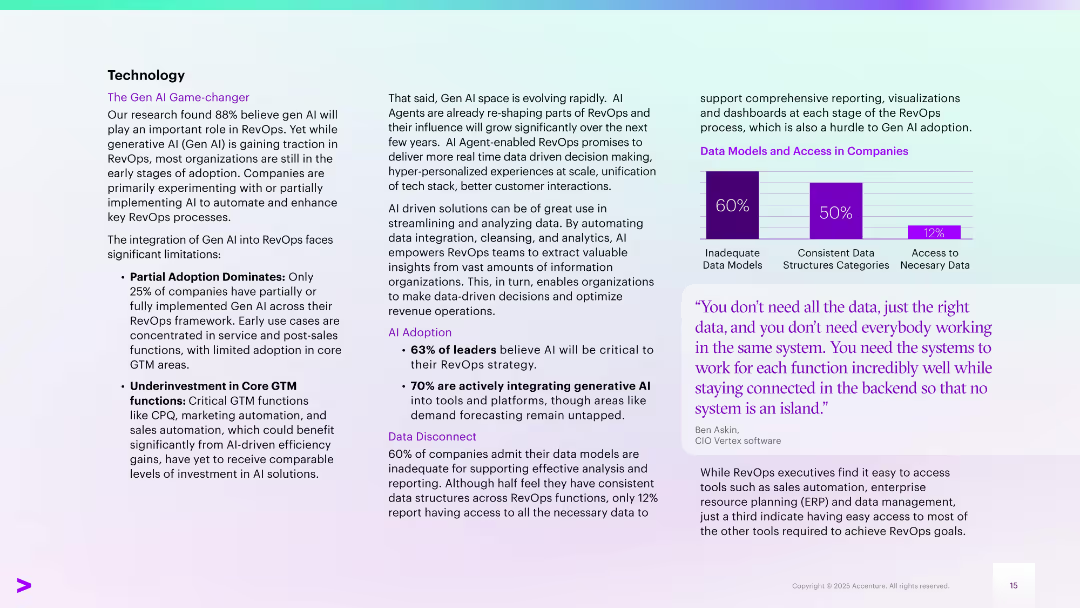
Two-column layout with bullet points on the left and highlighted stats and charts on the right. Includes a purple bar chart and a quote box. Uses purple and teal gradients.
Technology and Digital Transformation
Technology & Software
Discusses Gen AI adoption in RevOps, noting early-stage use, limited adoption in core GTM areas, and investment gaps. Highlights the growing role of AI agents and data integration issues. Features statistics on AI adoption and access to data, with a quote emphasizing the importance of system integration.
Gen AI, RevOps, automation, data models, AI adoption, GTM, integration
false
Technology and Digital Transformation
Technology & Software technology-and-software
Mixed Chart
Accenture
View slide
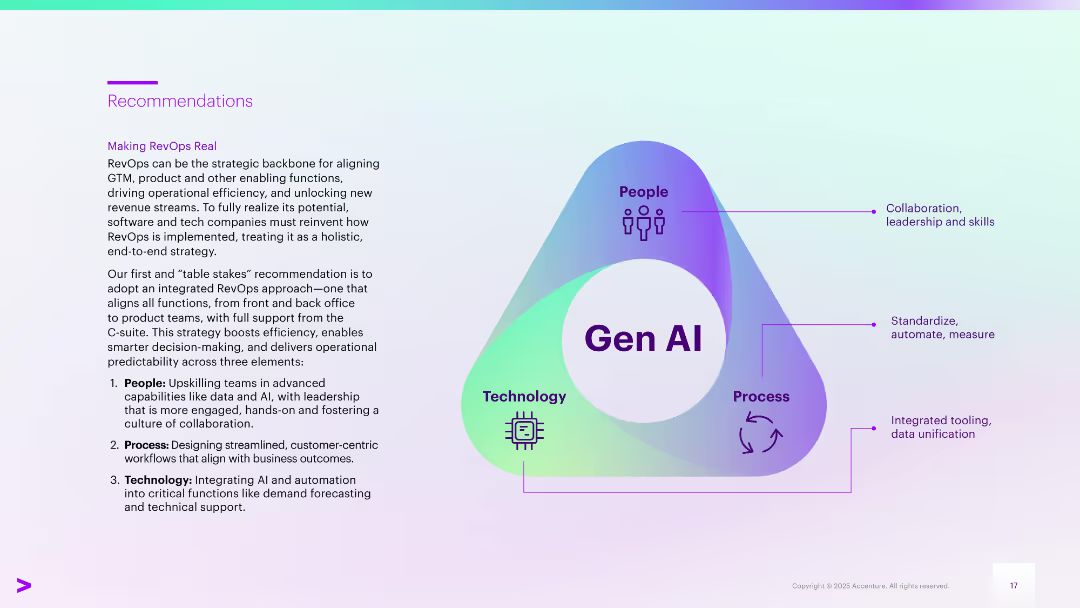
Left-aligned text next to a triangular infographic labeled “Gen AI” at the center, connecting People, Process, and Technology. Each point includes a brief description. Gradient background with purple and teal.
Strategic Planning
Technology & Software
Recommends a holistic, end-to-end RevOps approach leveraging Gen AI. Emphasizes integrating people (skills and leadership), process (workflow design), and technology (AI for automation and forecasting). Aims to enhance decision-making, efficiency, and alignment across business functions.
Gen AI, RevOps, strategic planning, collaboration, automation, upskilling
false
Strategic Planning
Technology & Software technology-and-software
Framework
Accenture
View slide
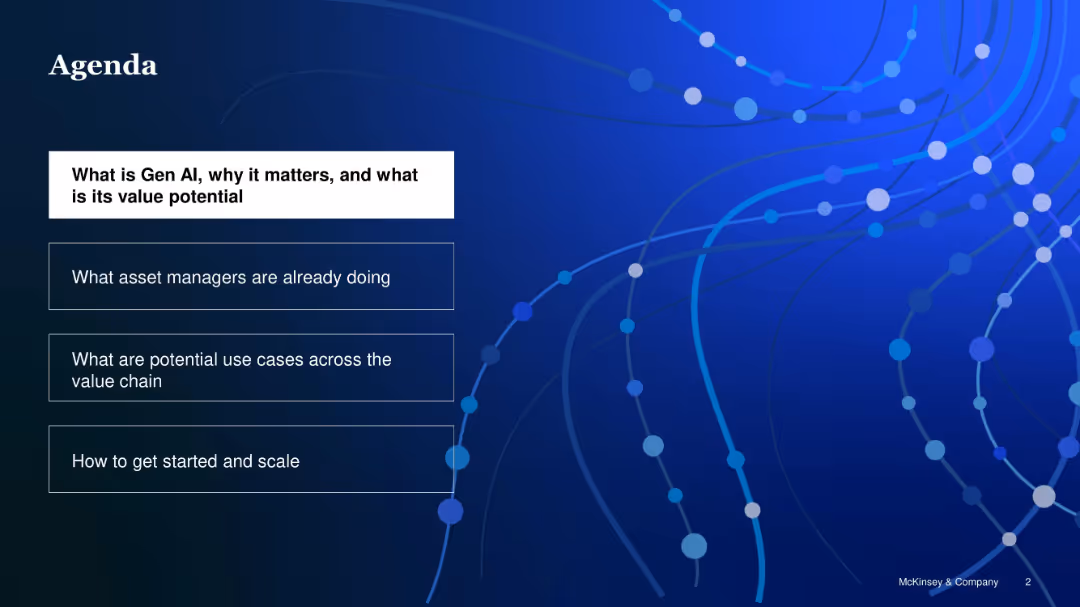
Dark blue slide with white and blue text boxes stacked vertically, highlighting key agenda items
Strategic Planning
Artificial Intelligence
The agenda outlines the structure of the presentation: understanding Gen AI, examining asset manager practices, exploring use cases across the value chain, and guidance on implementation and scaling.
Gen AI, agenda, value chain, asset managers, implementation, scaling
false
Strategic Planning
Artificial Intelligence artificial-intelligence
Agenda
McKinsey
View slide
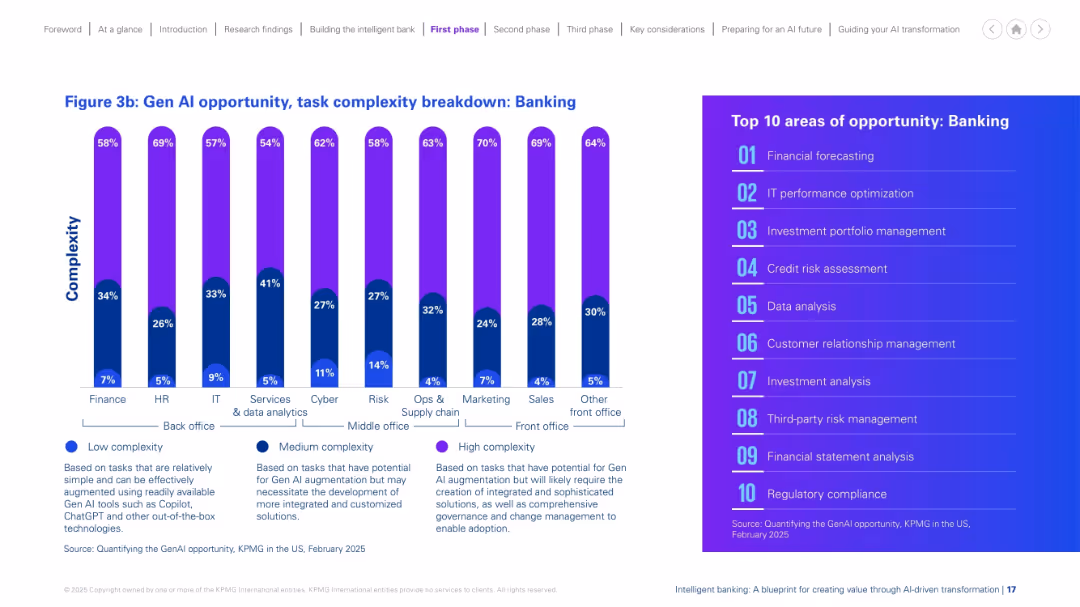
Vertical bar graph showing complexity levels across functions, categorized into low, medium, and high. Bright gradient colors and bold text, paired with a top 10 list on the right.
Market Analysis and Trends
Financial Services
The slide breaks down Gen AI task complexity across banking functions, categorizing tasks as low, medium, or high complexity. Finance, IT, and HR functions show varying levels of potential for augmentation. It also lists the top 10 AI opportunity areas, including forecasting, IT optimization, and risk assessment, highlighting where AI can add the most value.
Gen AI, complexity, functions, opportunity, forecasting, optimization, analysis
false
Market Analysis and Trends
Financial Services financial-services
Mixed Chart
KPMG
View slide
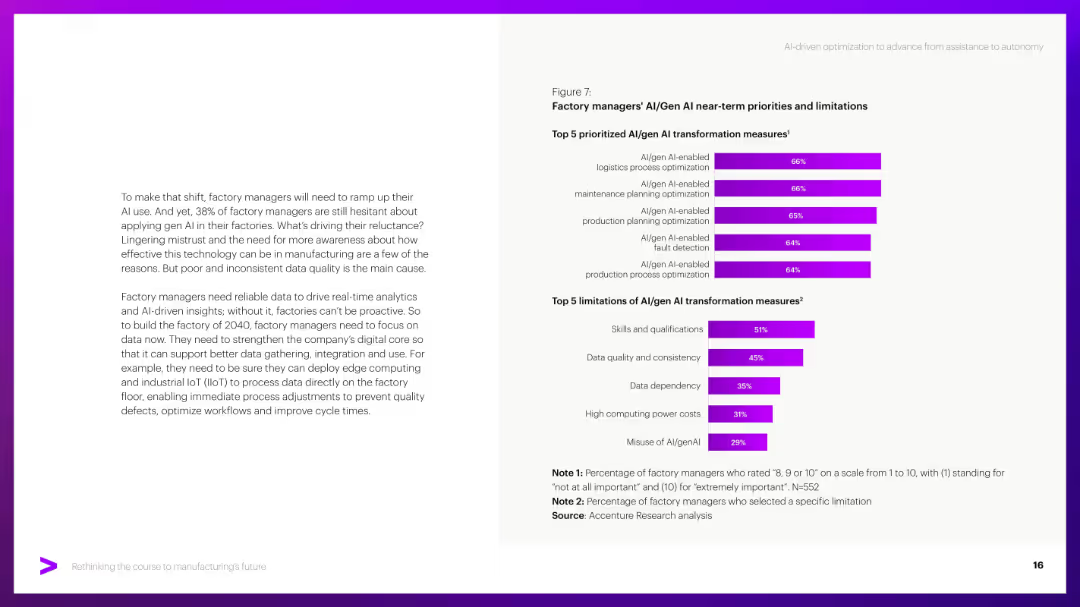
Similar layout to 15913; paragraph left, bar charts right. Focus on AI/Gen AI aspects.
Technology and Digital Transformation
Industrial & Manufacturing
Explores AI/Gen AI transformation priorities like logistics and maintenance optimization. Addresses challenges like data quality, skill gaps, and computing costs based on manager feedback.
Gen AI, factory AI, data quality, AI limitations, transformation
false
Technology and Digital Transformation
Industrial & Manufacturing industrial-and-manufacturing
Mixed Chart
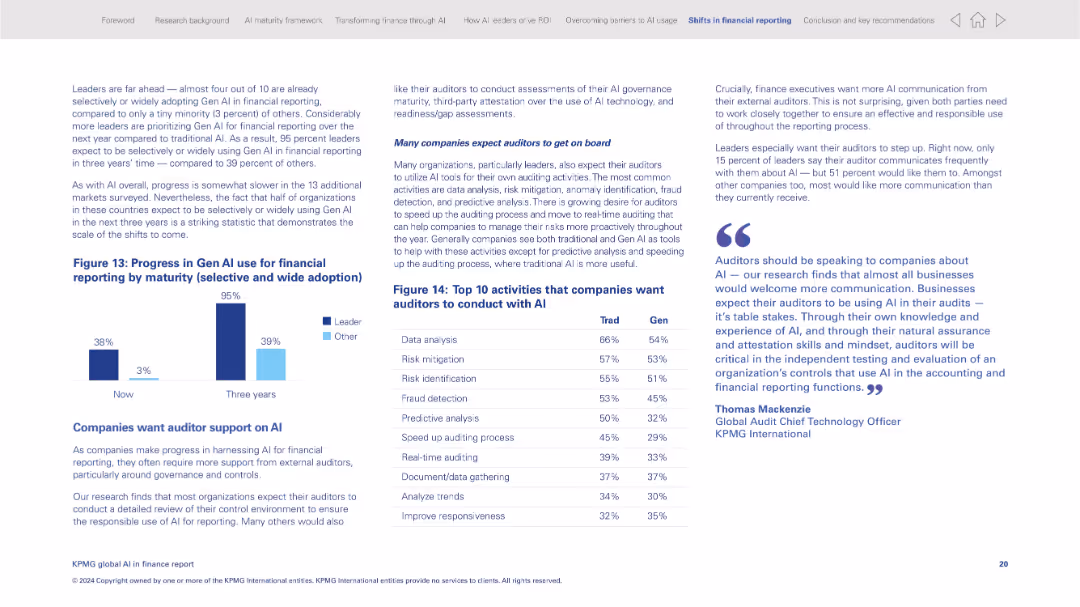
Accenture
View slide
Twin bar graphs comparing adoption by leader vs. others; data table of top auditor activities with AI
Regulatory and Compliance
Financial Services
The slide explores how Gen AI is being adopted in financial reporting by maturity level, with leaders far ahead. It lists activities companies want auditors to conduct with AI tools, showing the intersection of AI and auditing practices.
Gen AI, financial reporting, auditors, regulatory compliance, AI adoption, maturity, AI tools
false
Regulatory and Compliance
Financial Services financial-services
Mixed Chart
KPMG
View slide
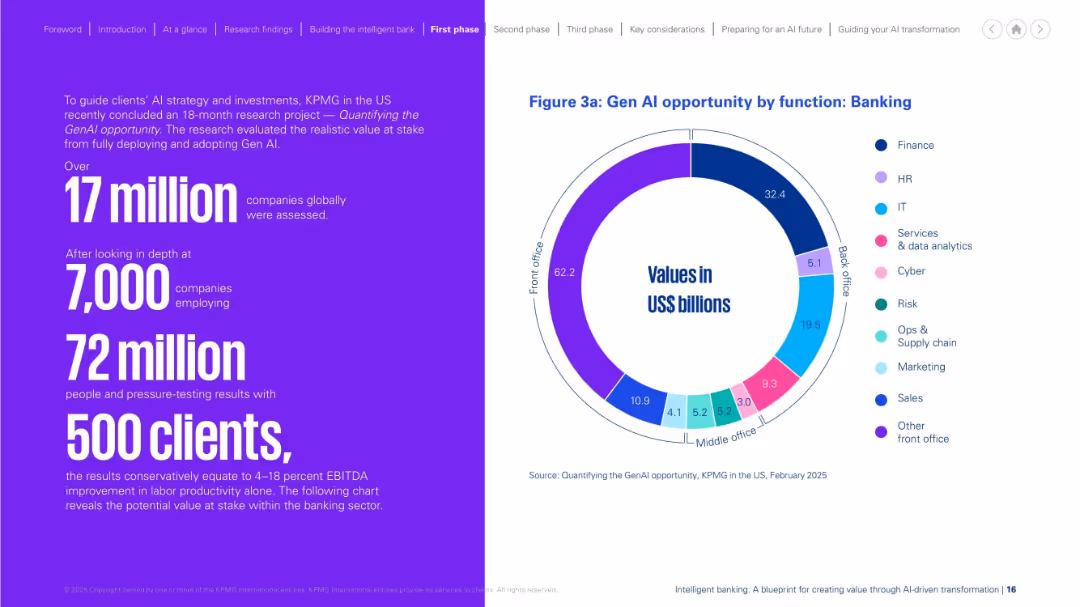
Left side presents research stats in large purple text. Right side includes a colorful circular chart showing value breakdown by banking functions. Neat bifurcation, vibrant colors.
Investment Analysis
Financial Services
This slide quantifies the opportunity of Gen AI in banking, based on KPMG research. It highlights potential value by function, with front-office roles offering the largest gains. The stats support significant productivity and financial impact, derived from analyzing over 17 million companies and thousands of clients globally.
Gen AI, opportunity, banking, productivity, front office, research, KPMG
false
Investment Analysis
Financial Services financial-services
Mixed Chart
KPMG
View slide
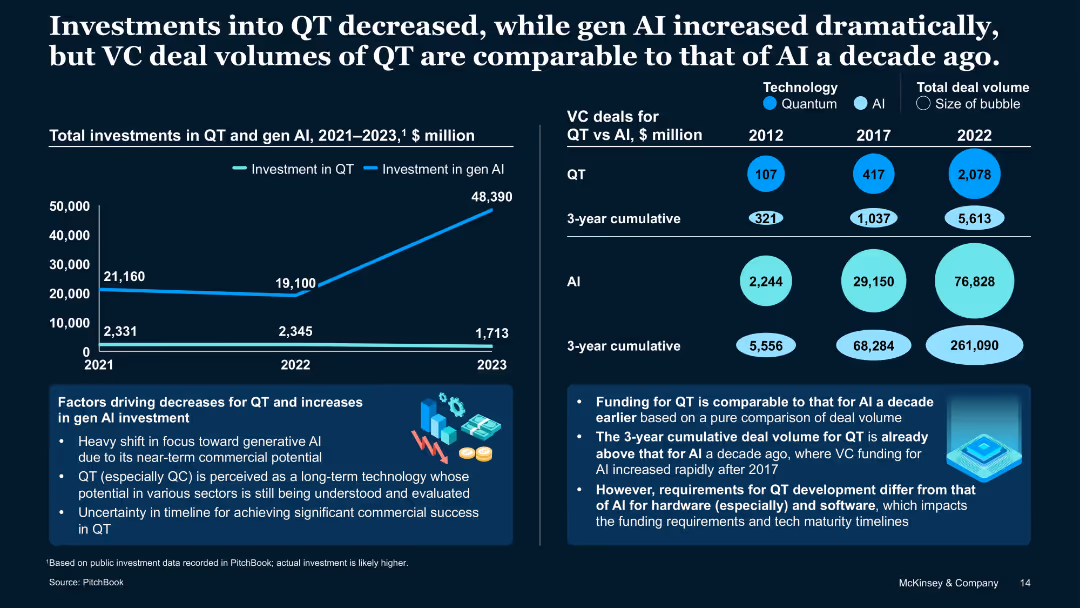
Dual-axis line and bubble charts with infographics and supporting analysis
Strategic Planning
Artificial Intelligence
Contrasts declining QT investment with surging Gen AI investment, highlighting a shift in investor focus. Shows QT VC deal volume today is similar to AI a decade ago. Notes differences in funding patterns due to maturity and hardware/software needs.
Gen AI, venture capital, QT deal volume, investment trend, deal history
false
Strategic Planning
Artificial Intelligence artificial-intelligence
Single Chart
McKinsey
View slide
The slide includes several data representations, such as bar graphs displaying top industry focus and a line chart depicting trend evolution. It also features a list of concepts and tags.
Market Analysis and Trends
Professional Services
Focuses on the intersection of economic trends with generational impact, highlighting how social values and corporate governance are influencing industry trends.
Gen X, Millennials, Government, Financial, Nonprofit, ESG, Climate, Conservatives
false
Market Analysis and Trends
Professional Services professional-services
Multiple Chart
Bain
View slide
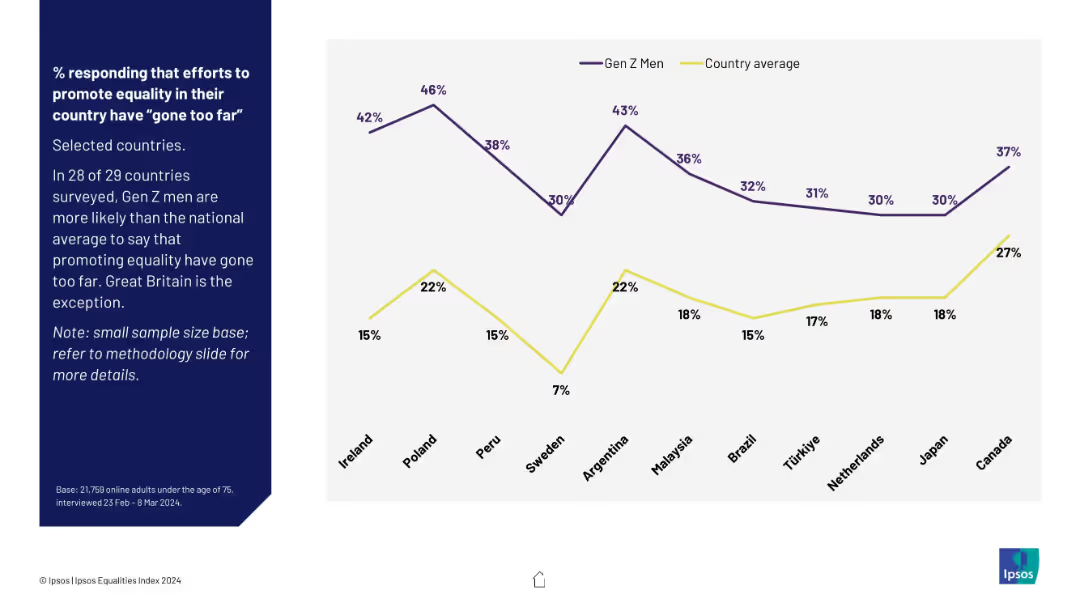
Line graph comparing Gen Z men to national average across selected countries; purple and yellow lines; note on sample size.
Regulatory and Compliance
Government & Public Sector
This slide spotlights Gen Z men across countries, showing their likelihood to say equality efforts have gone too far. In 28 of 29 countries, Gen Z men surpass national averages—Great Britain is the exception.
Gen Z men, backlash, equality efforts, country comparison, Ipsos, public perception, overreach concern
false
Regulatory and Compliance
Government & Public Sector government-and-public-sector
Mixed Chart
IPSOS
View slide
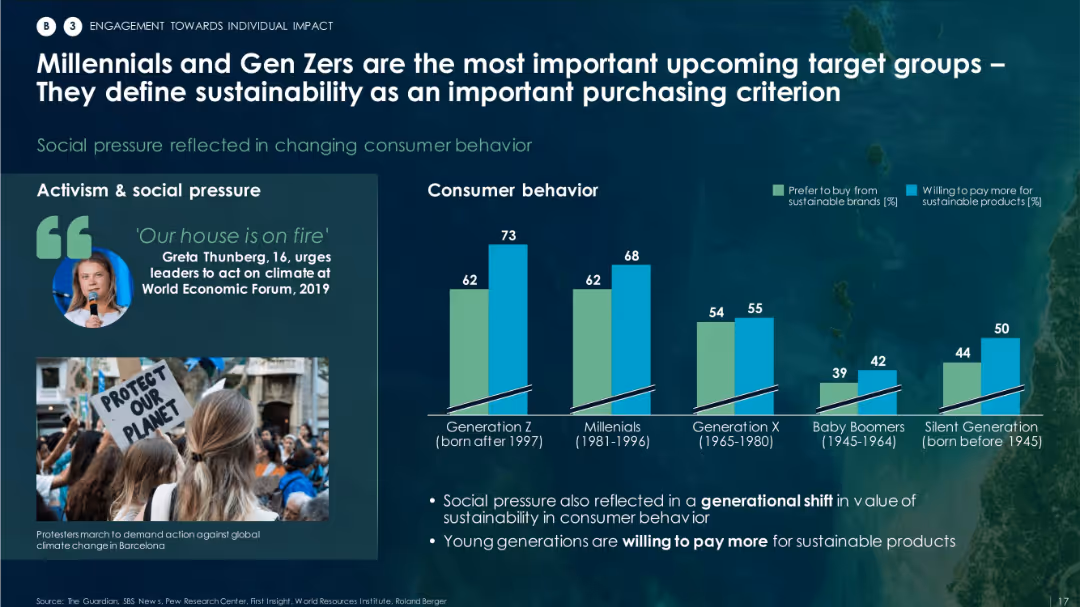
Mixed layout with an image on the left and bar graph on the right showing consumer behavior by generation.
Customer and Market Segmentation
Environmental Services & Sustainability
Focuses on how younger generations (Gen Z and Millennials) are more likely to prefer and pay more for sustainable brands. It also touches on social pressure and changing consumer behavior regarding sustainability.
Gen Z, Millennials, sustainable brands, social pressure, consumer behavior, ESG preferences
false
Customer and Market Segmentation
Environmental Services & Sustainability environmental-services-and-sustainability
Mixed Chart
Roland Berger
View slide
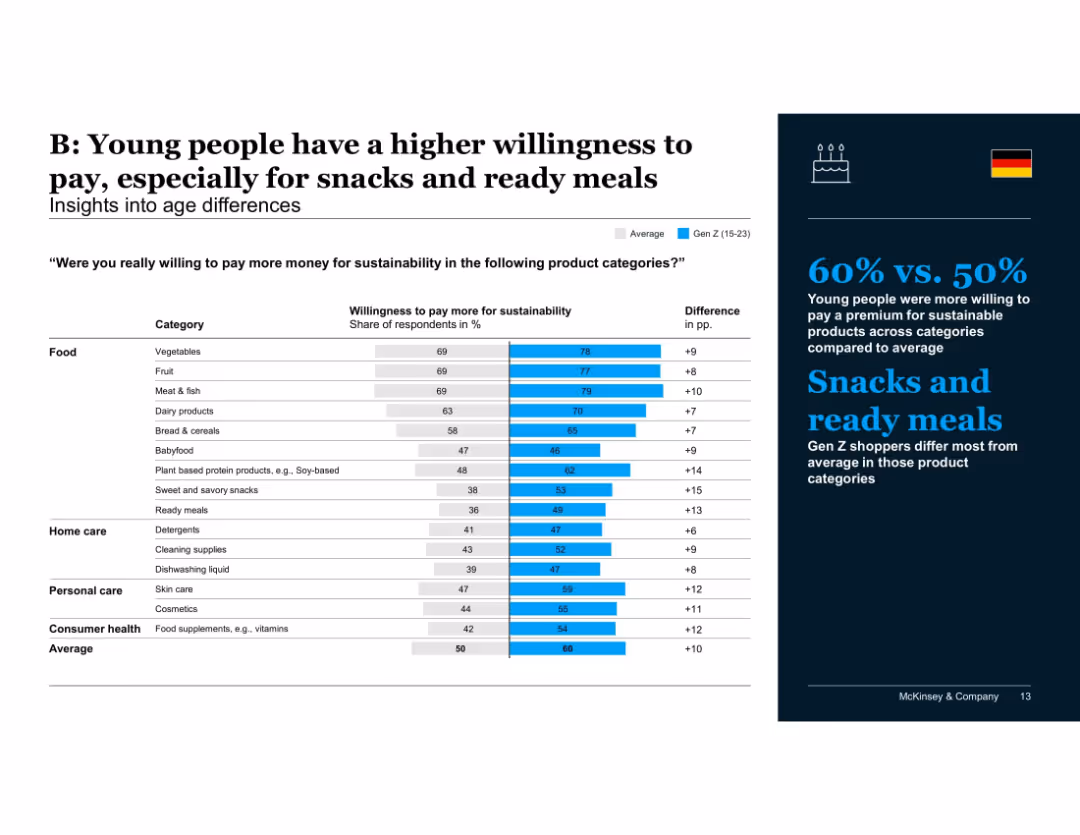
Bar chart showing Gen Z vs. average willingness to pay across various product categories; differences labeled
Customer and Market Segmentation
Consumer Goods
Gen Z consumers are more likely to pay more for sustainability, especially for snacks, ready meals, and soy-based products. Their higher values across nearly all categories highlight a generational shift in sustainable consumption habits.
Gen Z, age differences, willingness to pay, snacks, ready meals, consumer behavior, sustainability, product categories, McKinsey
false
Customer and Market Segmentation
Consumer Goods consumer-goods
Mixed Chart
McKinsey
View slide
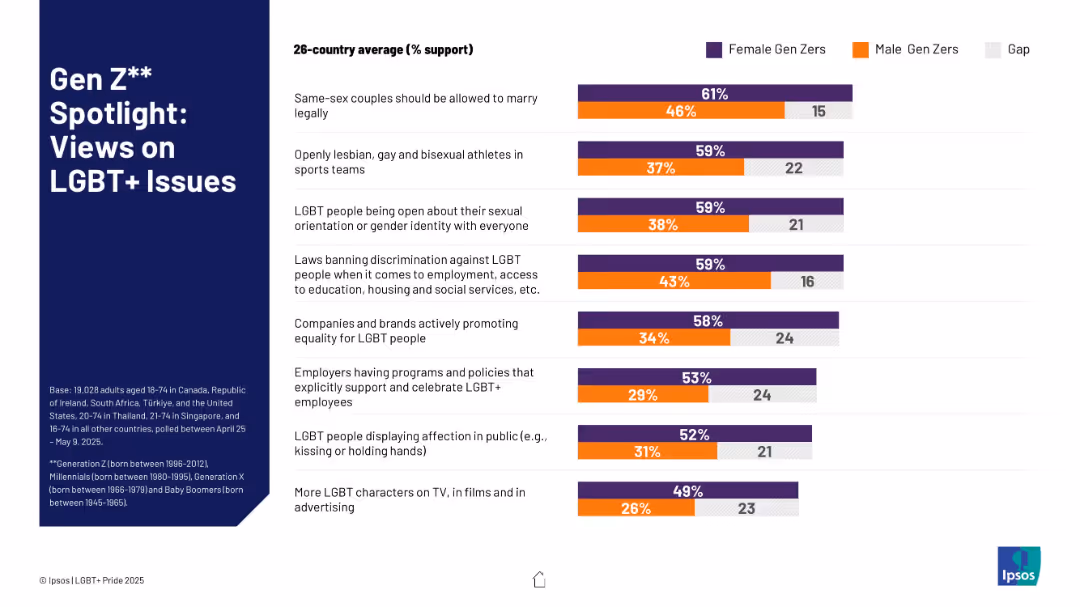
Bar chart comparing support levels among Gen Z males vs. females across various LGBT+ issues; includes support gap.
Customer and Market Segmentation
Government & Public Sector
This slide focuses on Gen Z attitudes toward LGBT+ rights and representation. It shows significant gender differences in support for issues like same-sex marriage, LGBT visibility in media, and corporate inclusion policies, indicating a pronounced gender divide within Gen Z.
Gen Z, gender gap, LGBT+ support, youth opinion, same-sex marriage, media representation, corporate inclusion, survey statistics
false
Customer and Market Segmentation
Government & Public Sector government-and-public-sector
Mixed Chart
IPSOS
Previous
Loading...
Hold On!
We are searching in our database
If nothing, comes up, please try different filters!
Column Chart
Heatmap
Chevron
Org Chart
Infographic
Callouts
Timeline
List
Graphic
Picture
Process Flow
Diagram
Paragraph
Map
Table
Framework
Subtitle
Takeaway Box
Icon
Other Chart
Radar Chart
Waterfall Chart
Mekko Chart
Pie Chart
Scatter Plot
Line Chart
Bar chart
Bullet points
Create a FREE account to continue browsing
Receive Instant Access to 1,000+ slides from companies like McKinsey, Google, and Goldman Sachs
First Name
Last Name
Email
Password
I agree to all
Terms & Privacy Policy
Thank you! Your submission has been received!
Oops! Something went wrong while submitting the form.
Have an account?
Sign in
Upgrade to PRO to Save slides
Advanced Search and Filters
Access to 15,000+ slides
Access to Category Pages
Save/Bookmark Slides
PowerPoint Template Library
Pick a Plan
MONTHLY
$12/month
Billed every month, Cancel anytime.
YEARLY
$9/year
Billed $108 annually, Cancel anytime.
Checkout for $12/month
Checkout for $108/yr
Secured by Stripe | AES-256 bit encryption