My Account
My Slides
Search by Category
Templates
Leave Feedback
Login
Logout
Get Started
Browse all Slides
Browse all Slides
Create a FREE Account
Instant access to 1,000+ real slides from top companies like McKinsey, BCG, Goldman Sachs, Google and many more!
First Name
Last Name
Email
Password
I agree to all
Terms & Privacy Policy
Thank you! Your submission has been received!
Oops! Something went wrong while submitting the form.
Have an account?
Sign in
📢 Ready to start building slides? Check out our new template library
VIEW TEMPLATES
Welcome,
Welcome
PRO
Show Featured Only
Checkbox 8
Companies
Mckinsey
Bain
BCG
EY
Deloitte
Accenture
PwC/Strategy&
JP Morgan
Goldman Sachs
Morgan Stanley
Citigroup
Deutsche Bank
Barclays
LEK
KPMG
Kearney
Oliver Wyman
Booz Allen Hamilton
Gartner
IPSOS
Nielsen
Slide type
Text Only
Linear Flow
Vertical Flow
Single Chart
Header Horizontal
Mixed Chart
Header Vertical
Pillar
Multiple Chart
Graphic
Agenda
Title
Table
Framework
Industry
Technology & Software
Artificial Intelligence
Financial Services
Retail & E-commerce
Consumer Goods
Industrial & Manufacturing
Transportation & Logistics
Telecommunications
Real Estate & Construction
Hospitality & Tourism
Professional Services
Education & Training
Media & Entertainment
Agriculture & Food Production
Healthcare & Pharmaceuticals
Environmental Services & Sustainability
Government & Public Sector
Use Case
Mergers and Acquisitions
Performance Metrics and KPIs
Client Case Studies
Competitive Landscape
Corporate Finance and Valuation
Product and Service Analysis
Customer and Market Segmentation
Organizational Structure and Change
Industry Overview
Regulatory and Compliance
Risk Assessment and Management
Investment Analysis
Organizational Structure and Change
Human Resources and Talent Management
Financial Performance
Market Analysis and Trends
Sales and Business Development
Human Resources and Talent Management
Clear all
Thank you! Your submission has been received!
Oops! Something went wrong while submitting the form.
Tag
View slide
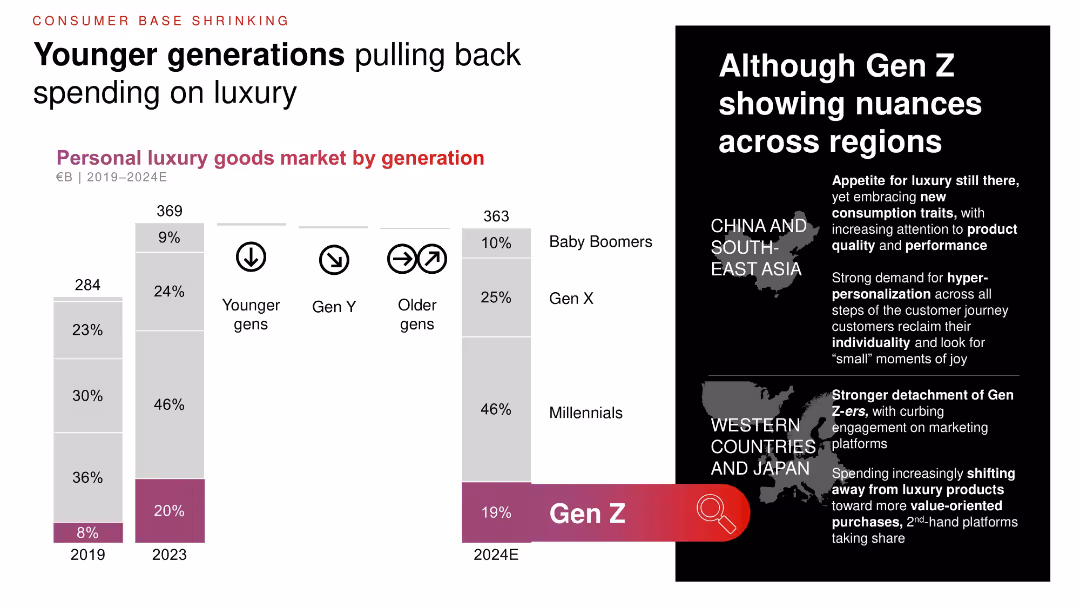
Vertical stacked bar charts of luxury goods market by generation (2019–2024E); regional callouts with maps; focus on Gen Z’s evolving consumption behaviors.
Customer and Market Segmentation
Consumer Goods
This slide highlights a pullback in luxury spending from younger generations, especially Gen Z. It breaks down spending by generation, noting regional differences in behavior and preferences between Asia and Western countries.
Gen Z, generational trends, luxury spending, consumer behavior, regional analysis, millennials
false
Customer and Market Segmentation
Consumer Goods consumer-goods
Mixed Chart
Bain
View slide
Consists of circular diagrams and percentages focusing on Gen Z's buying habits in the luxury market, with emphasis on sustainability and digital interactions.
Customer and Market Segmentation
Retail & E-commerce
Provides detailed insights into Gen Z's consumption patterns in the luxury sector, especially their preferences for sustainability and digital engagement.
Gen Z, luxury market, sustainability, digital engagement, circular diagrams, buying habits
false
Customer and Market Segmentation
Retail & E-commerce retail-and-e-commerce
Vertical Flow
BCG
View slide
The slide includes a main text section at the top, followed by two sets of data visuals. The left visual is a column chart showing the top concerns among Gen Zs, and the right visual for millennials.
Market Analysis and Trends
Consumer Goods
The slide highlights the top concerns for Gen Z and millennials, with cost of living being the primary issue. It includes survey data showing the percentages of respondents from both groups who are concerned about various issues like climate change and unemployment.
Gen Z, millennials, cost of living, survey, concerns
false
Market Analysis and Trends
Consumer Goods consumer-goods
Multiple Chart
Deloitte
View slide
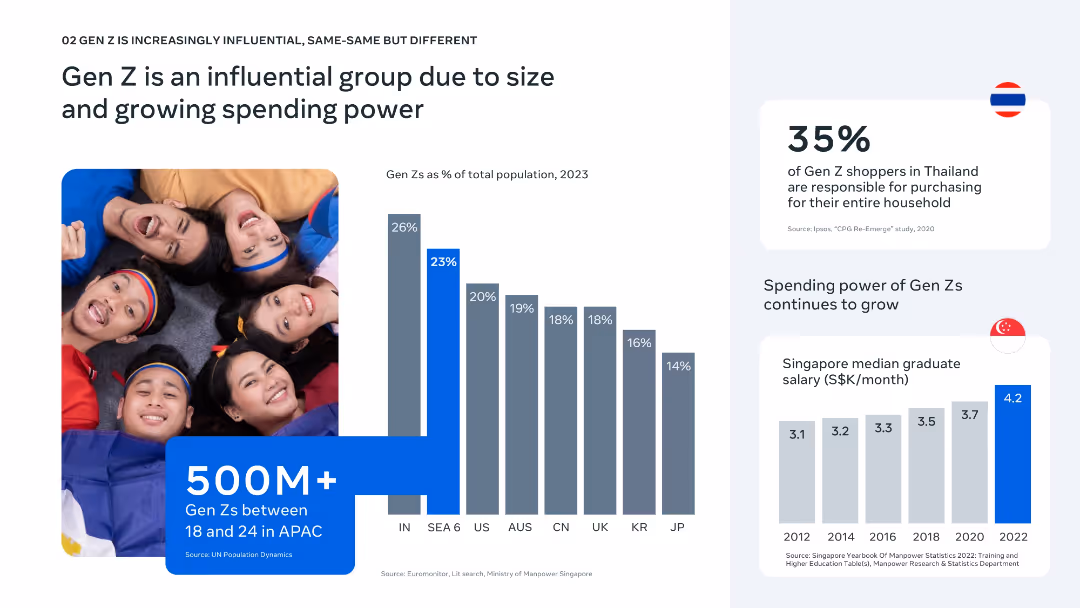
Side-by-side layout with image left, bar charts and stat blocks right; bright, youthful aesthetic.
Customer and Market Segmentation
Consumer Goods
Gen Z represents a significant share of the population in SEA and plays a key purchasing role. The slide includes data on population percentage, purchasing influence, and growing median salaries in Singapore as an example of increasing power.
Gen Z, population, spending power, household influence, APAC, income growth, graduate salary, youth market, Southeast Asia, purchasing behavior
false
Customer and Market Segmentation
Consumer Goods consumer-goods
Multiple Chart
Bain
View slide
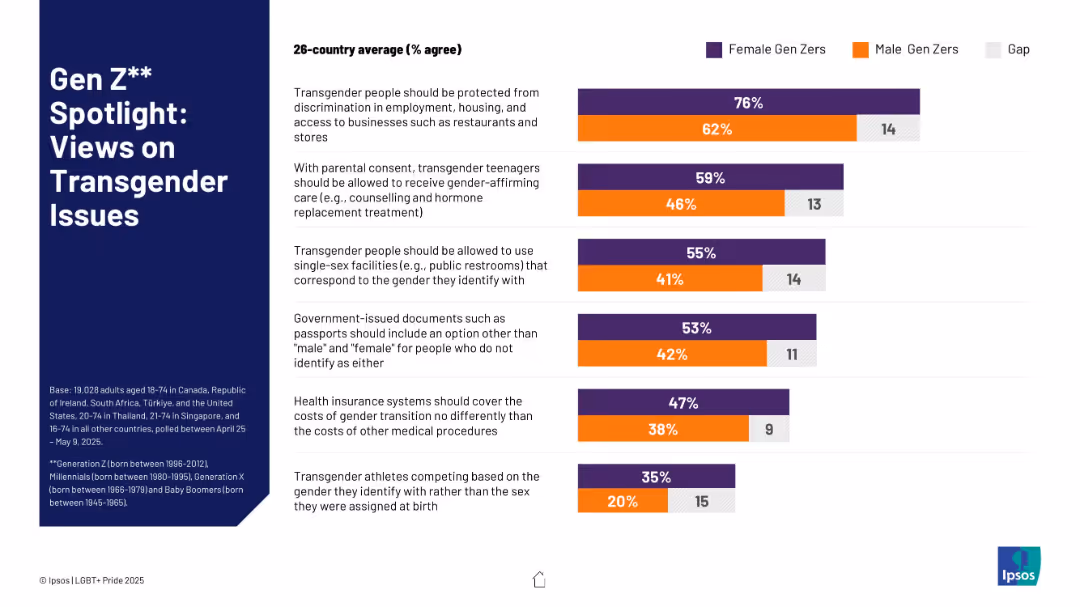
Split bar chart with horizontal bars for Male vs. Female Gen Zers, color-coded. Text-heavy right side; title block left.
Market Analysis and Trends
Government & Public Sector
The slide presents survey data comparing the views of male and female Gen Z individuals across six transgender-related statements, highlighting gender gaps in support levels and rights acknowledgment.
Gen Z, transgender rights, gender gap, survey, discrimination, equity
false
Market Analysis and Trends
Government & Public Sector government-and-public-sector
Mixed Chart
IPSOS
View slide
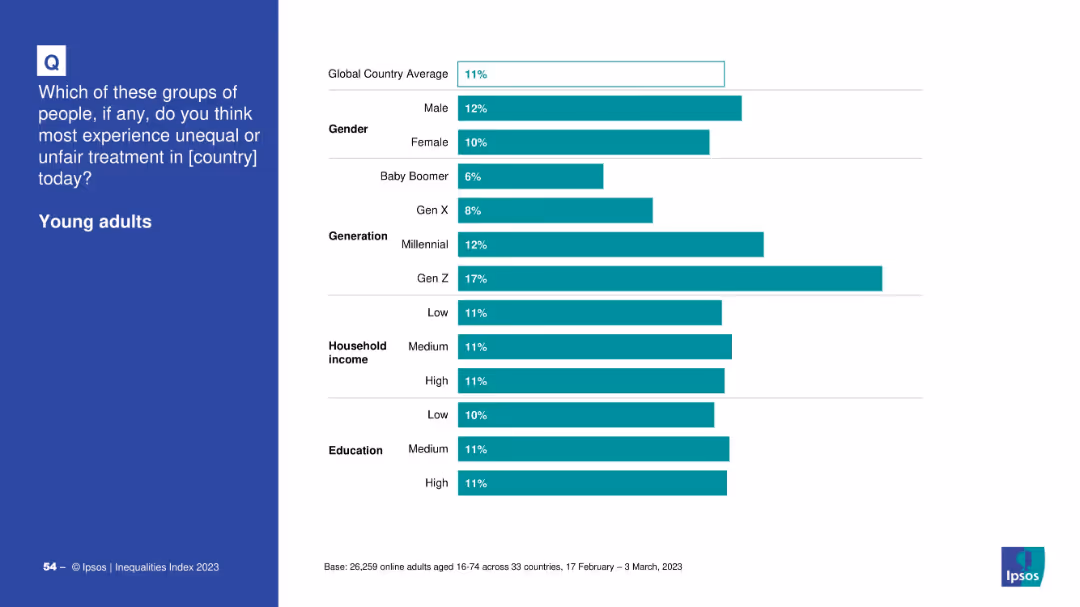
Bar chart of global perception by demographics: gender, generation, income, education
Market Analysis and Trends
Government & Public Sector
The slide compares demographic perceptions of unfair treatment of young adults. Gen Z respondents and Millennials report higher concerns, while Baby Boomers and older generations perceive less discrimination against the youth.
Gen Z, young adults, generational gap, Ipsos, inequality, survey analysis, education, income
false
Market Analysis and Trends
Government & Public Sector government-and-public-sector
Mixed Chart
IPSOS
View slide
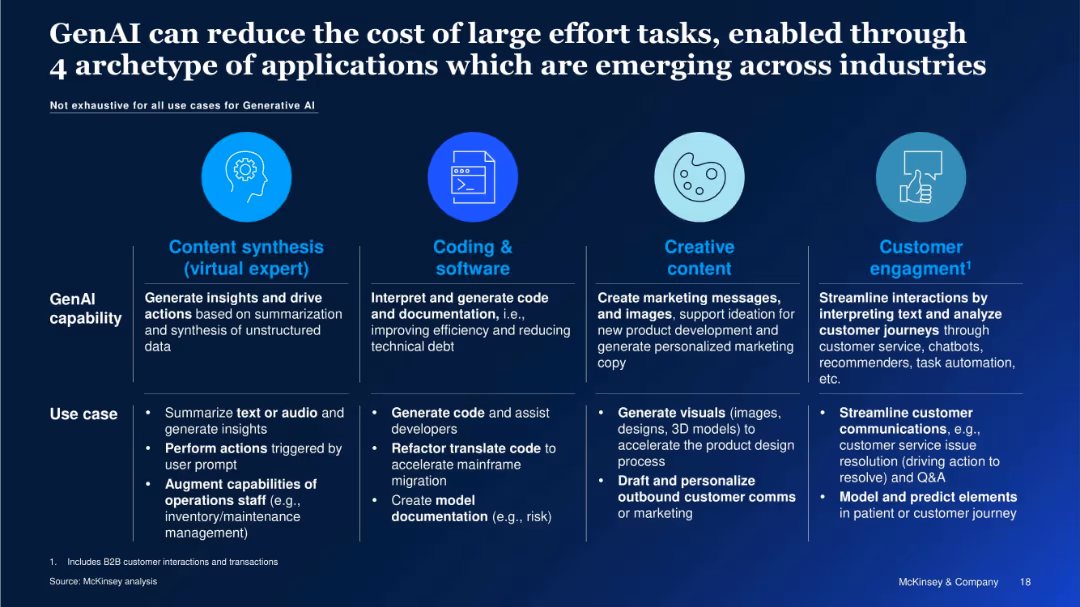
Horizontal layout with 4 circular icons and descriptions under headers: Content synthesis, Coding & software, Creative content, Customer engagement.
Technology and Digital Transformation
Artificial Intelligence
The slide outlines four major archetypes where GenAI adds value by reducing effort and cost: content synthesis, coding, content creation, and customer engagement. Each archetype includes examples and use cases such as automating code, summarizing data, and generating marketing content.
GenAI Capabilities, Content Automation, Code Generation, Marketing Automation, Customer Service, AI Use Cases, Industry Adoption
false
Technology and Digital Transformation
Artificial Intelligence artificial-intelligence
Table
McKinsey
View slide
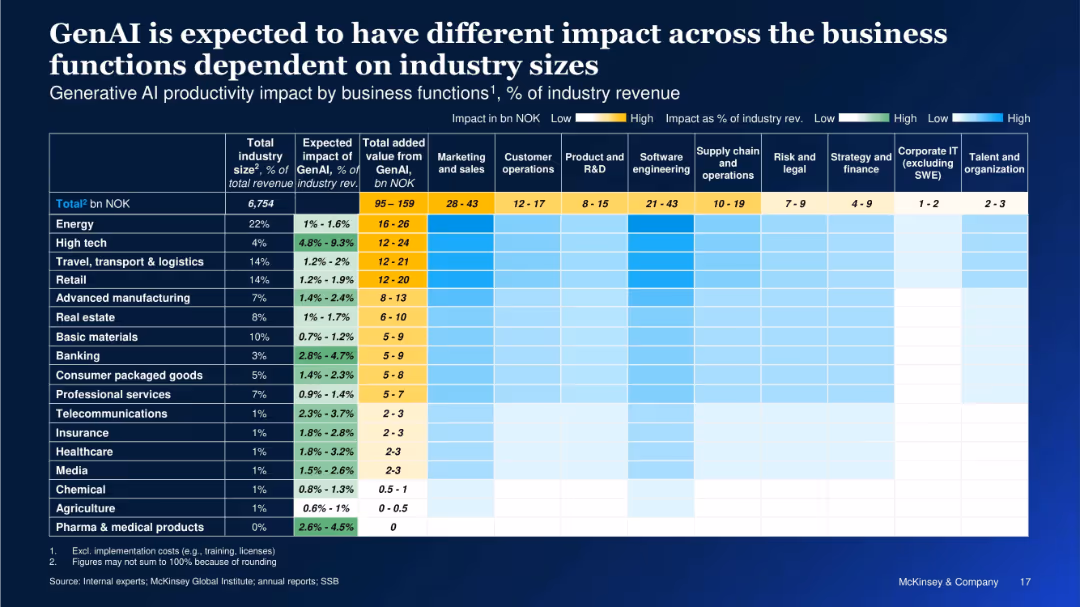
Heatmap and table showing GenAI impact across industries and functions, with percentages and value-added estimates in NOK.
Performance Metrics and KPIs
Artificial Intelligence
This slide quantifies the impact of GenAI across industries and business functions in terms of percentage of industry revenue and NOK value. It highlights where productivity gains are expected to be highest, with columns for different business areas like software engineering and marketing.
GenAI Impact, Industry Revenue, Business Functions, Value Creation, Productivity, Heatmap, Sector Comparison, NOK Value, Revenue Uplift
false
Performance Metrics and KPIs
Artificial Intelligence artificial-intelligence
Single Chart
McKinsey
View slide
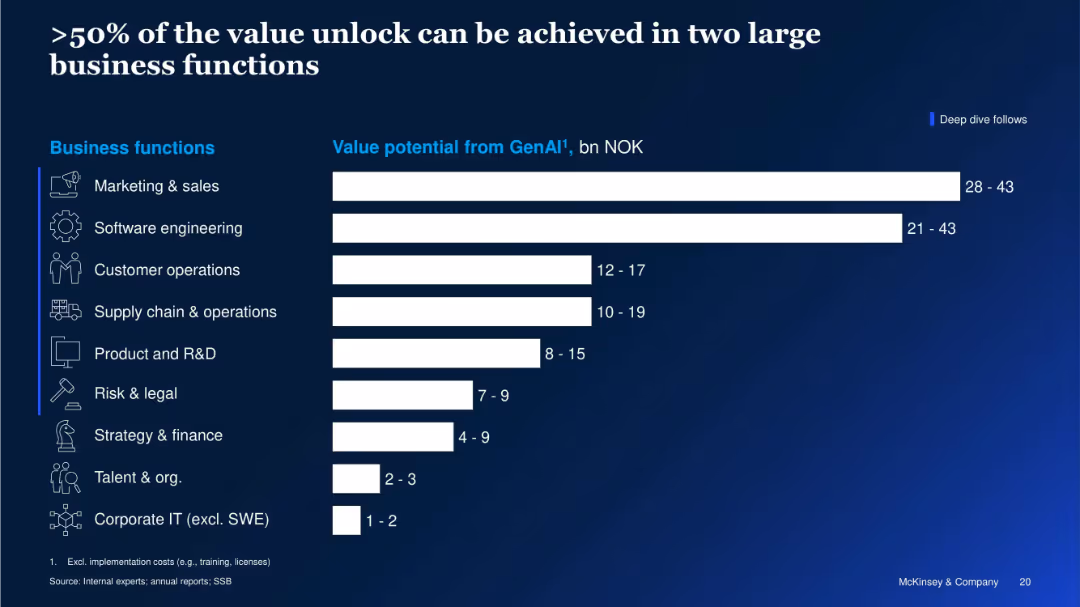
Horizontal bar chart showing GenAI value potential (in NOK) by business function. Icons accompany each function.
Strategic Planning
Artificial Intelligence
This slide shows that more than half of the GenAI value potential is concentrated in Marketing & Sales and Software Engineering. It quantifies value potential across various business functions, emphasizing where investments may yield the greatest returns.
GenAI Value, Business Functions, Marketing, Software Engineering, Strategic Value, Productivity, NOK Gains, McKinsey
false
Strategic Planning
Artificial Intelligence artificial-intelligence
Single Chart
McKinsey
View slide
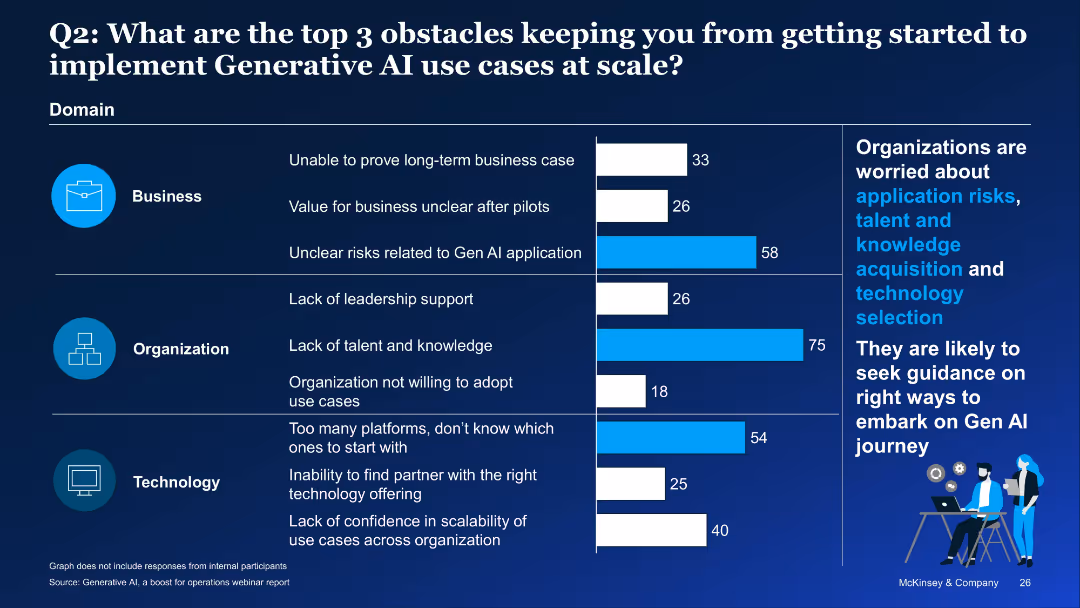
Bar chart by domain (Business, Organization, Technology), dark theme with callouts on right
Strategic Planning
Artificial Intelligence
This survey slide outlines the top three barriers to GenAI adoption: risk uncertainty, lack of talent, and platform complexity. It emphasizes organizations’ need for guidance on navigating these issues to scale AI effectively.
GenAI adoption, barriers, risks, talent shortage, tech selection, survey, scaling
false
Strategic Planning
Artificial Intelligence artificial-intelligence
Mixed Chart
McKinsey
View slide
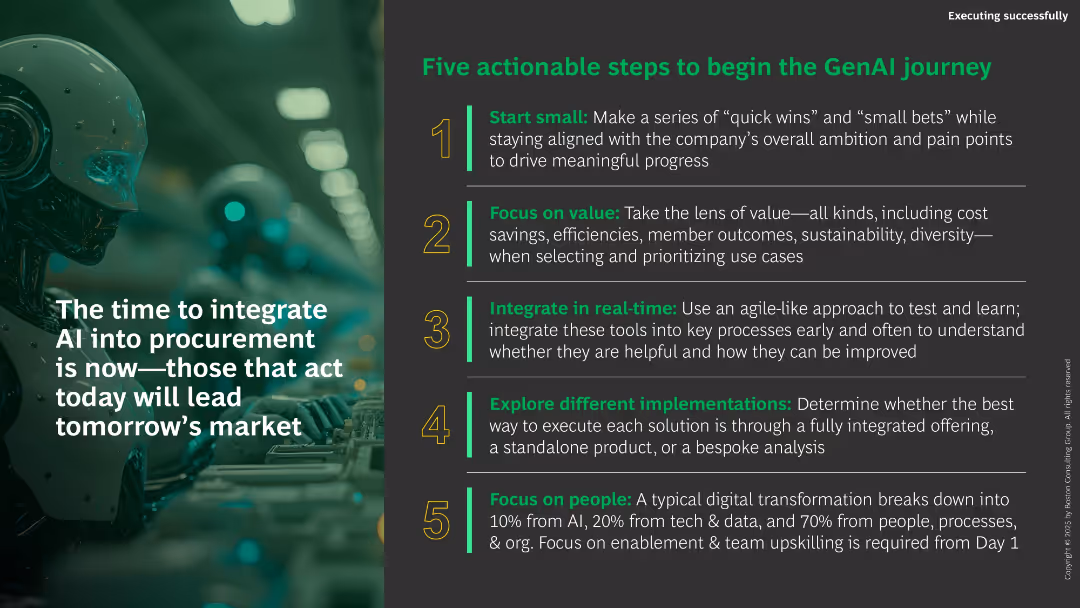
Split layout: left has large visual with quote overlay; right side has five numbered action steps with green-highlighted headers and detailed text.
Strategic Planning
Artificial Intelligence
The slide offers five actionable recommendations to integrate GenAI into procurement. It emphasizes starting small, focusing on value, real-time integration, implementation diversity, and team enablement. The left quote stresses urgency in adopting GenAI to stay ahead.
GenAI adoption, procurement, digital transformation, agile, people strategy, cost savings
false
Strategic Planning
Artificial Intelligence artificial-intelligence
Vertical Flow
BCG
View slide
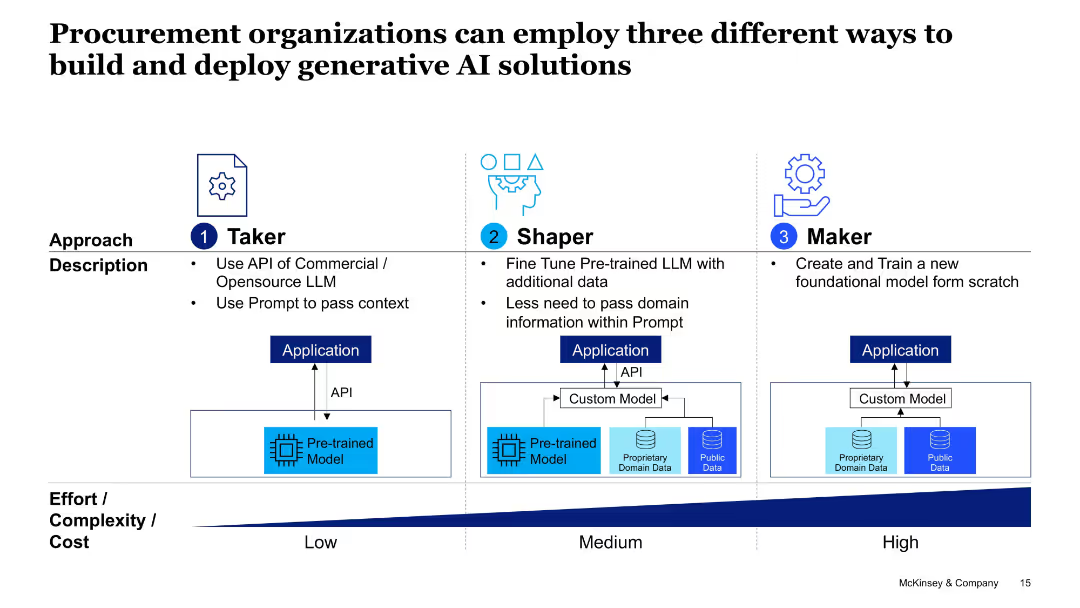
Visual comparison of 3 models (Taker, Shaper, Maker) using application flowcharts; effort/cost axis at bottom.
Technology and Digital Transformation
Professional Services
This slide categorizes three implementation strategies for Gen AI in procurement—using APIs (Taker), fine-tuning models (Shaper), and building models from scratch (Maker)—with increasing complexity and customizability.
GenAI deployment, Taker, Shaper, Maker, LLM, procurement, application model, complexity
false
Technology and Digital Transformation
Professional Services professional-services
Table
McKinsey
View slide
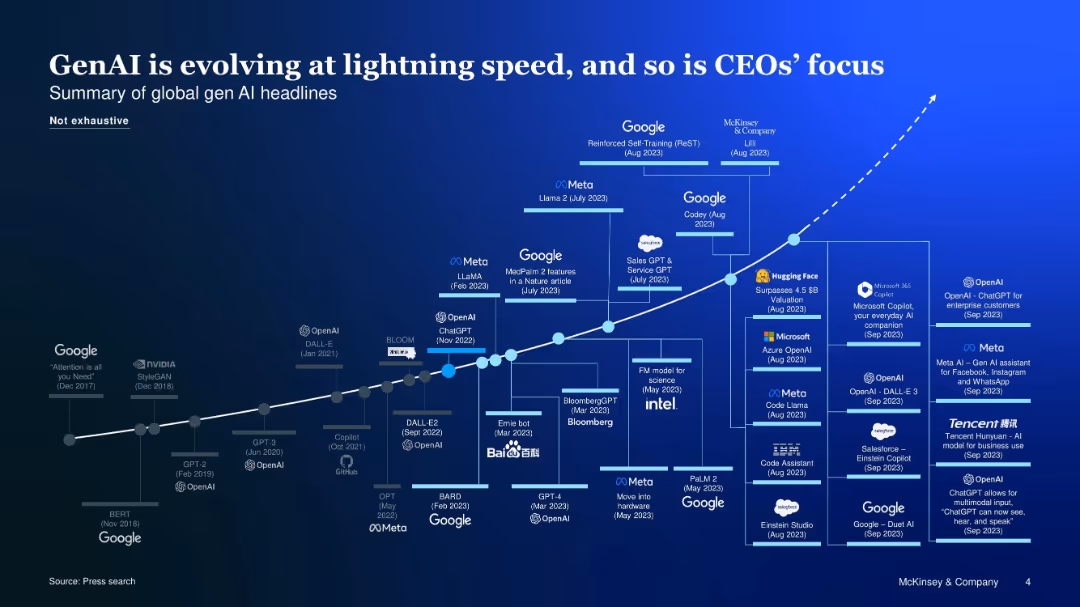
Curved timeline chart with logos and milestones showing GenAI evolution and corporate interest
Market Analysis and Trends
Artificial Intelligence
A visual timeline of key GenAI advancements and corporate initiatives, emphasizing rapid development and increased CEO attention toward AI-driven strategies.
GenAI evolution, timeline, CEOs, corporate focus, tech companies
false
Market Analysis and Trends
Artificial Intelligence artificial-intelligence
Uncategorized
McKinsey
View slide
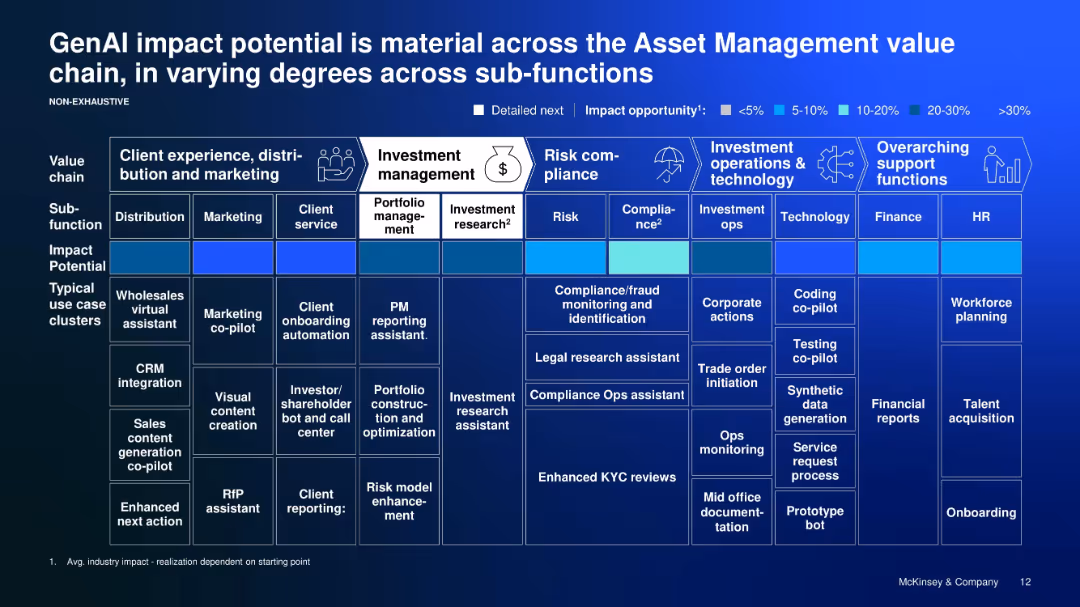
Matrix chart with color-coded impact scores across value chain sub-functions
Product and Service Analysis
Financial Services
Highlights specific GenAI use cases and their relative impact across asset management functions—from marketing and research to compliance and operations—using a color-coded grid for quick reference.
GenAI impact, asset management, use cases, sub-functions, color matrix
false
Product and Service Analysis
Financial Services financial-services
Table
McKinsey
View slide
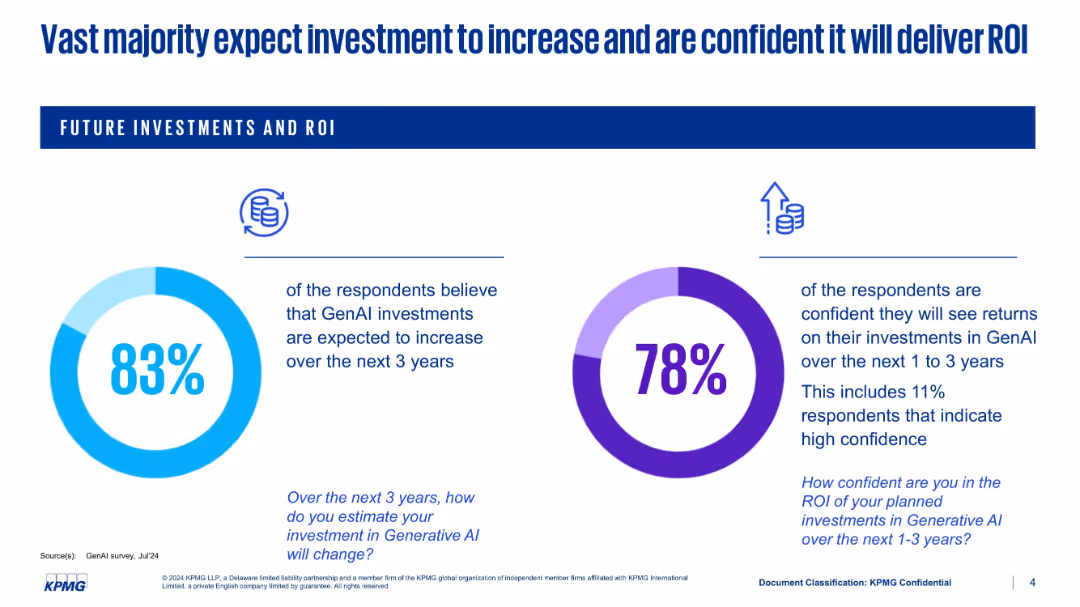
Dual pie chart-style graphics with brief explanations; simple layout with bold percentage visuals; header emphasizes future expectations.
Investment Analysis
Artificial Intelligence
Presents optimism surrounding GenAI investments. 83% believe investments will increase over 3 years; 78% are confident in achieving ROI. Shows growing strategic confidence in the value proposition of GenAI amid rising enterprise focus.
GenAI investment, ROI, future planning, strategic confidence, AI return, tech funding, survey results
false
Investment Analysis
Artificial Intelligence artificial-intelligence
Single Chart
KPMG
View slide
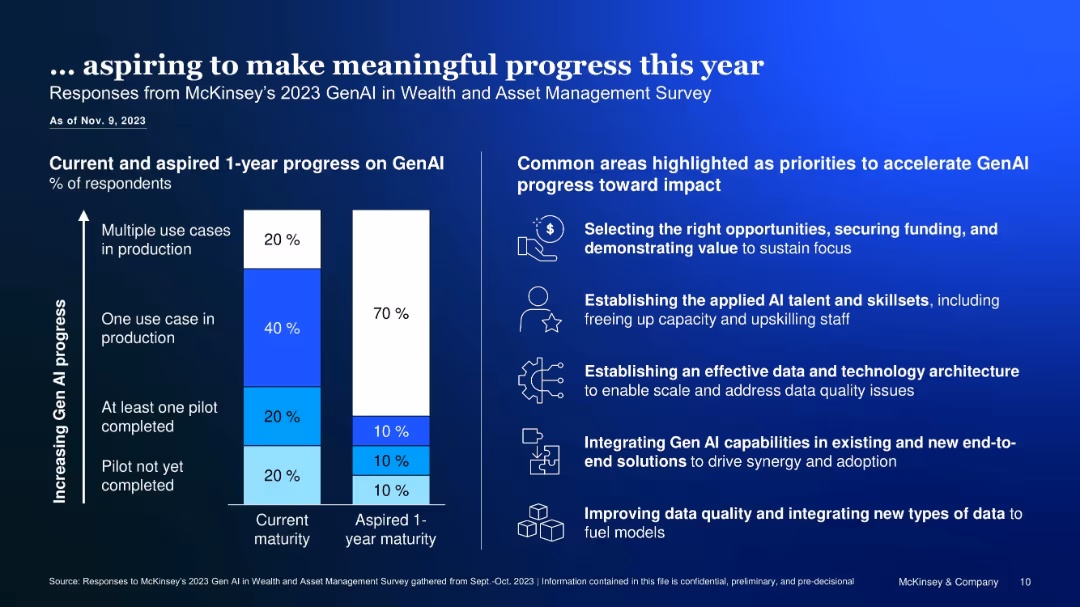
Bar chart with current vs. aspired GenAI progress, plus bullet list of acceleration priorities
Human Resources and Talent Management
Financial Services
Displays 2023 survey results on GenAI maturity in asset management. Identifies major organizational focus areas like talent, architecture, funding, and data to drive AI adoption and scale impact.
GenAI progress, maturity, survey, asset management, AI acceleration
false
Human Resources and Talent Management
Financial Services financial-services
Mixed Chart
McKinsey
View slide
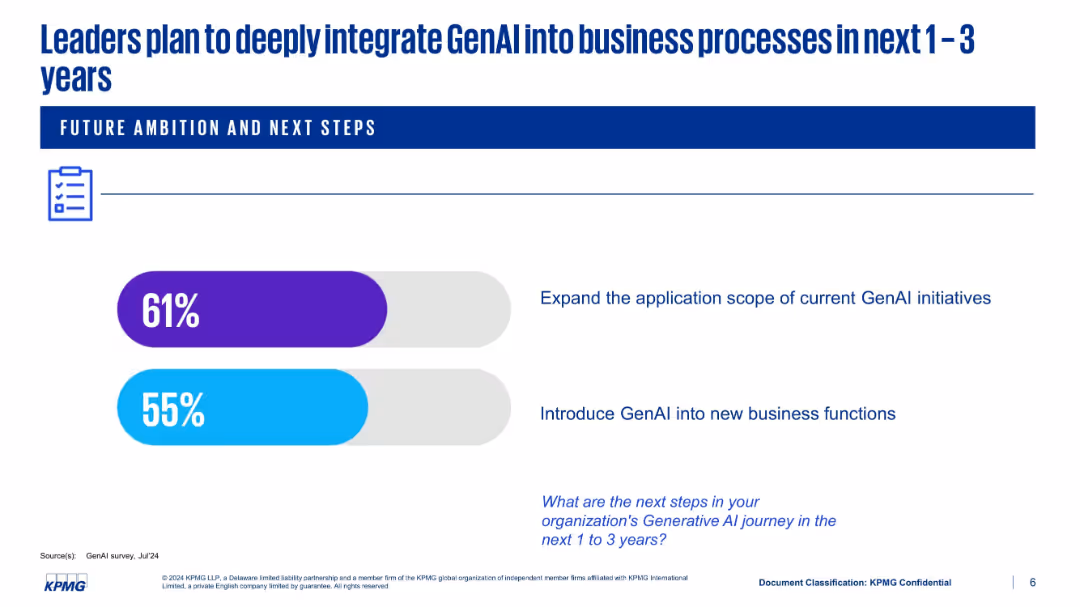
Simple layout with two horizontal progress bars showing future plans: expand scope and introduce into new functions
Strategic Planning
Artificial Intelligence
This slide outlines executive ambitions to scale GenAI integration over the next 1–3 years. 61% of leaders plan to expand current initiatives, while 55% aim to introduce GenAI to new business areas. The layout is minimalistic, focusing attention on the percentages and intended actions.
GenAI roadmap, expansion, business functions, KPMG, adoption, strategy
false
Strategic Planning
Artificial Intelligence artificial-intelligence
Single Chart
KPMG
View slide
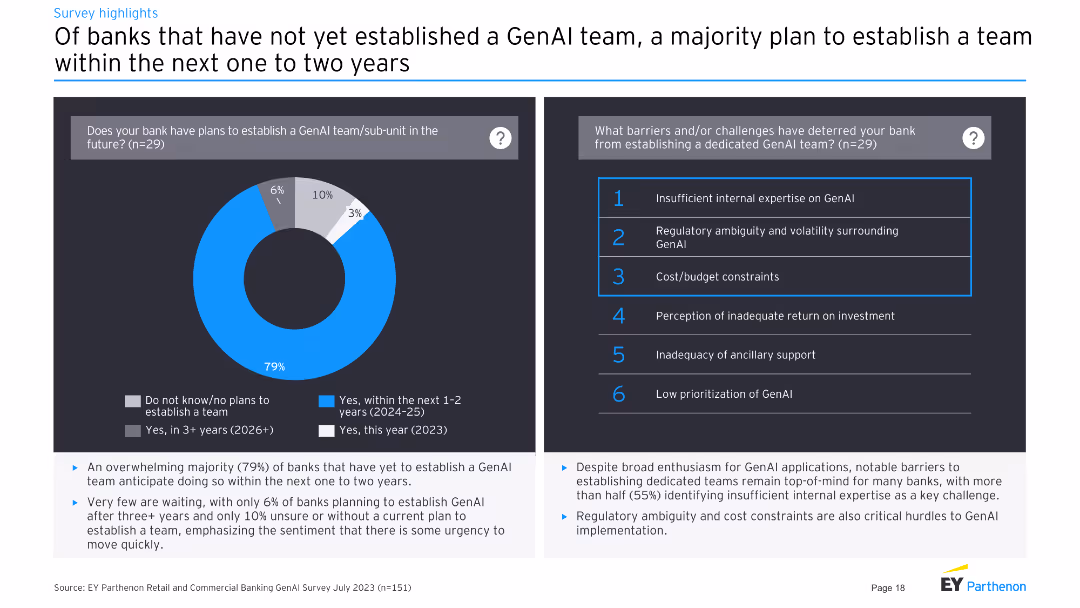
Left: pie chart on plans to establish GenAI teams. Right: list of barriers to establishing GenAI teams.
Human Resources and Talent Management
Financial Services
Majority of banks plan to establish a GenAI team within 1-2 years, facing barriers such as expertise and regulatory ambiguity.
GenAI team, establishment, barriers, expertise, regulation
false
Human Resources and Talent Management
Financial Services financial-services
Mixed Chart
EY
View slide
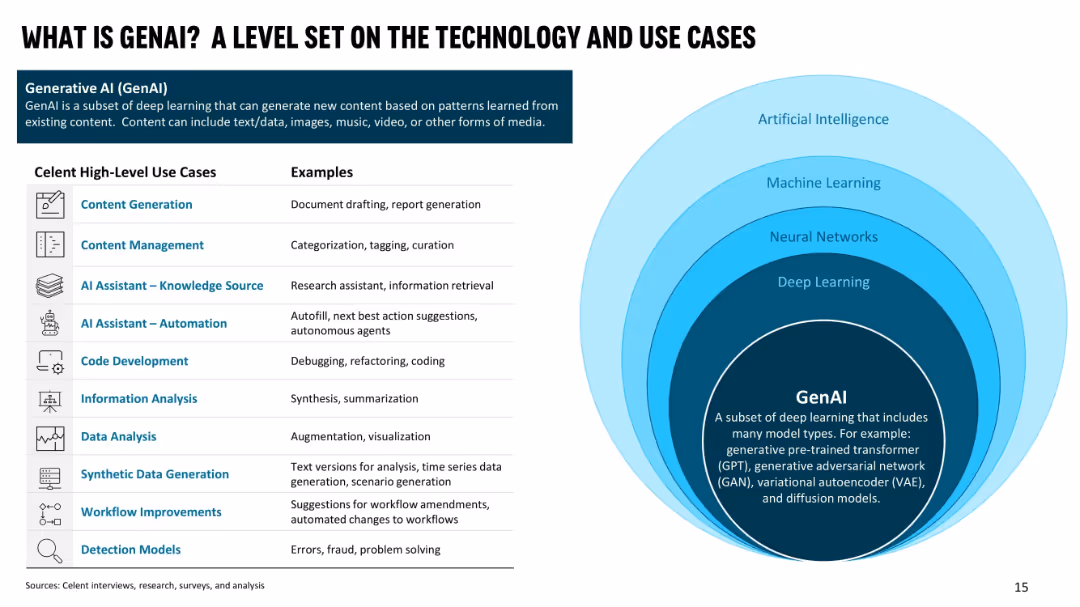
Left side shows a table of GenAI high-level use cases with examples; right side has concentric rings showing relationship of AI → ML → NN → DL → GenAI.
Technology and Digital Transformation
Artificial Intelligence
Defines Generative AI and places it within the broader AI ecosystem. Lists high-level use cases with real-world examples including content generation, automation, data analysis, and code development. The goal is to orient the audience to GenAI's capabilities and application relevance.
GenAI, AI hierarchy, use cases, content generation, automation, knowledge source, deep learning
false
Technology and Digital Transformation
Artificial Intelligence artificial-intelligence
Table
Oliver Wyman
View slide
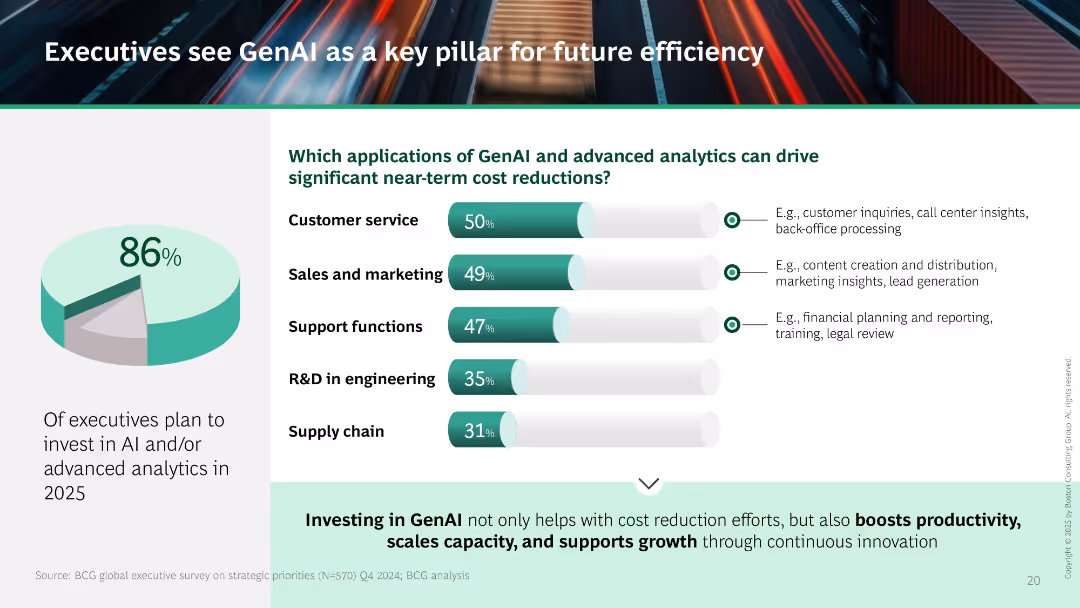
Horizontal bar chart of GenAI use cases across functions (e.g., customer service, R&D). Pie chart shows 86% of executives plan AI investment. Footer text emphasizes productivity and growth through GenAI.
Technology and Digital Transformation
Artificial Intelligence
Highlights executive plans to use GenAI for near-term cost reductions in functions like customer service, marketing, and support. Emphasizes how AI enables efficiency, scalability, and innovation.
GenAI, AI investment, cost reduction, automation, analytics, customer service, innovation, efficiency
false
Technology and Digital Transformation
Artificial Intelligence artificial-intelligence
Multiple Chart
BCG
View slide
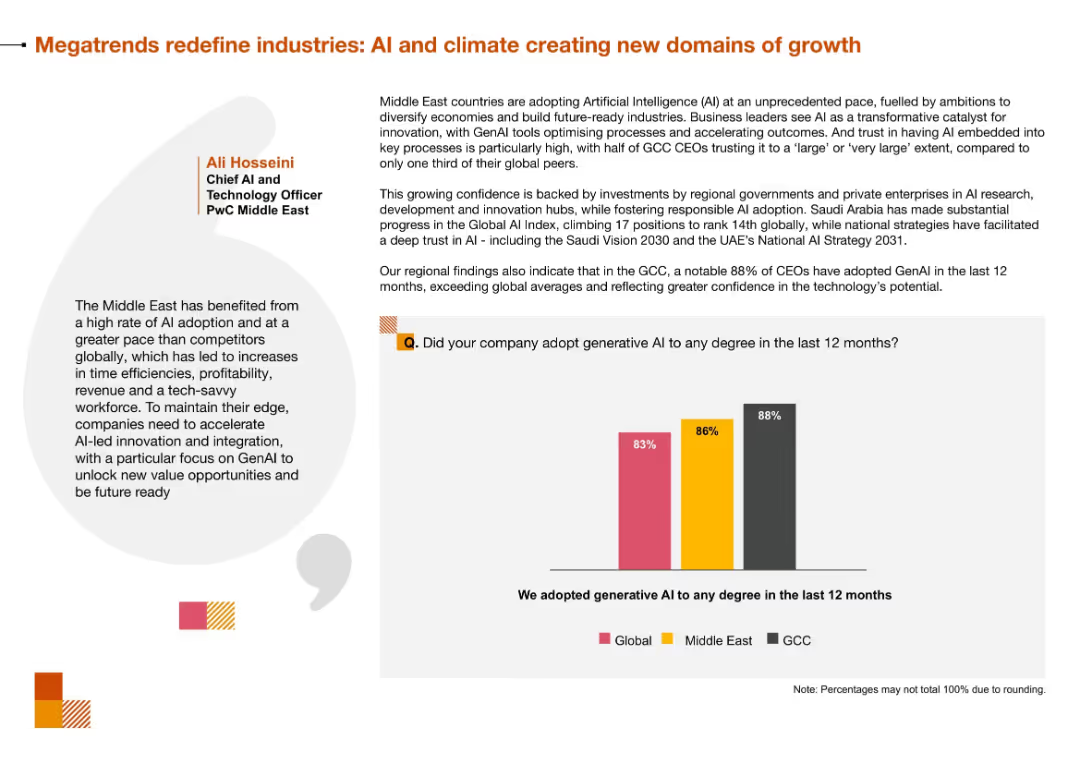
Profile section with AI officer’s quote and regional analysis on left; bar chart showing GenAI adoption rates by region on right
Technology and Digital Transformation
Artificial Intelligence
The slide emphasizes rapid adoption of GenAI in the Middle East, especially the GCC, where AI is seen as a transformative catalyst. It highlights regional confidence in AI and government-led initiatives to support growth.
GenAI, Artificial Intelligence, AI Adoption, Middle East, GCC, Innovation, Future Readiness
false
Technology and Digital Transformation
Artificial Intelligence artificial-intelligence
Mixed Chart
PwC/Strategy&
View slide
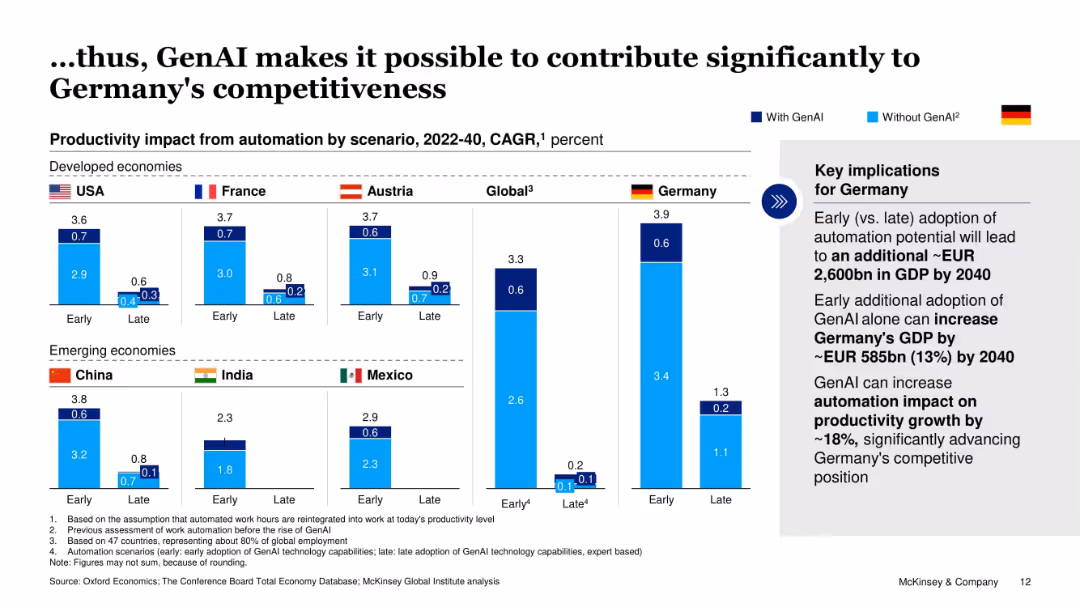
Clustered bar chart comparing productivity impact (CAGR) for early vs. late GenAI adoption across countries (USA, Germany, India, etc.).
Strategic Planning
Artificial Intelligence
This slide shows that early GenAI adoption can significantly boost productivity and GDP in both developed and emerging economies, especially Germany. Germany could gain €2.6 trillion by 2040 with early adoption.
GenAI, GDP growth, automation impact, early vs. late adoption, Germany, productivity, international comparison
false
Strategic Planning
Artificial Intelligence artificial-intelligence
Mixed Chart
McKinsey
View slide
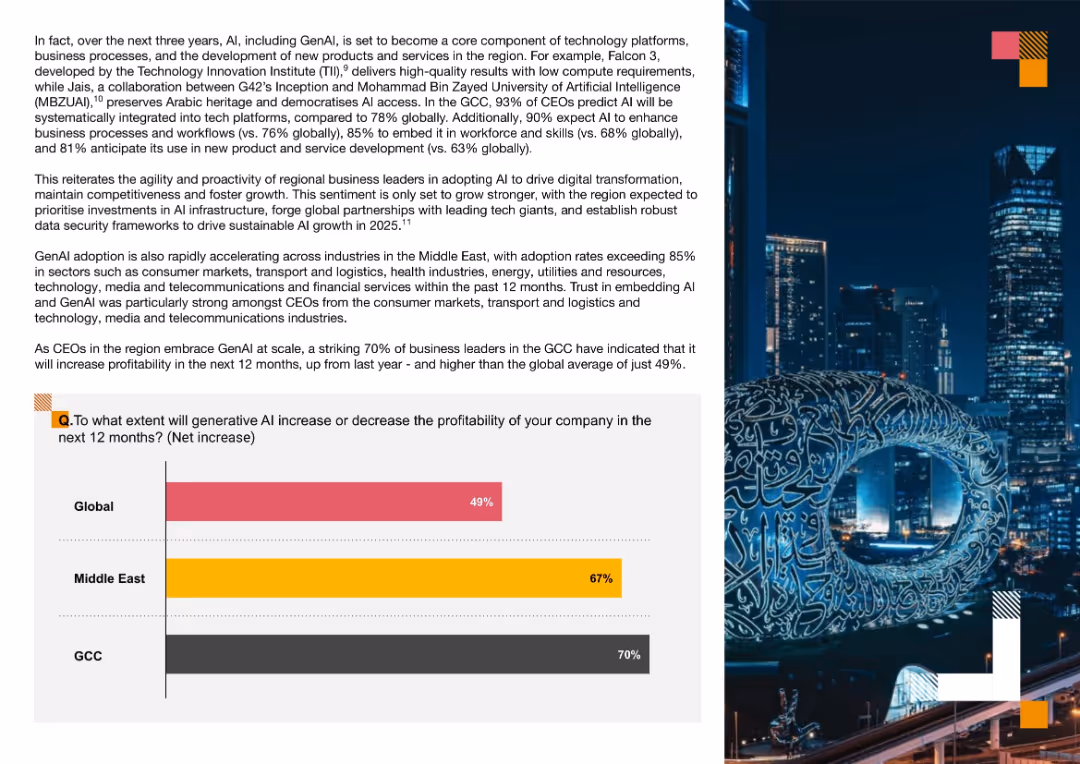
Bar chart comparing Global, Middle East, and GCC views on net increase in profitability from GenAI; dark background photo of cityscape
Financial Performance
Artificial Intelligence
This slide presents survey results showing that GCC CEOs are most optimistic about GenAI increasing profitability in the next year, with 70% projecting gains. The region outpaces global averages.
GenAI, Profitability, AI Optimism, GCC, Technology ROI, Digital Tools, Strategic Investment
false
Financial Performance
Artificial Intelligence artificial-intelligence
Mixed Chart
PwC/Strategy&
View slide
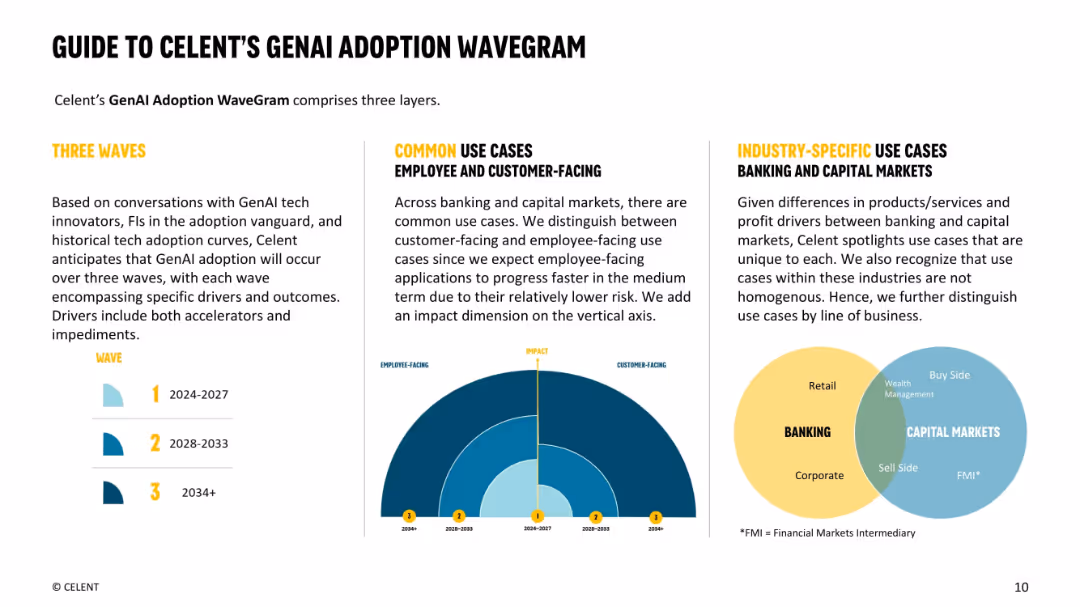
Three-column layout with WaveGram graphic and Venn diagram; text explains wave structure and industry breakdown
Technology and Digital Transformation
Artificial Intelligence
The slide outlines Celent's framework for GenAI adoption in financial institutions, split into three waves and categorized by use cases (employee-facing, customer-facing) and industry-specific needs.
GenAI, adoption waves, financial institutions, use cases, AI strategy, capital markets
false
Technology and Digital Transformation
Artificial Intelligence artificial-intelligence
Mixed Chart
Oliver Wyman
View slide
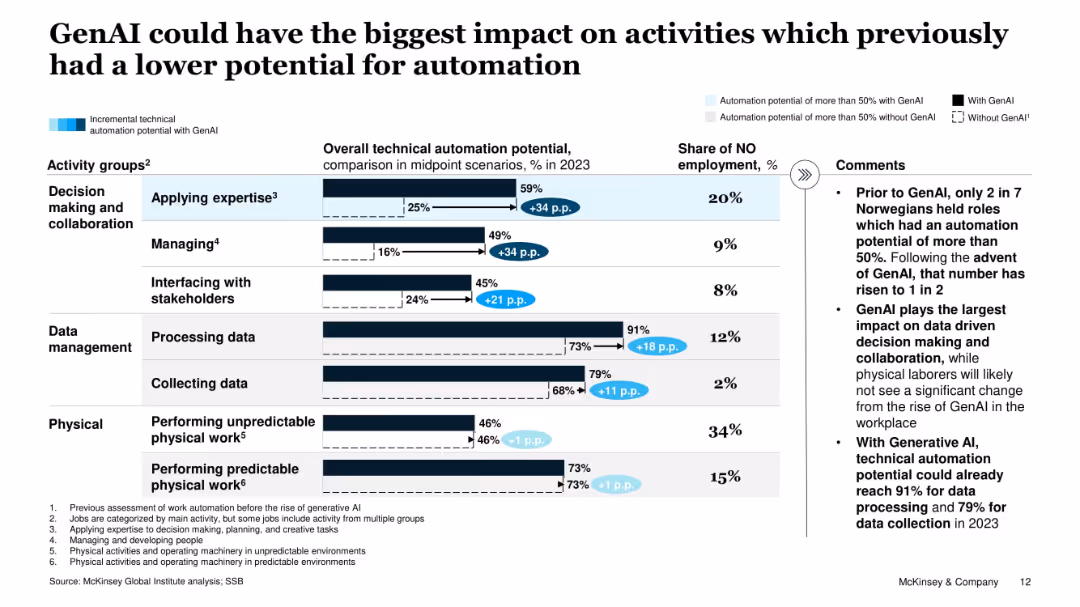
Bar chart categorizing work activities (e.g., data, decision-making, physical) by automation potential, with/without GenAI. Comments emphasize key insights.
Operational Efficiency
Artificial Intelligence
This slide emphasizes GenAI's greatest impact on previously low-automation tasks like decision-making and data management. It shows significant uplift in automation potential across several activity groups.
GenAI, automation, activity groups, data processing, decision-making, productivity, Norway
false
Operational Efficiency
Artificial Intelligence artificial-intelligence
Mixed Chart
McKinsey
View slide
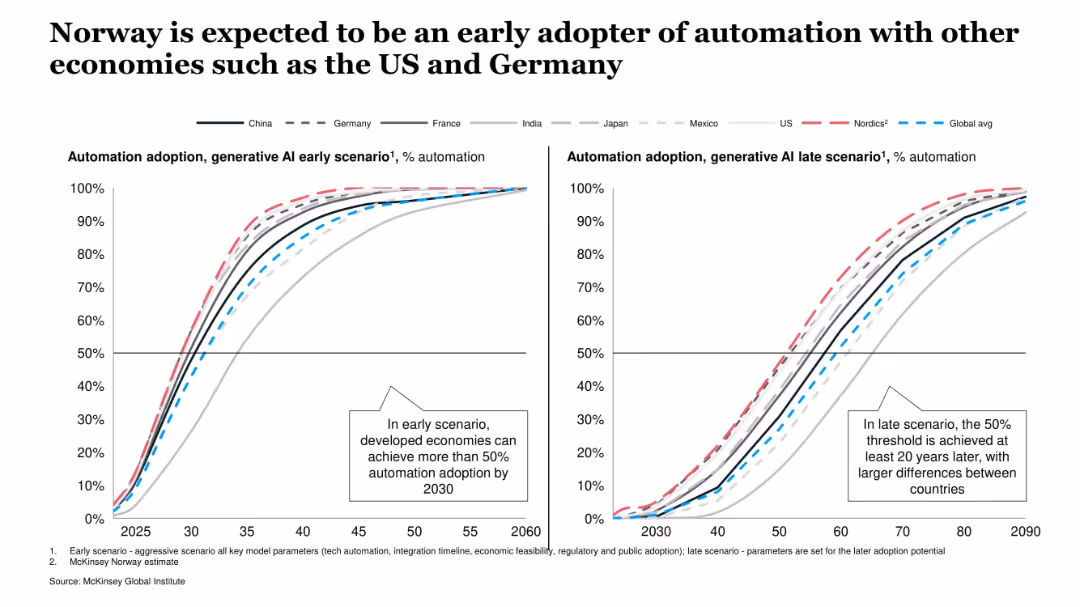
Side-by-side line charts showing AI adoption trajectories under early and late scenarios for various countries. Clear legend and scenario-based comparison.
Technology and Digital Transformation
Artificial Intelligence
This slide compares expected automation adoption under GenAI across multiple countries, showing that Norway and other developed nations are projected to lead adoption under both early and late scenarios.
GenAI, automation, adoption, Norway, early scenario, late scenario, global comparison, productivity
false
Technology and Digital Transformation
Artificial Intelligence artificial-intelligence
Multiple Chart
McKinsey
View slide
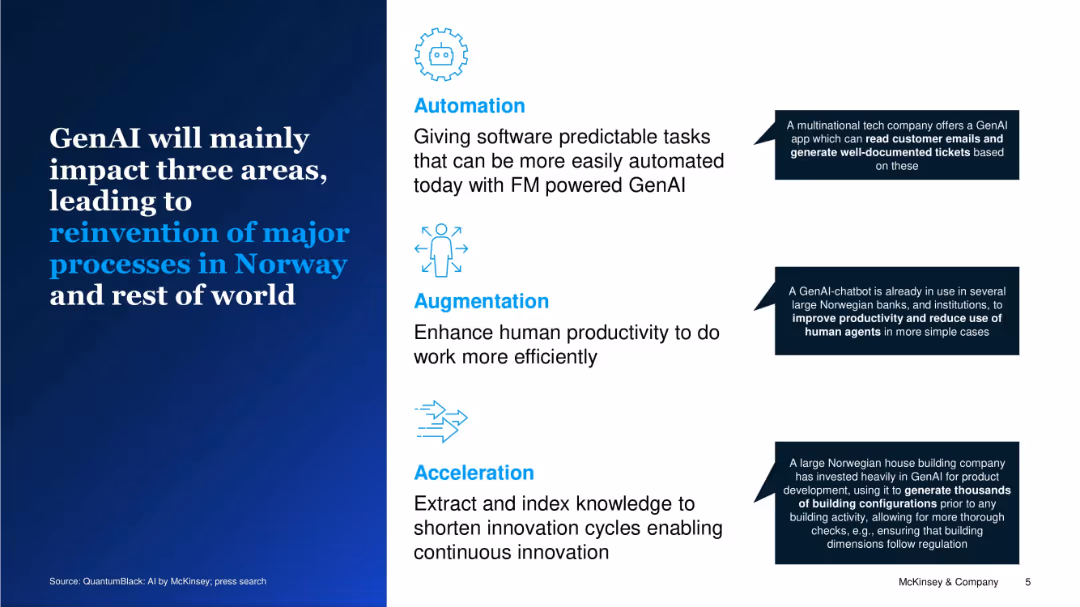
Split layout with bold headline on left and three illustrated blocks (Automation, Augmentation, Acceleration) on the right. Each block includes icons, brief descriptions, and callout examples.
Strategic Planning
Artificial Intelligence
The slide introduces the three major impact areas of GenAI—automation, augmentation, and acceleration—highlighting how it will transform business operations in Norway and globally, with examples of implementation.
GenAI, automation, augmentation, acceleration, Norway, productivity, transformation, FM, business impact
false
Strategic Planning
Artificial Intelligence artificial-intelligence
Vertical Flow
McKinsey
View slide
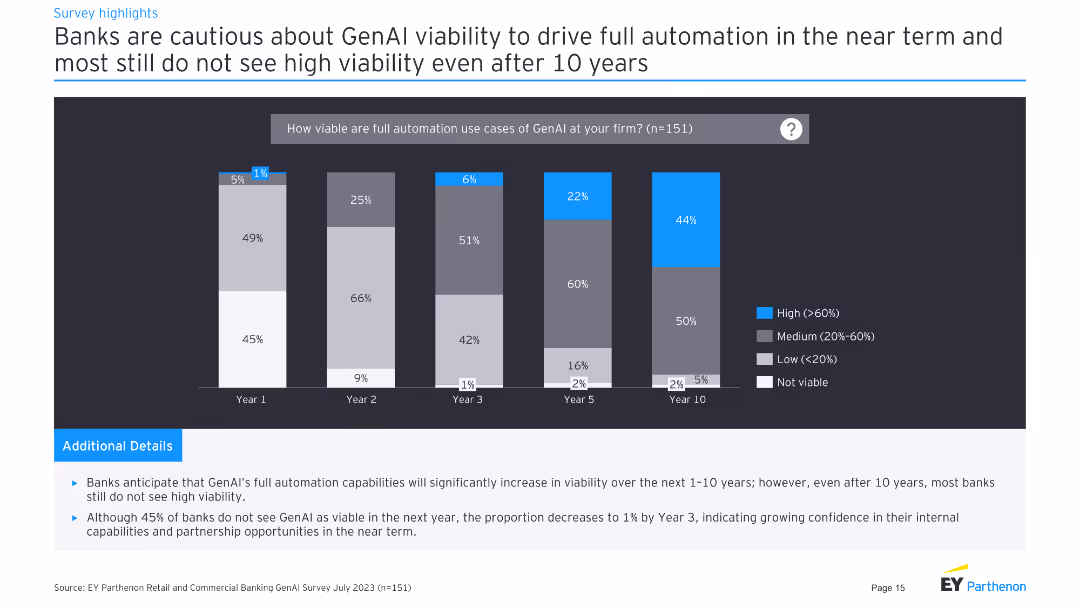
Column chart showing viability of GenAI for full automation over 10 years.
Risk Assessment and Management
Financial Services
Banks are cautious about GenAI viability for full automation, with low confidence even after 10 years.
GenAI, automation, viability, long-term, risk
false
Risk Assessment and Management
Financial Services financial-services
Mixed Chart
EY
View slide
The slide includes column charts showing the level of interest in GenAI by deposit size and the primary drivers motivating banks to implement GenAI technologies, with a large textual summary.
Technology and Digital Transformation
Financial Services
The slide provides insights into the current investments in GenAI by banks of various sizes and the primary benefits they expect from these technologies, such as productivity enhancements and cost reductions.
GenAI, banks, investment, drivers, technology
false
Technology and Digital Transformation
Financial Services financial-services
Multiple Chart
EY
View slide
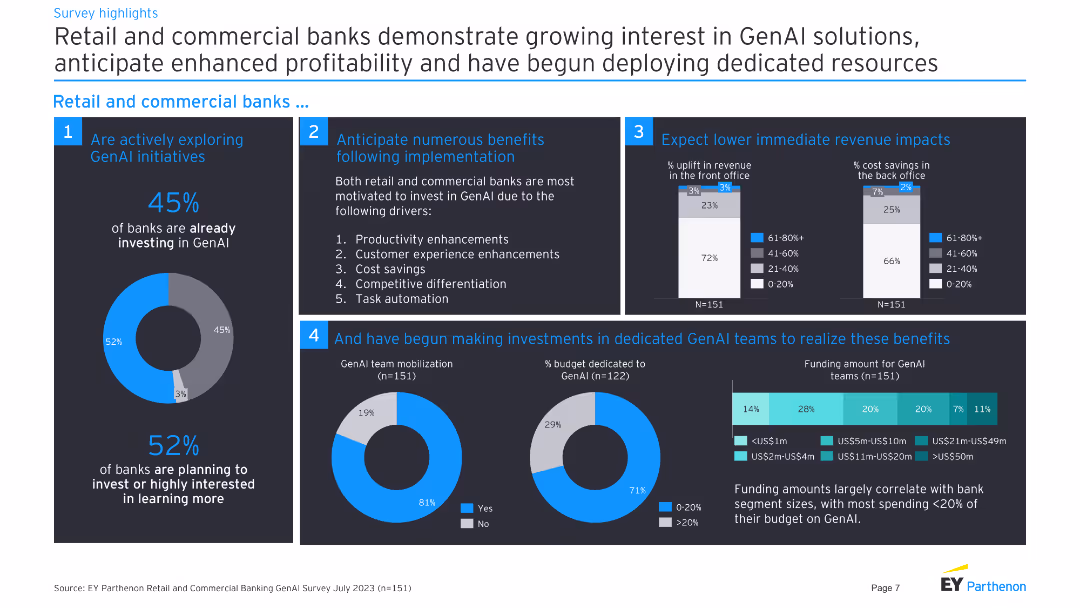
The slide features a combination of pie charts and column charts, along with textual points about the benefits and budget allocations for GenAI solutions in retail and commercial banks.
Technology and Digital Transformation
Financial Services
The slide highlights the growing interest of retail and commercial banks in GenAI technologies, detailing the anticipated benefits and current investment levels in these technologies.
GenAI, banks, profitability, investment, technology
false
Technology and Digital Transformation
Financial Services financial-services
Multiple Chart
EY
Previous
Loading...
Hold On!
We are searching in our database
If nothing, comes up, please try different filters!
Column Chart
Heatmap
Chevron
Org Chart
Infographic
Callouts
Timeline
List
Graphic
Picture
Process Flow
Diagram
Paragraph
Map
Table
Framework
Subtitle
Takeaway Box
Icon
Other Chart
Radar Chart
Waterfall Chart
Mekko Chart
Pie Chart
Scatter Plot
Line Chart
Bar chart
Bullet points
Create a FREE account to continue browsing
Receive Instant Access to 1,000+ slides from companies like McKinsey, Google, and Goldman Sachs
First Name
Last Name
Email
Password
I agree to all
Terms & Privacy Policy
Thank you! Your submission has been received!
Oops! Something went wrong while submitting the form.
Have an account?
Sign in
Upgrade to PRO to Save slides
Advanced Search and Filters
Access to 15,000+ slides
Access to Category Pages
Save/Bookmark Slides
PowerPoint Template Library
Pick a Plan
MONTHLY
$12/month
Billed every month, Cancel anytime.
YEARLY
$9/year
Billed $108 annually, Cancel anytime.
Checkout for $12/month
Checkout for $108/yr
Secured by Stripe | AES-256 bit encryption