My Account
My Slides
Search by Category
Templates
Leave Feedback
Login
Logout
Get Started
Browse all Slides
Browse all Slides
Create a FREE Account
Instant access to 1,000+ real slides from top companies like McKinsey, BCG, Goldman Sachs, Google and many more!
First Name
Last Name
Email
Password
I agree to all
Terms & Privacy Policy
Thank you! Your submission has been received!
Oops! Something went wrong while submitting the form.
Have an account?
Sign in
📢 Ready to start building slides? Check out our new template library
VIEW TEMPLATES
Welcome,
Welcome
PRO
Show Featured Only
Checkbox 8
Companies
Mckinsey
Bain
BCG
EY
Deloitte
Accenture
PwC/Strategy&
JP Morgan
Goldman Sachs
Morgan Stanley
Citigroup
Deutsche Bank
Barclays
LEK
KPMG
Kearney
Oliver Wyman
Booz Allen Hamilton
Gartner
IPSOS
Nielsen
Slide type
Text Only
Linear Flow
Vertical Flow
Single Chart
Header Horizontal
Mixed Chart
Header Vertical
Pillar
Multiple Chart
Graphic
Agenda
Title
Table
Framework
Industry
Technology & Software
Artificial Intelligence
Financial Services
Retail & E-commerce
Consumer Goods
Industrial & Manufacturing
Transportation & Logistics
Telecommunications
Real Estate & Construction
Hospitality & Tourism
Professional Services
Education & Training
Media & Entertainment
Agriculture & Food Production
Healthcare & Pharmaceuticals
Environmental Services & Sustainability
Government & Public Sector
Use Case
Mergers and Acquisitions
Performance Metrics and KPIs
Client Case Studies
Competitive Landscape
Corporate Finance and Valuation
Product and Service Analysis
Customer and Market Segmentation
Organizational Structure and Change
Industry Overview
Regulatory and Compliance
Risk Assessment and Management
Investment Analysis
Organizational Structure and Change
Human Resources and Talent Management
Financial Performance
Market Analysis and Trends
Sales and Business Development
Human Resources and Talent Management
Clear all
Thank you! Your submission has been received!
Oops! Something went wrong while submitting the form.
Tag
View slide
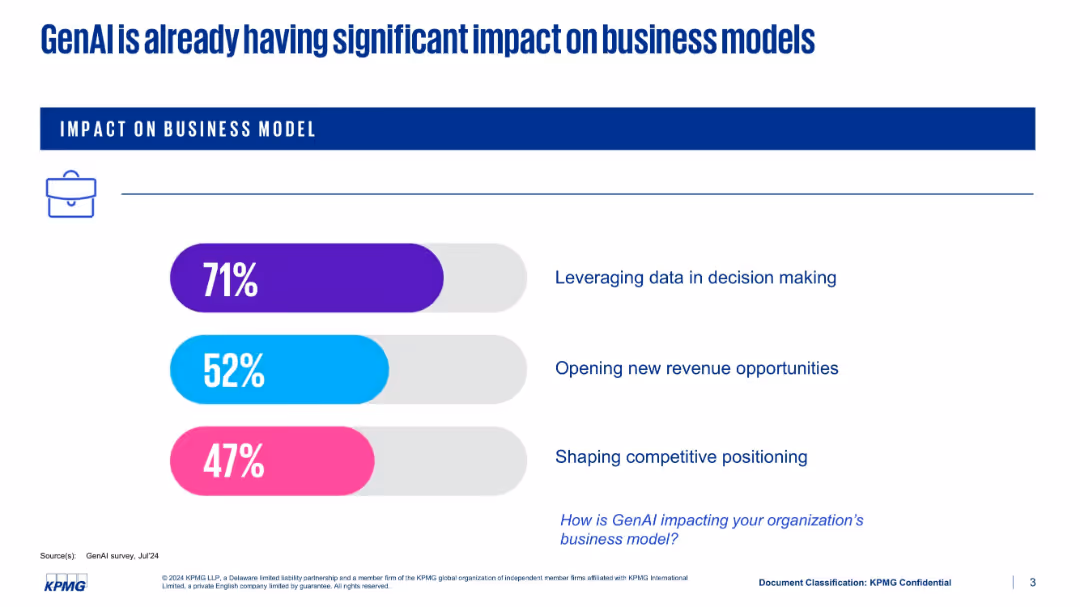
Minimalist slide with three horizontal bars in colored design elements showing percentage impacts; all content centers around business effects.
Product and Service Analysis
Artificial Intelligence
Communicates the transformational impact of GenAI on business models. Key areas include leveraging data in decision-making (71%), opening new revenue (52%), and competitive positioning (47%). It prompts the viewer to consider GenAI’s strategic implications.
GenAI, business models, data-driven decisions, new revenue, competitive positioning, transformation, AI impact
false
Product and Service Analysis
Artificial Intelligence artificial-intelligence
Single Chart
KPMG
View slide
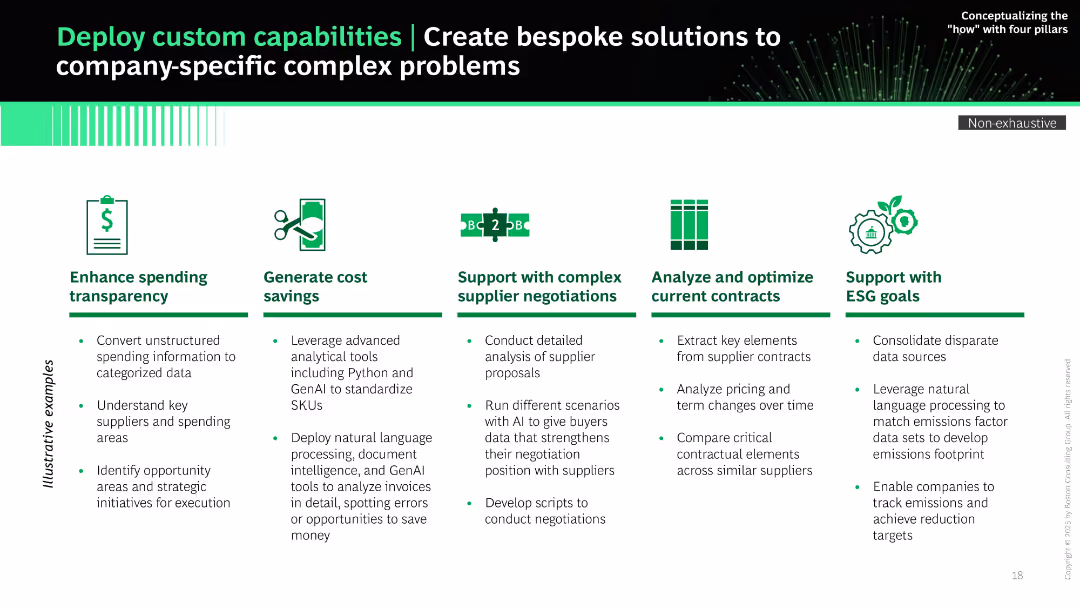
Horizontal layout with six icon-based segments; each column features a heading, icon, and bullet points under “Illustrative examples.” Green and black theme.
Product and Service Analysis
Technology & Software
The slide presents use cases for deploying custom capabilities using advanced analytics and GenAI to solve complex company-specific problems. It includes enhancing transparency, cost savings, supplier negotiation, contract optimization, and ESG goal support.
GenAI, custom solutions, supplier negotiations, ESG, analytics, Python, NLP, contract optimization
false
Product and Service Analysis
Technology & Software technology-and-software
Pillar
BCG
View slide
The slide features column charts identifying the departments across front and back office functions that are expected to realize the greatest time and cost savings from GenAI implementation, with a large image.
Customer and Market Segmentation
Financial Services
The slide identifies customer service, onboarding, risk management, and operations as the departments most impacted by GenAI, showing expected time and cost savings from its implementation.
GenAI, customer service, onboarding, risk management, operations
false
Customer and Market Segmentation
Financial Services financial-services
Multiple Chart
EY
View slide
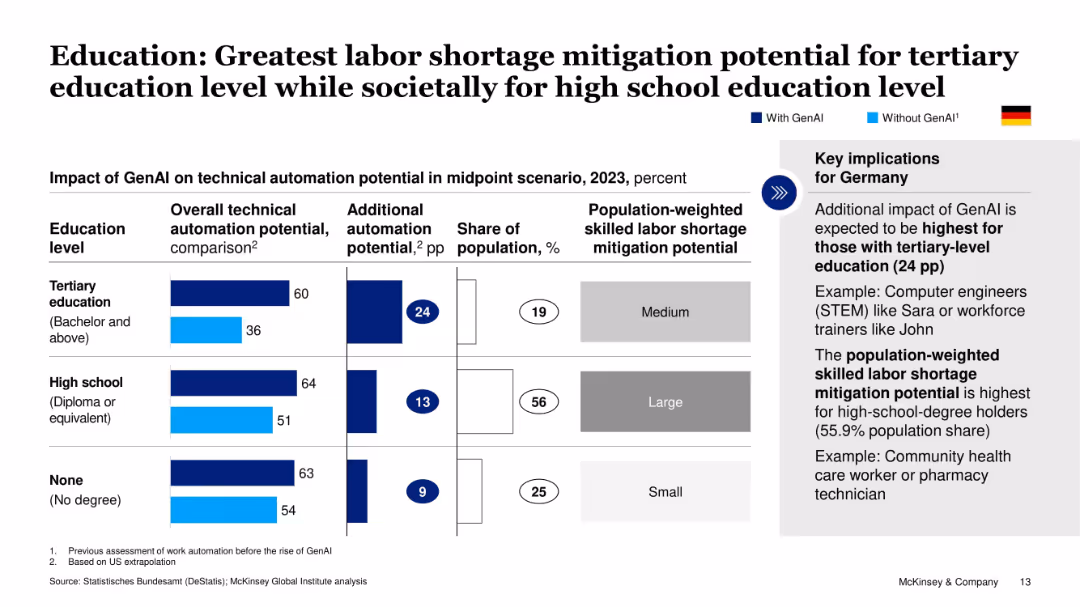
Bar chart and text comparing GenAI’s automation potential by education level (tertiary, high school, none), with implications for Germany.
Human Resources and Talent Management
Education & Training
This slide highlights GenAI’s potential to mitigate skilled labor shortages by education level. The greatest benefit is expected for tertiary-educated workers, though societal impact may be greater for high-school-educated populations.
GenAI, education levels, labor shortages, Germany, technical automation, tertiary education, McKinsey
false
Human Resources and Talent Management
Education & Training education-and-training
Table
McKinsey
View slide
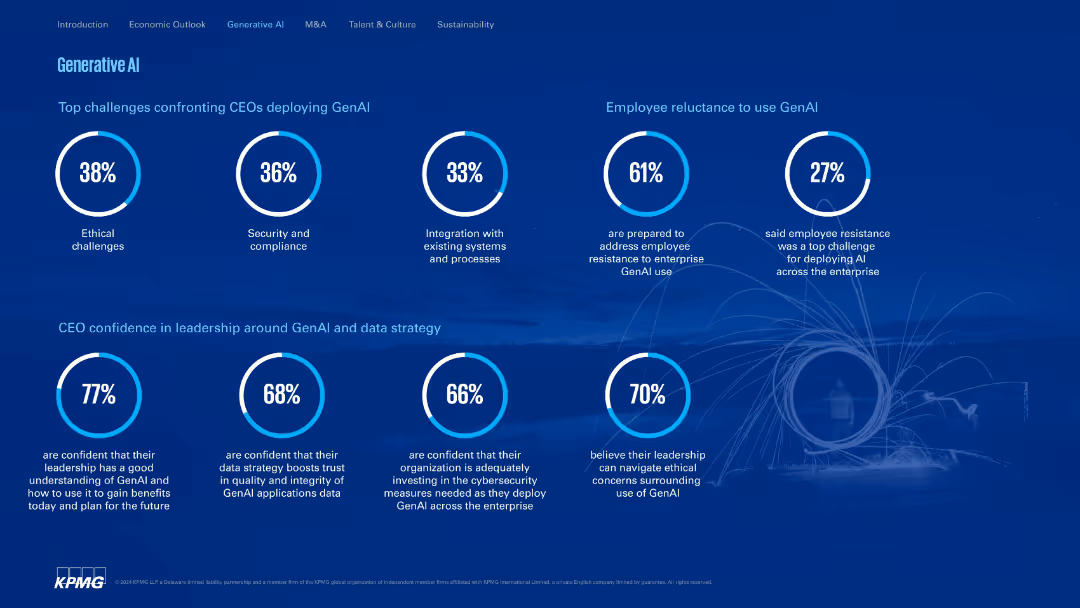
Clean, structured layout with donut charts and circular percentage visuals; dark blue background.
Technology and Digital Transformation
Artificial Intelligence
Addresses CEO concerns around GenAI deployment such as ethics, security, and employee resistance. Highlights leadership confidence in handling GenAI strategy and ethical navigation.
GenAI, ethics, compliance, integration, leadership, resistance, KPMG
false
Technology and Digital Transformation
Artificial Intelligence artificial-intelligence
Single Chart
KPMG
View slide
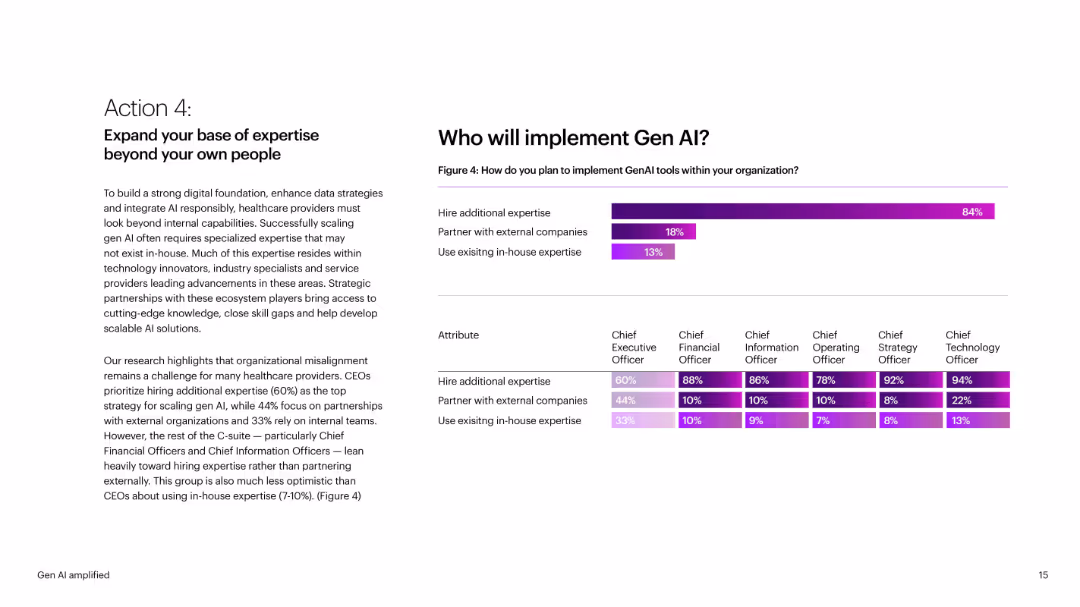
Left-aligned text block with strategic advice. Right side has bar chart and table segmented by C-suite role. Purple highlight bars and white background maintain consistency with brand theme.
Human Resources and Talent Management
Healthcare & Pharmaceuticals
Advises healthcare providers to expand expertise via hiring or partnerships. Provides stats showing that most plan to hire externally for GenAI implementation, with insights into CEO vs. CFO/CIO preferences. Highlights alignment challenges.
GenAI, expertise, hiring, partnerships, C-suite, healthcare, strategy
false
Human Resources and Talent Management
Healthcare & Pharmaceuticals healthcare-and-pharmaceuticals
Mixed Chart
Accenture
View slide
The slide has three charts: one showing the mobilization of GenAI teams, another on funding sources, and a third on budget allocation. Text provides additional insights into survey responses regarding GenAI team mobilization and funding.
Technology and Digital Transformation
Financial Services
This slide highlights survey findings on the mobilization and funding of GenAI teams. It discusses sources of funding and budget allocation for GenAI initiatives within financial services firms.
GenAI, funding, budget allocation, team mobilization, financial services, survey, technology
false
Technology and Digital Transformation
Financial Services financial-services
Multiple Chart
EY
View slide
The slide features two column charts. The left chart shows levels of concern about GenAI governance among various respondents, and the right chart shows the status of governance/risk frameworks among firms.
Risk Assessment and Management
Financial Services
This slide presents survey results on the concerns and actions regarding governance and risk frameworks related to Generative AI, highlighting differences across various financial institutions.
GenAI, governance, risk, survey, financial services, framework, column charts, respondents, firms, actions
false
Risk Assessment and Management
Financial Services financial-services
Multiple Chart
EY
View slide
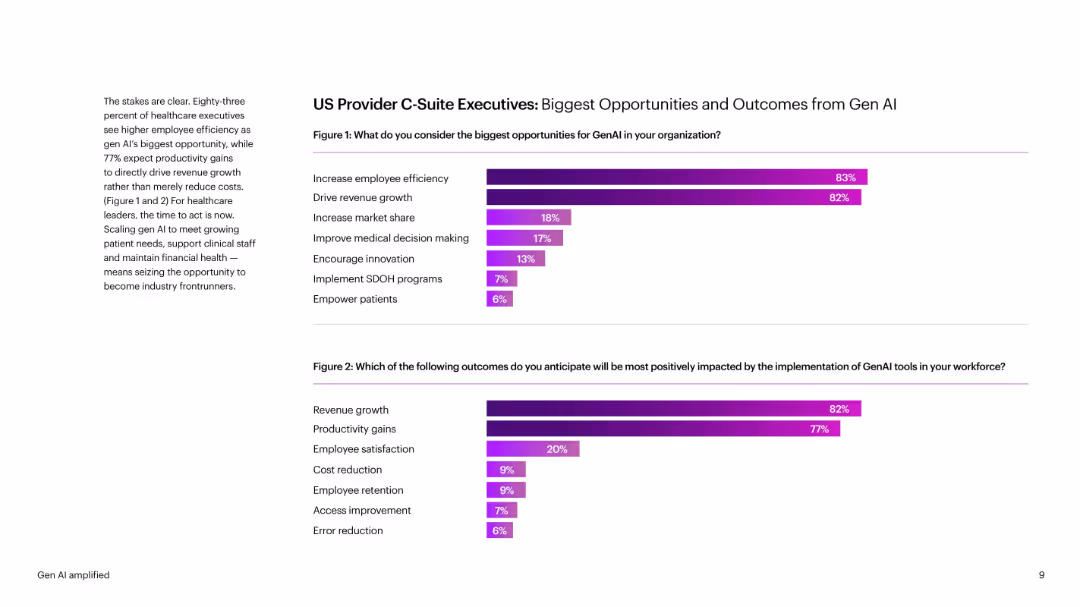
Side-by-side bar charts with percentages, purple gradient bars. Brief explanatory text on the left. Bold headings and clear labels enhance readability.
Technology and Digital Transformation
Healthcare & Pharmaceuticals
Shows healthcare executives’ views on GenAI benefits—primarily employee efficiency and revenue growth. Also shows anticipated outcomes like satisfaction and cost reduction. Provides quantitative survey data segmented by impact.
GenAI, healthcare, C-suite, productivity, revenue, satisfaction, decision-making
false
Technology and Digital Transformation
Healthcare & Pharmaceuticals healthcare-and-pharmaceuticals
Multiple Chart
Accenture
View slide
The slide includes a bar chart rating the impact of GenAI on various functions like client service, marketing, and compliance. Commentary at the bottom provides insights from different financial sectors.
Technology and Digital Transformation
Financial Services
This slide shows how Generative AI is expected to impact various business functions based on survey responses. It highlights significant changes anticipated in contact centers, client onboarding, and other areas.
GenAI, impact, business functions, client service, marketing, compliance, survey, financial services
false
Technology and Digital Transformation
Financial Services financial-services
Mixed Chart
EY
View slide
Two bar charts showing average annual capital and total factor productivity contributions to real potential GDP growth from 2020-25 and 2025-33, highlighting scenarios of trend, baseline, and optimistic growth.
Market Analysis and Trends
Financial Services
The slide highlights the potential boost to global economic growth from stronger investment and productivity growth driven by GenAI, with significant contributions expected across major economies.
GenAI, investment growth, productivity, GDP growth, economic forecast, 2025-33
false
Market Analysis and Trends
Financial Services financial-services
Multiple Chart
EY
View slide
Left: column chart on stage of investment by deposit size. Right: bar chart on funding sources for GenAI teams.
Technology and Digital Transformation
Financial Services
Indicates that 61% of banks have launched or soft-launched GenAI applications, funded mainly by IT/tech budgets.
GenAI, investment, deployment, IT funding, banking
false
Technology and Digital Transformation
Financial Services financial-services
Multiple Chart
EY
View slide
Blue-themed visual with a focus on bar graphs and circular stats. Stylized background image of light art.
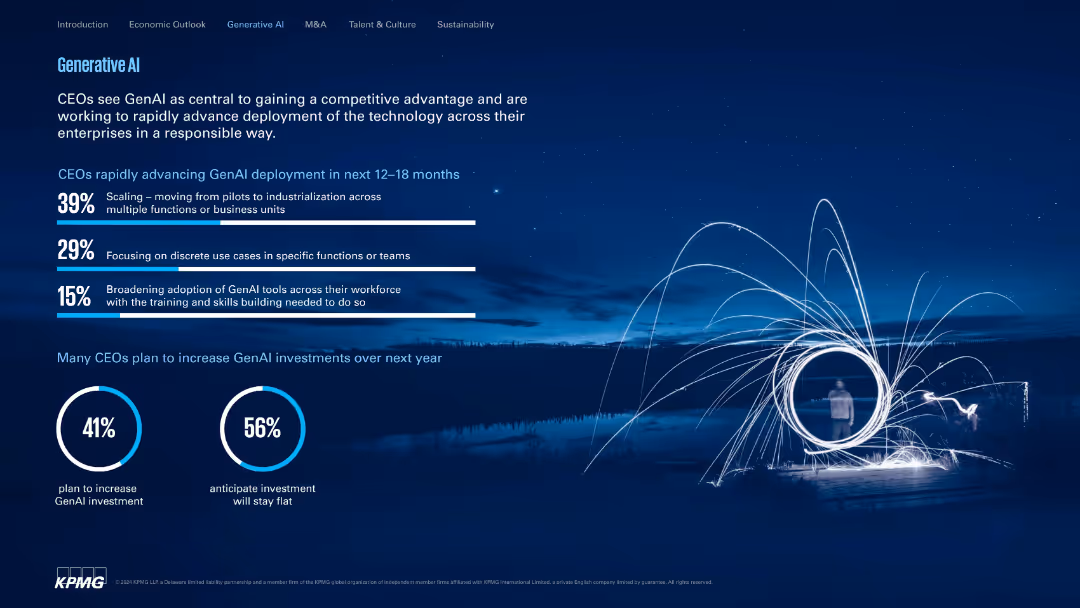
Technology and Digital Transformation
Artificial Intelligence
CEOs see GenAI as a strategic advantage. The slide shows deployment priorities over the next 12–18 months, such as scaling and use case focus, alongside planned investment outlooks for the year.
GenAI, investment, scaling, enterprise, AI adoption, strategy
false
Technology and Digital Transformation
Artificial Intelligence artificial-intelligence
Multiple Chart
KPMG
View slide
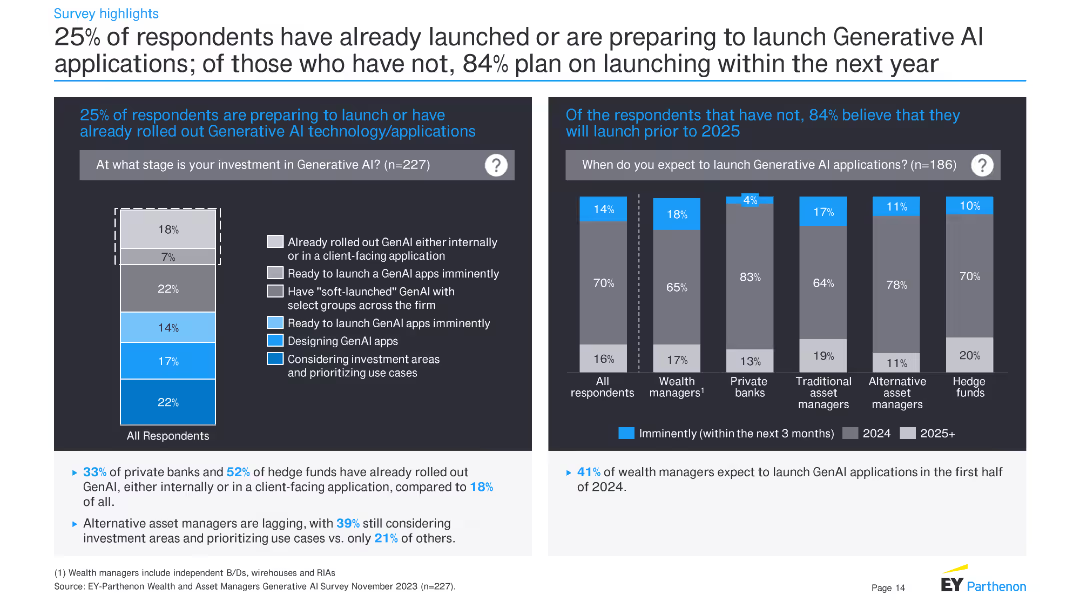
This slide contains two bar charts: one showing the stages of investment in GenAI applications and another on the expected timeline for launching GenAI applications. Text explains survey responses regarding investment and launch plans.
Technology and Digital Transformation
Financial Services
The slide presents survey data on the stages of investment in GenAI applications and expected timelines for launching these applications. It provides insights into the current state and future plans for GenAI adoption.
GenAI, investment, stages, launch plans, financial services, survey, technology, adoption
false
Technology and Digital Transformation
Financial Services financial-services
Multiple Chart
EY
View slide
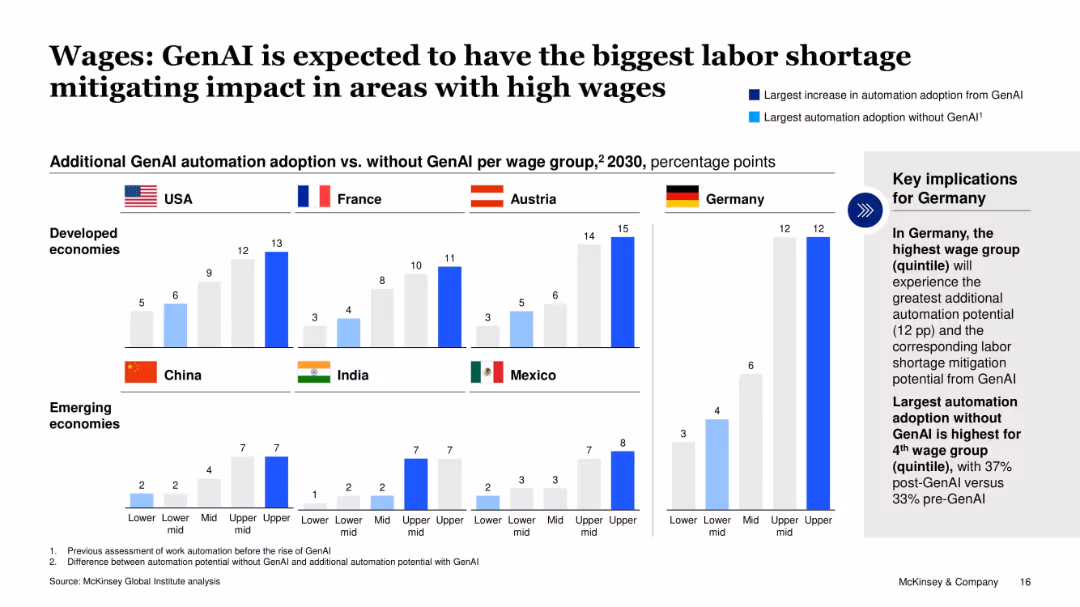
Comparative bar charts showing GenAI-driven automation adoption by wage group and country; includes key takeaway box for Germany.
Strategic Planning
Artificial Intelligence
The slide illustrates how GenAI adoption will disproportionately impact high-wage groups across various developed and emerging economies, particularly in Germany, by mitigating labor shortages. It contrasts automation potential with and without GenAI, showing significant gains in higher wage quintiles.
GenAI, labor shortage, automation, wage groups, Germany, high-income, workforce, 2030, impact
false
Strategic Planning
Artificial Intelligence artificial-intelligence
Mixed Chart
McKinsey
View slide
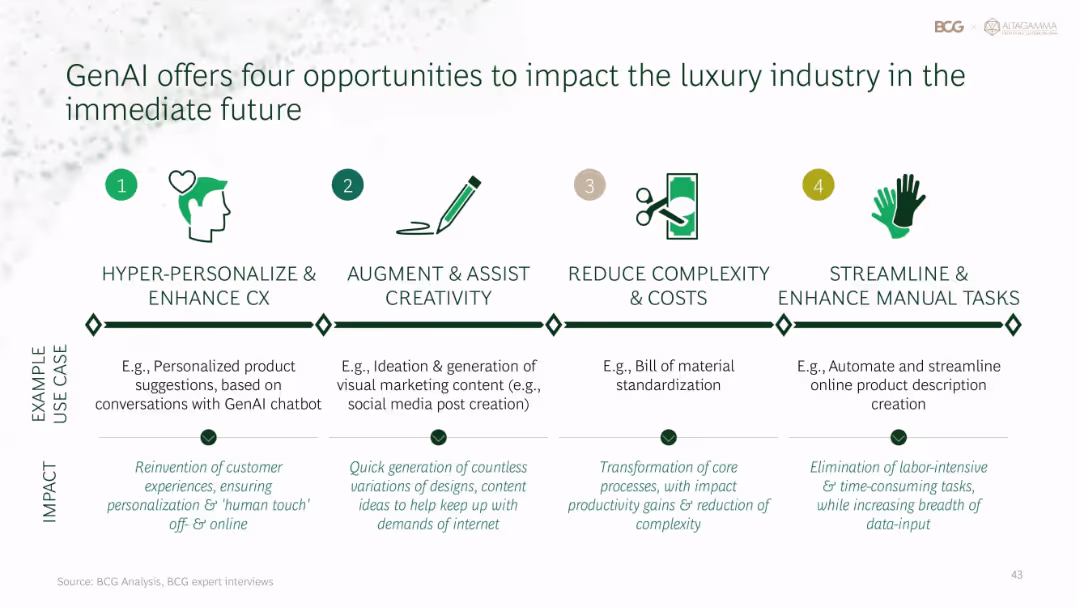
Four-column horizontal layout with icons, labels, examples, and impact text beneath each opportunity
Technology and Digital Transformation
Artificial Intelligence
GenAI can reshape luxury through: 1) hyper-personalized customer experience, 2) creativity augmentation, 3) process simplification, and 4) manual task automation. Use cases range from product recommendations to marketing content and e-commerce automation.
GenAI, luxury industry, personalization, automation, creativity, process improvement
false
Technology and Digital Transformation
Artificial Intelligence artificial-intelligence
Pillar
BCG
View slide
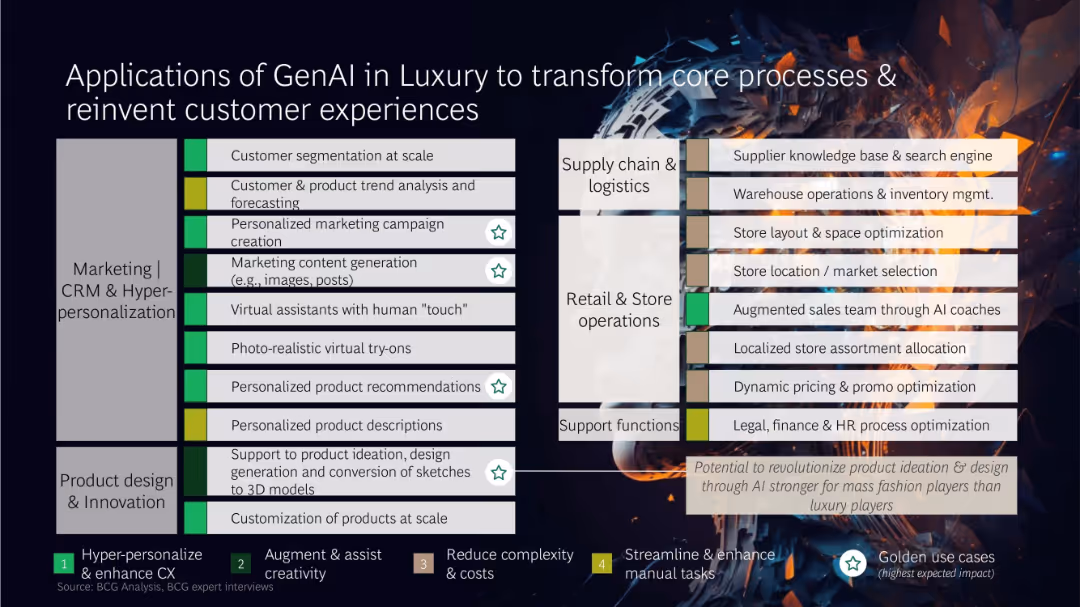
Matrix layout categorizing GenAI use cases across business functions, with color-coded impact labels and icons
Technology and Digital Transformation
Artificial Intelligence
This slide presents a comprehensive matrix of GenAI applications across marketing, product design, retail operations, supply chain, and support functions. High-impact use cases include dynamic pricing, AI-assisted sales, and virtual try-ons, transforming both front-end and back-end operations.
GenAI, luxury, CRM, product design, automation, customer experience, AI use cases
false
Technology and Digital Transformation
Artificial Intelligence artificial-intelligence
Table
BCG
View slide
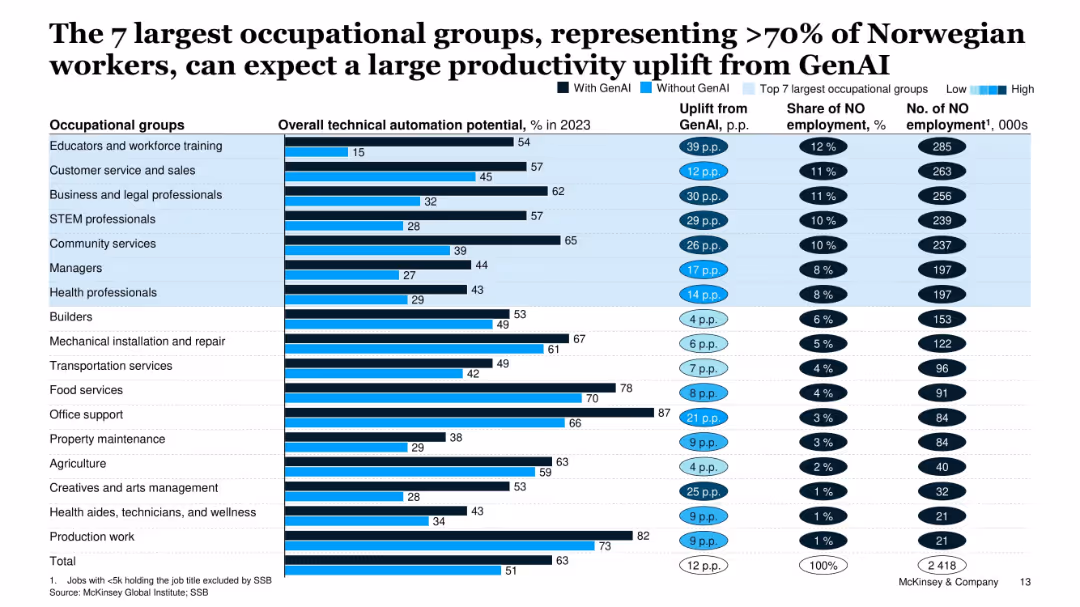
Extensive table layout showing automation potential uplift for major job groups, with % automation, employment share, and uplift from GenAI.
Human Resources and Talent Management
Artificial Intelligence
The slide evaluates the impact of GenAI on the top 7 occupational groups in Norway, which comprise over 70% of the workforce. It shows varying automation potentials and expected productivity gains.
GenAI, occupational groups, productivity uplift, automation, employment, Norway, workforce
false
Human Resources and Talent Management
Artificial Intelligence artificial-intelligence
Single Chart
McKinsey
View slide
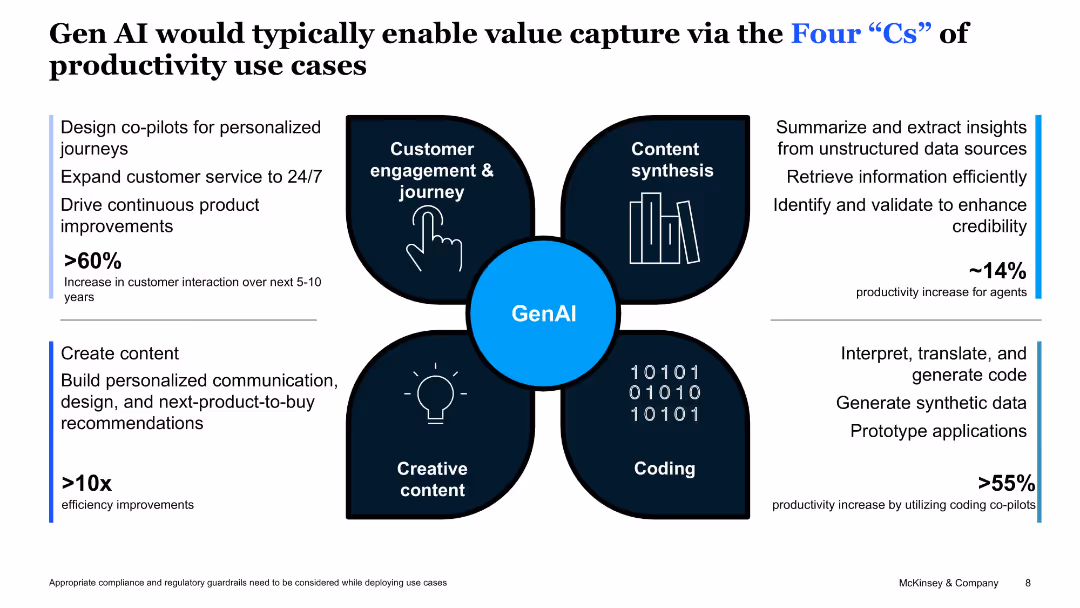
Visual flower-petal-style quadrant illustrating Gen AI use cases: Customer Engagement, Content Synthesis, Creative Content, Coding.
Operational Efficiency
Artificial Intelligence
The slide illustrates four key use cases of Gen AI—enhancing customer interaction, content summarization, personalized content generation, and automated coding—with measurable productivity improvements in each domain.
GenAI, productivity, customer engagement, coding, content, value capture, use cases
false
Operational Efficiency
Artificial Intelligence artificial-intelligence
Framework
McKinsey
View slide
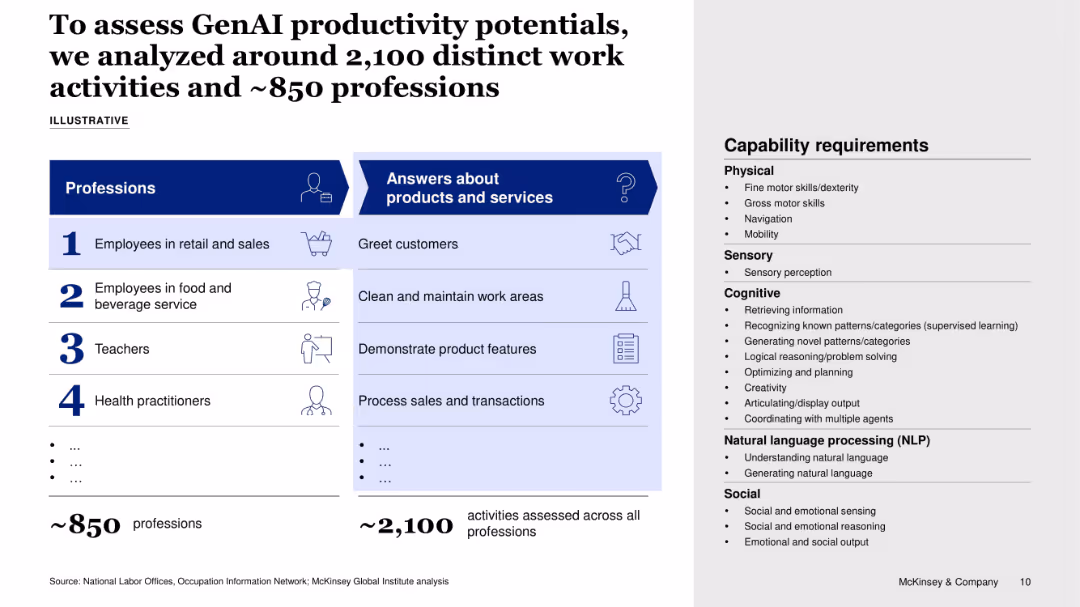
Two-part slide: left side shows professions and related work tasks; right side outlines required capabilities grouped into categories (Physical, Sensory, Cognitive, NLP, Social).
Technology and Digital Transformation
Artificial Intelligence
This slide presents a framework for evaluating GenAI’s productivity potential across ~850 professions and ~2,100 work activities, linking tasks like greeting customers or processing transactions to required physical, cognitive, and social capabilities.
GenAI, productivity, task automation, professions, capabilities, workforce analysis, McKinsey, skills taxonomy
false
Technology and Digital Transformation
Artificial Intelligence artificial-intelligence
Boxed
McKinsey
View slide
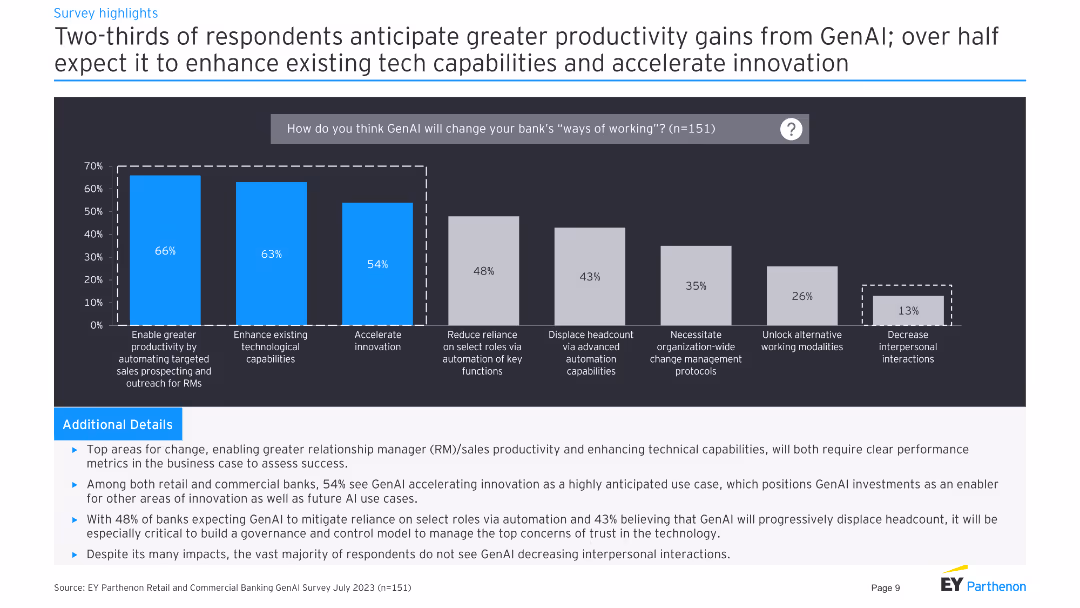
The slide features column charts showing anticipated changes in banks' working methods due to GenAI, focusing on productivity, technological capabilities, and innovation.
Technology and Digital Transformation
Financial Services
The slide discusses the anticipated productivity gains and technological advancements that banks expect from implementing GenAI solutions, based on a survey of respondents.
GenAI, productivity, technology, innovation, banks
false
Technology and Digital Transformation
Financial Services financial-services
Mixed Chart
EY
View slide
Three-part layout with icon-based headers, three data visualizations (bar chart, line graph, pie chart). Strong purple highlights and white space separate sections clearly.
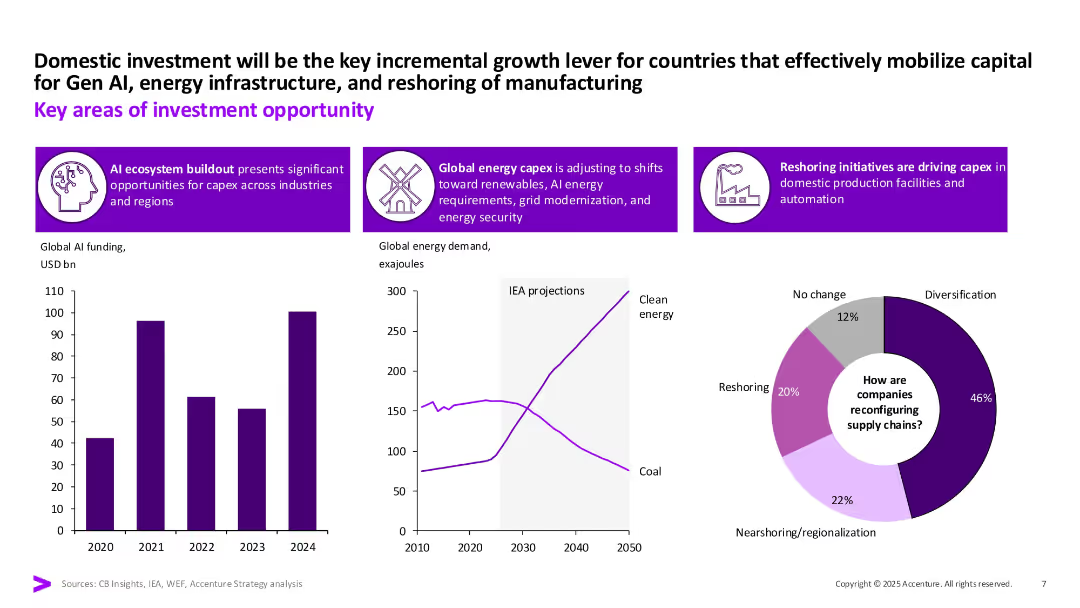
Strategic Planning
Financial Services
Identifies domestic investment drivers such as GenAI, energy capex, and reshoring. Uses data visualizations to support claims around AI funding, clean energy demand, and supply chain diversification strategies.
GenAI, reshoring, clean energy, capex, investment, supply chains, diversification
false
Strategic Planning
Financial Services financial-services
Multiple Chart
Accenture
View slide
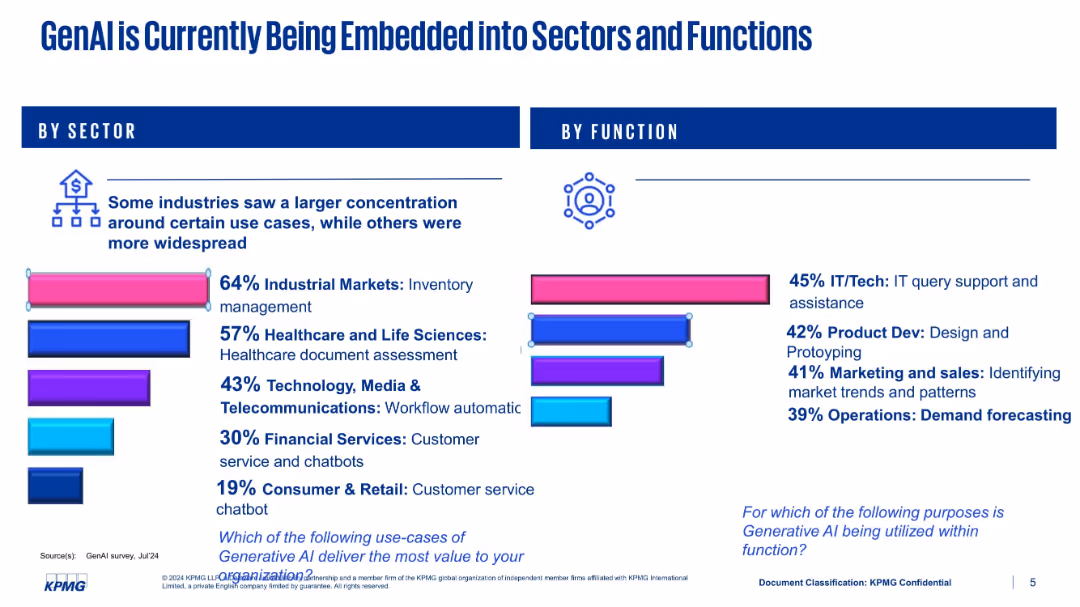
Two-column layout with horizontal bars showing % usage by sector (left) and function (right); icons and text explanations
Strategic Planning
Artificial Intelligence
This slide illustrates how Generative AI (GenAI) is being integrated across different sectors and functions. The left column breaks down usage by industry sector (e.g., Industrial, Healthcare), while the right column shows key functional applications such as IT support, marketing, and operations.
GenAI, sectors, functions, IT, healthcare, operations, KPMG, usage stats
false
Strategic Planning
Artificial Intelligence artificial-intelligence
Single Chart
KPMG
View slide
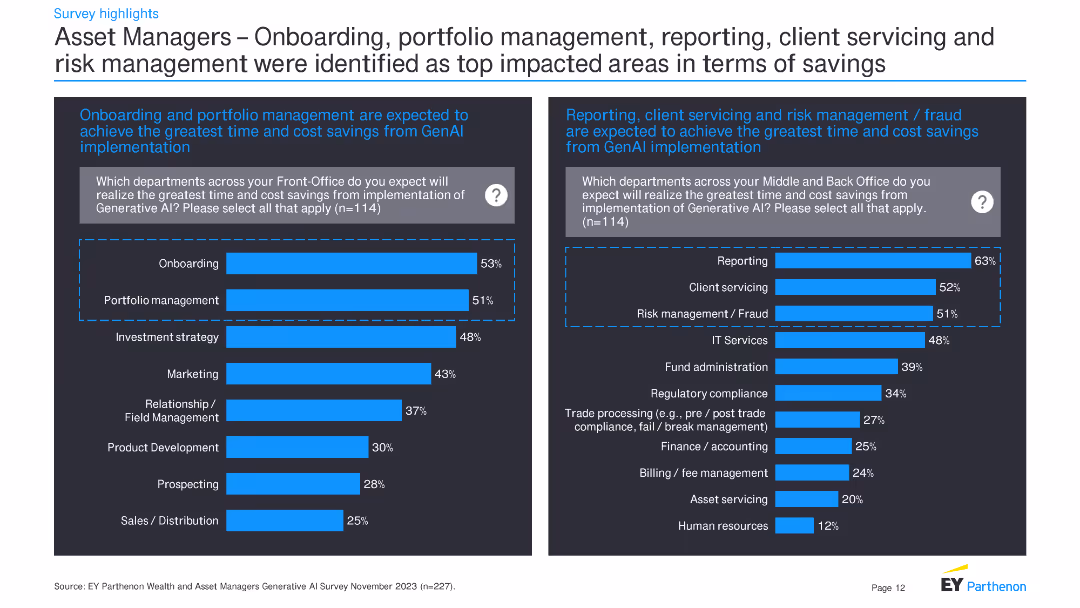
This slide contains two bar charts showing which departments in asset management expect the greatest time and cost savings from GenAI implementation. Additional text provides context and detailed survey findings.
Operational Efficiency
Financial Services
The slide presents survey data on anticipated time and cost savings in asset management from GenAI implementation. It focuses on departments like onboarding, portfolio management, and reporting.
GenAI, time savings, cost savings, asset management, onboarding, portfolio management, reporting, survey
false
Operational Efficiency
Financial Services financial-services
Multiple Chart
EY
View slide
The slide features two bar charts showing which departments in wealth management expect the greatest time and cost savings from GenAI implementation. Text below provides further context and additional details on survey findings.
Operational Efficiency
Financial Services
This slide highlights survey results on time and cost savings expected in wealth management from GenAI implementation. It identifies client onboarding, marketing, and report generation as key areas of impact.
GenAI, time savings, cost savings, wealth management, client onboarding, marketing, report generation, survey
false
Operational Efficiency
Financial Services financial-services
Multiple Chart
EY
View slide
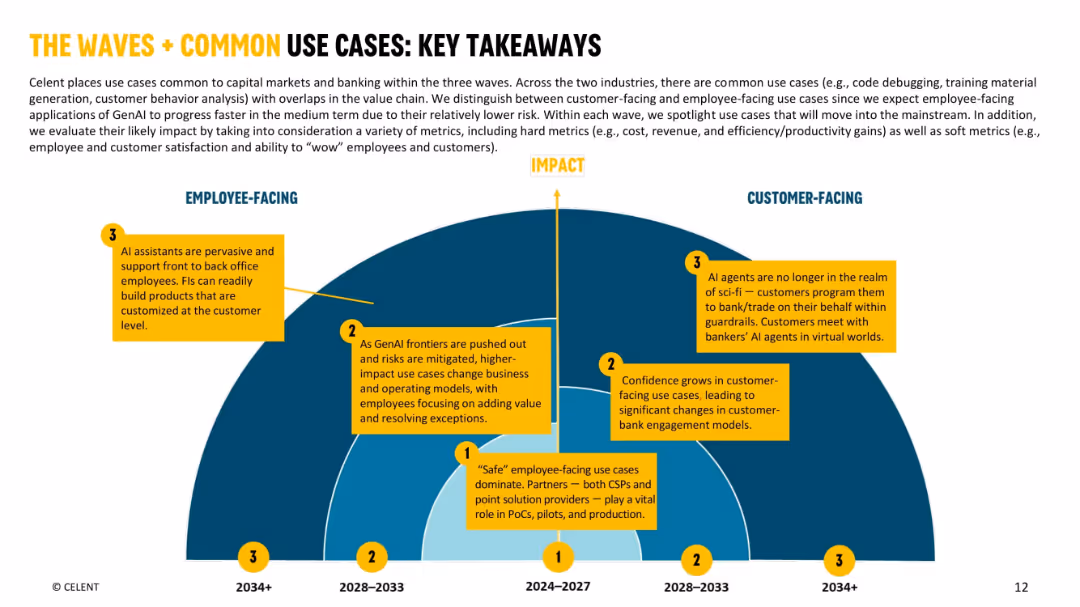
Split semi-circular timeline chart, split vertically into Employee-Facing and Customer-Facing sides. Each side shows three "waves" of AI use case adoption, spanning from 2024 to beyond 2034. Uses orange and yellow annotation boxes and labeled arrows.
Strategic Planning
Financial Services
The slide explains how AI use cases evolve across capital markets and banking from 2024 onward, divided into employee-facing and customer-facing tracks. Each wave indicates increasing complexity and impact. It outlines GenAI’s role in cost reduction, revenue improvement, and engagement by wave progression, highlighting differences between front and back-office transformations.
GenAI, timeline, employee-facing, customer-facing, AI adoption, financial institutions, transformation, impact, banking
false
Strategic Planning
Financial Services financial-services
Single Chart
Oliver Wyman
View slide
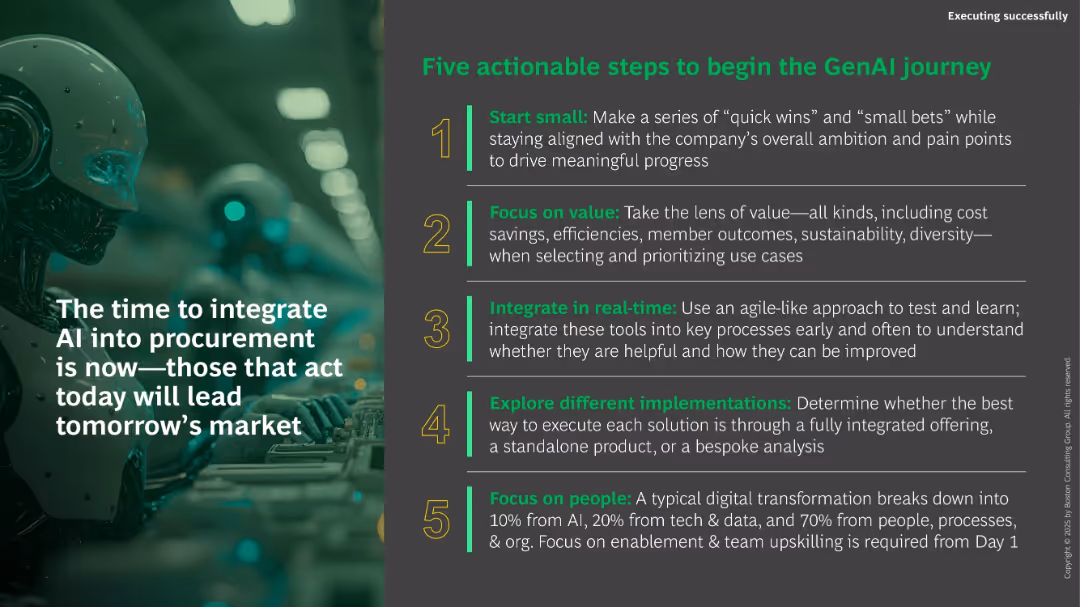
Dark background with large image of a robot. Right panel lists five numbered green/yellow-highlighted steps. Bold, motivational tone.
Strategic Planning
Technology & Software
This motivational closing slide presents five steps for starting a GenAI journey, including starting small, focusing on value, real-time integration, trying multiple approaches, and prioritizing people. It encourages immediate action to lead in tomorrow’s AI-enabled procurement market.
GenAI, transformation, procurement, roadmap, strategy, implementation, action steps, people focus
false
Strategic Planning
Technology & Software technology-and-software
Vertical Flow
BCG
View slide
The slide includes two charts: one on the number of GenAI use cases identified, and the other on the viability of full automation with GenAI. Text details the survey responses and projections for automation in the next five years.
Technology and Digital Transformation
Financial Services
This slide discusses the number of identified GenAI use cases and the viability of full automation within firms. It presents data on current and future expectations of automation viability across various financial sectors.
GenAI, use cases, automation, viability, financial services, survey, projections, technology
false
Technology and Digital Transformation
Financial Services financial-services
Multiple Chart
EY
View slide
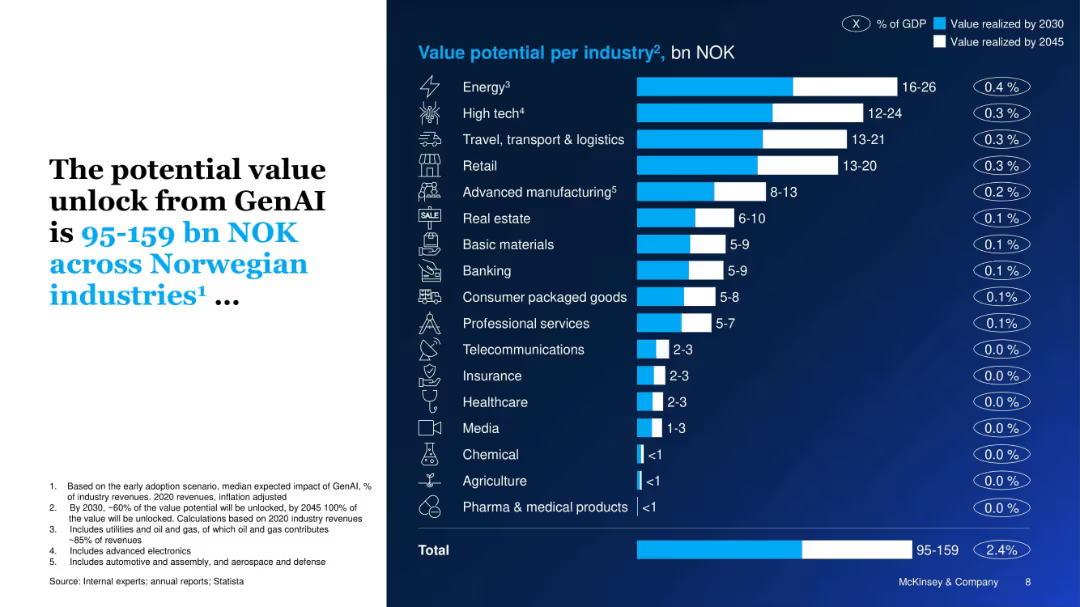
Horizontal bar chart showing GenAI value potential across industries, color-coded by realization year (2030 vs 2045). Text block on left provides context.
Investment Analysis
Artificial Intelligence
This slide quantifies the potential economic value GenAI could unlock across Norwegian industries, estimating a total of NOK 95–159 billion by 2045, with energy, high tech, and logistics leading.
GenAI, value creation, Norway, industries, economic impact, NOK, energy, manufacturing, adoption
false
Investment Analysis
Artificial Intelligence artificial-intelligence
Single Chart
McKinsey
View slide
The slide has multiple charts and diagrams illustrating wealth and asset managers' growing interest in Generative AI (GenAI) solutions. It includes pie charts, bar charts, and text explaining the benefits and investment in GenAI.
Technology and Digital Transformation
Financial Services
The slide highlights survey findings on the adoption of GenAI solutions by wealth and asset managers. It details the benefits of GenAI, investment plans, and the anticipated impact on various aspects of financial services.
GenAI, wealth managers, asset managers, investment, benefits, AI adoption, financial services, survey, impact
false
Technology and Digital Transformation
Financial Services financial-services
Multiple Chart
EY
Previous
Loading...
Hold On!
We are searching in our database
If nothing, comes up, please try different filters!
Column Chart
Heatmap
Chevron
Org Chart
Infographic
Callouts
Timeline
List
Graphic
Picture
Process Flow
Diagram
Paragraph
Map
Table
Framework
Subtitle
Takeaway Box
Icon
Other Chart
Radar Chart
Waterfall Chart
Mekko Chart
Pie Chart
Scatter Plot
Line Chart
Bar chart
Bullet points
Create a FREE account to continue browsing
Receive Instant Access to 1,000+ slides from companies like McKinsey, Google, and Goldman Sachs
First Name
Last Name
Email
Password
I agree to all
Terms & Privacy Policy
Thank you! Your submission has been received!
Oops! Something went wrong while submitting the form.
Have an account?
Sign in
Upgrade to PRO to Save slides
Advanced Search and Filters
Access to 15,000+ slides
Access to Category Pages
Save/Bookmark Slides
PowerPoint Template Library
Pick a Plan
MONTHLY
$12/month
Billed every month, Cancel anytime.
YEARLY
$9/year
Billed $108 annually, Cancel anytime.
Checkout for $12/month
Checkout for $108/yr
Secured by Stripe | AES-256 bit encryption