My Account
My Slides
Search by Category
Templates
View All Templates
Download Template Slides
Leave Feedback
Login
Logout
Get Started
Browse all Slides
Browse all Slides
Create a FREE Account
Instant access to 1,000+ real slides from top companies like McKinsey, BCG, Goldman Sachs, Google and many more!
First Name
Last Name
Email
Password
I agree to all
Terms & Privacy Policy
Thank you! Your submission has been received!
Oops! Something went wrong while submitting the form.
Have an account?
Sign in
Spark Your Next Big Idea with New Presentation Templates
VIEW ALL Templates
Welcome,
Welcome
PRO
Show Featured Only
Checkbox 8
Companies
Mckinsey
Bain
BCG
EY
Deloitte
Accenture
PwC/Strategy&
JP Morgan
Goldman Sachs
Morgan Stanley
Citigroup
Deutsche Bank
Barclays
LEK
KPMG
Kearney
Oliver Wyman
Booz Allen Hamilton
Gartner
IPSOS
Nielsen
Slide type
Text Only
Linear Flow
Vertical Flow
Single Chart
Header Horizontal
Mixed Chart
Header Vertical
Pillar
Multiple Chart
Graphic
Agenda
Title
Table
Framework
Industry
Technology & Software
Artificial Intelligence
Financial Services
Retail & E-commerce
Consumer Goods
Industrial & Manufacturing
Transportation & Logistics
Telecommunications
Real Estate & Construction
Hospitality & Tourism
Professional Services
Education & Training
Media & Entertainment
Agriculture & Food Production
Healthcare & Pharmaceuticals
Environmental Services & Sustainability
Government & Public Sector
Use Case
Mergers and Acquisitions
Performance Metrics and KPIs
Client Case Studies
Competitive Landscape
Corporate Finance and Valuation
Product and Service Analysis
Customer and Market Segmentation
Organizational Structure and Change
Industry Overview
Regulatory and Compliance
Risk Assessment and Management
Investment Analysis
Organizational Structure and Change
Human Resources and Talent Management
Financial Performance
Market Analysis and Trends
Sales and Business Development
Human Resources and Talent Management
Clear all
Thank you! Your submission has been received!
Oops! Something went wrong while submitting the form.
Tag
View slide
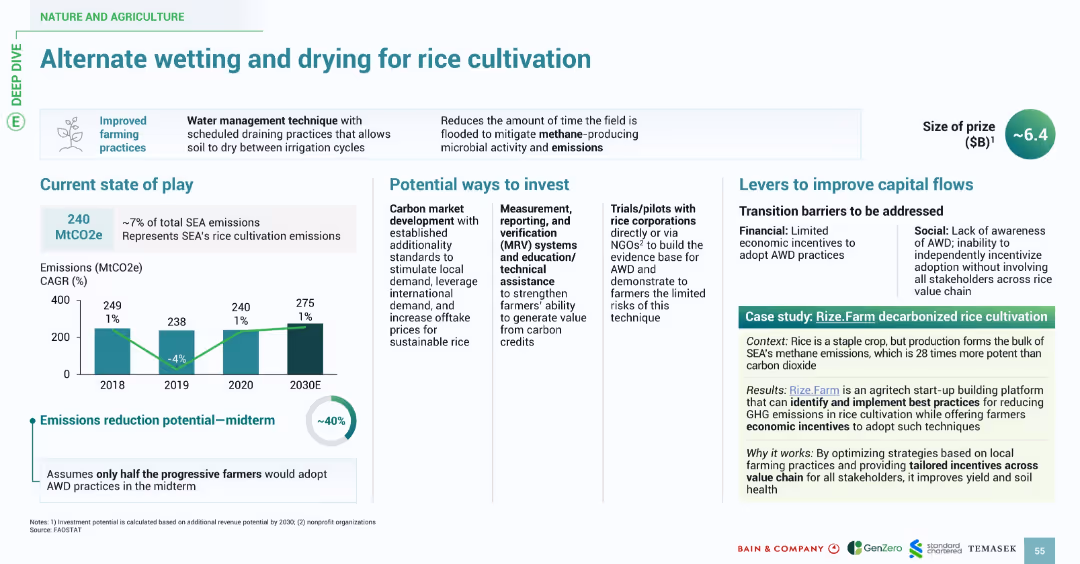
Split into sections with icons and clearly labeled headings. Includes bar chart (emissions), bullet-point lists, and a case study box. Color accents in green and teal reinforce environmental theme.
Operational Efficiency
Agriculture & Food Production
This slide promotes a water management technique for rice cultivation in Southeast Asia (SEA) that reduces methane emissions. It outlines current emissions levels, potential investment pathways, emission reduction potential (~40%), and implementation challenges. A case study (Rize.Farm) demonstrates how optimized local farming practices and incentives can improve soil health and reduce GHG emissions.
AWD, rice cultivation, methane, emissions, investment, case study, farming, SEA, carbon
false
Operational Efficiency
Agriculture & Food Production agriculture-and-food-production
Multiple Chart
Bain
View slide
This slide has multiple column charts displaying revenue, income, and assets, with key financial metrics highlighted on the right.
Financial Performance
Financial Services
Demonstrates consistent growth in Asset Wealth Management, represented by yearly performance data and growth trends in bar graphs, intending to convey JPMorgan's financial stability and success over a decade.
AWM, financial performance, growth, JPMorgan, bar graphs
false
Financial Performance
Financial Services financial-services
Multiple Chart
JP Morgan
View slide
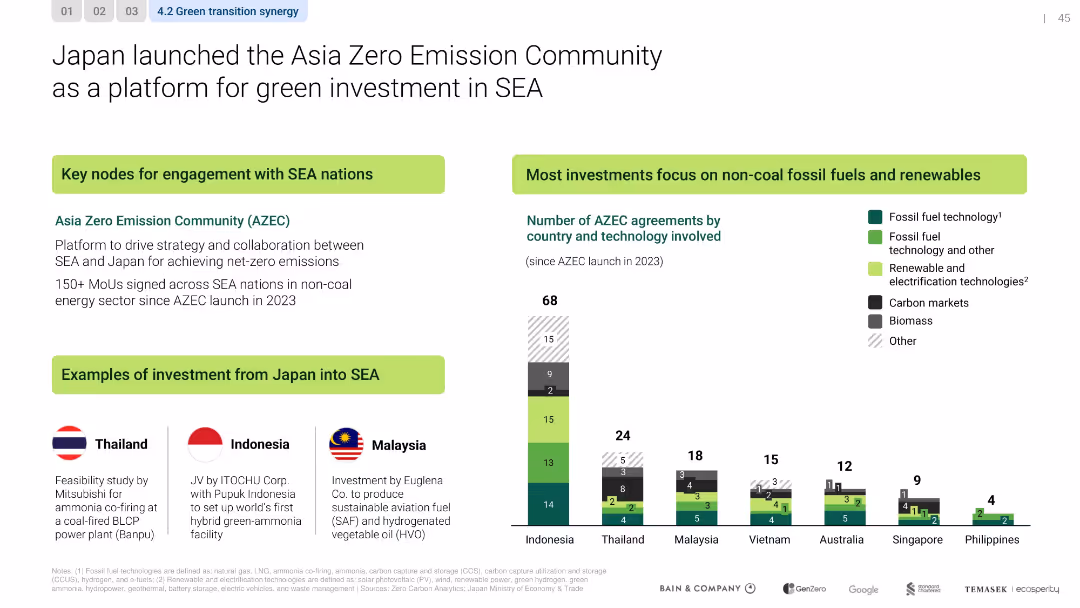
Sectioned layout with bar chart, flag-labeled investment examples, and callout boxes
Strategic Planning
Government & Public Sector
The slide introduces Japan’s Asia Zero Emission Community initiative, promoting over 150 MoUs across SEA in green sectors. Investment examples are provided by country, with a strong emphasis on renewables and fossil alternatives.
AZEC, Japan, SEA, renewable energy, MoUs, net-zero, policy, investment
false
Strategic Planning
Government & Public Sector government-and-public-sector
Mixed Chart
Bain
View slide
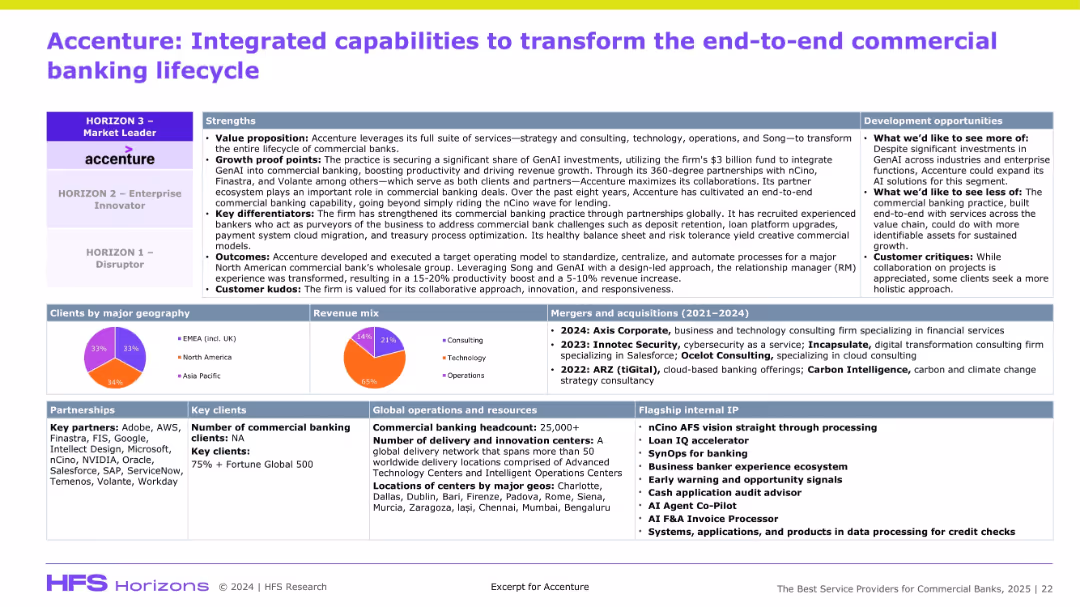
Dense slide divided into multiple boxed sections: strengths, clients by geography, revenue mix, partnerships, acquisitions, internal capabilities, and flagship IP. Uses colorful pie charts and icons with a corporate report-style layout.
Product and Service Analysis
Professional Services
The slide details Accenture’s strategic capabilities in commercial banking, emphasizing GenAI integration, ecosystem partnerships, revenue sources, and operational footprint. It highlights Accenture’s positioning as a market leader, key acquisitions, and its geographic and technological depth in banking services.
Accenture, Commercial Banking, GenAI, Partnerships, Revenue Mix, Strategy, M&A, Flagship IP, Digital, Operations
false
Product and Service Analysis
Professional Services professional-services
Mixed Chart
Accenture
View slide
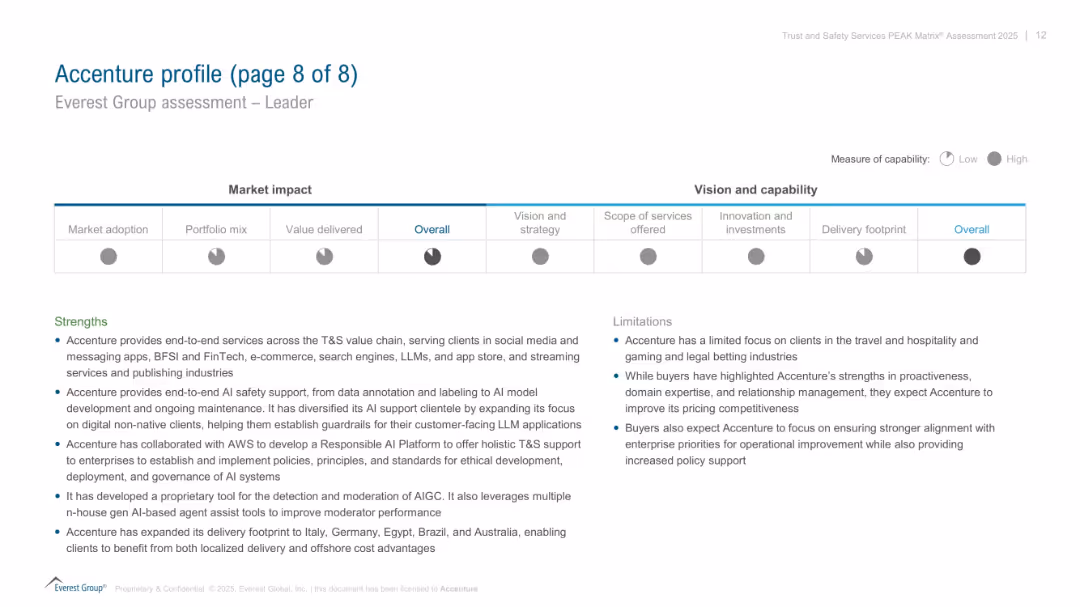
Split layout: radar-style visual for capabilities (top), text sections for strengths and limitations (bottom); corporate and professional style.
Competitive Landscape
Technology & Software
Final profile summary of Accenture in the PEAK Matrix assessment. Visualizes its performance across several dimensions (vision, services, investments). Text highlights Accenture’s strengths in AI safety and end-to-end solutions, with noted client and pricing focus limitations.
Accenture, PEAK Matrix, AI safety, capabilities, limitations, client focus, strengths
false
Competitive Landscape
Technology & Software technology-and-software
Mixed Chart
Accenture
View slide
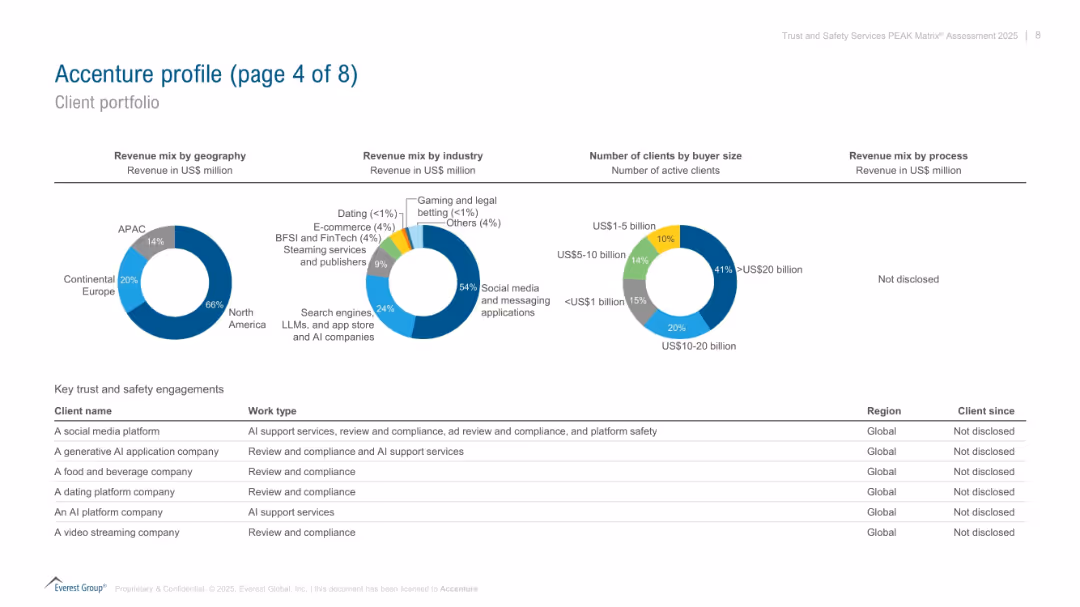
Combination of three pie charts (revenue breakdown by geography, industry, buyer size) and client list table below; data-rich and structured.
Client Case Studies
Technology & Software
Analyzes Accenture’s client portfolio in trust and safety services, with breakdowns by geography, industry, and client size. Lists sample client engagements across social media, AI platforms, streaming, and more, without disclosing client names.
Accenture, client portfolio, trust and safety, revenue, AI, industry breakdown, client size
false
Client Case Studies
Technology & Software technology-and-software
Mixed Chart
Accenture
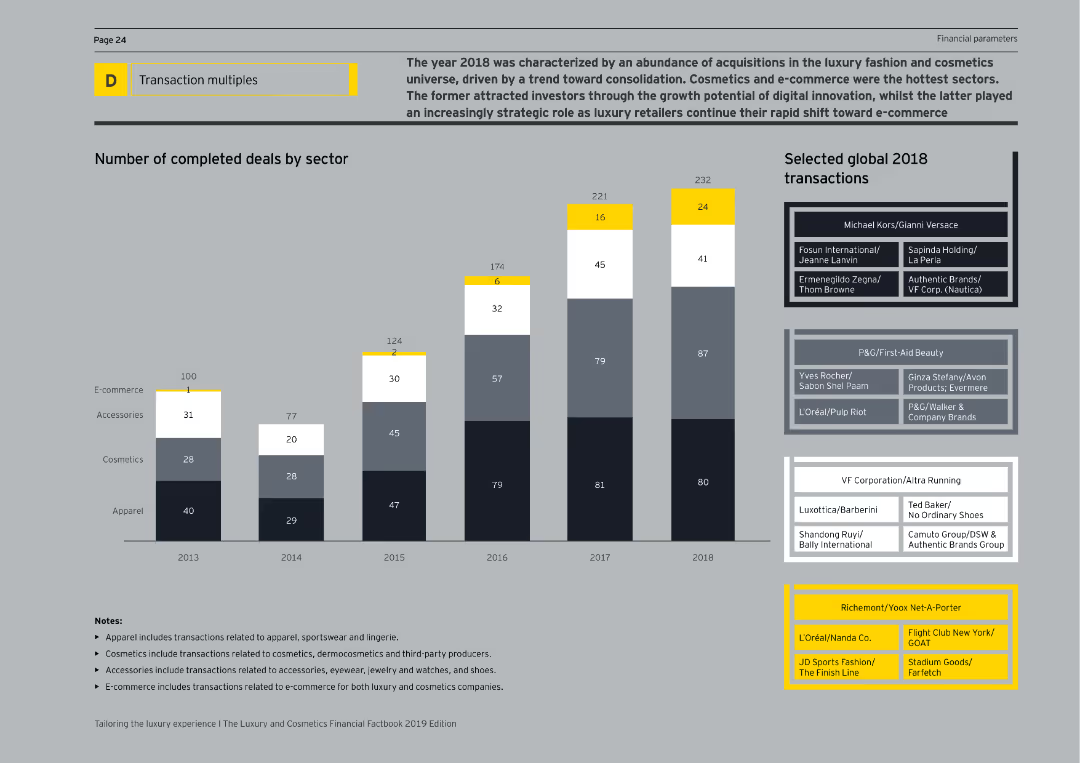
View slide
The slide features a column chart displaying the number of completed deals by sector from 2013 to 2018, and a list of selected global 2018 transactions on the right. The visual complexity is moderate, with clear labels and sector breakdowns.
Mergers and Acquisitions
Consumer Goods
The slide summarizes the acquisition activities in the luxury fashion and cosmetics sectors for 2018, highlighting the number of deals completed in various sectors such as e-commerce, accessories, cosmetics, and apparel, along with notable global transactions.
Acquisitions, Luxury, Fashion, Cosmetics, Deals
false
Mergers and Acquisitions
Consumer Goods consumer-goods
Mixed Chart
EY
View slide
The slide includes a quote, a bar chart, and a conclusion section. The background features an abstract visual with a burst of colors.
Mergers and Acquisitions
Financial Services
The slide discusses the role of communication teams in acquisitions, emphasizing their importance throughout the transaction lifecycle.
Acquisitions, communication, stakeholder, HR, IR, integration, synergies, corporate, lifecycle, challenges
false
Mergers and Acquisitions
Financial Services financial-services
Mixed Chart
IPSOS
View slide
The slide features text with a survey bar chart and an image illustrating the importance of communication in acquisitions and stakeholder management.
Mergers and Acquisitions
Professional Services
Analyzes the role of corporate communications in successful acquisitions, emphasizing the need for stakeholder management and communication strategies.
Acquisitions, stakeholder communication, survey, mergers, corporate strategy
false
Mergers and Acquisitions
Professional Services professional-services
Mixed Chart
IPSOS
View slide
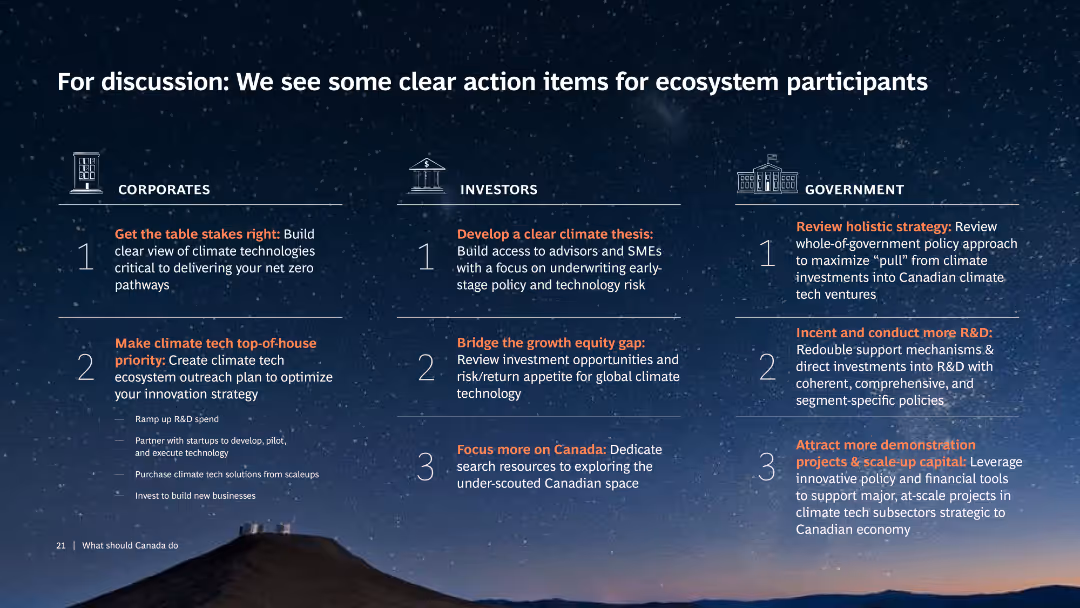
Three-column layout with headings: Corporates, Investors, Government. Each column lists action items with icons and text, over a starry night background.
Strategic Planning
Environmental Services & Sustainability
The slide outlines specific actions for corporates, investors, and government to support ecosystem participants in achieving climate goals.
Action items, Climate tech, Corporates, Investors, Government
false
Strategic Planning
Environmental Services & Sustainability environmental-services-and-sustainability
Pillar
BCG
View slide
This slide uses a mix of text and simple graphics to outline three main actions: leadership commitment, allyship, and employee-centric programs. It has a clean and organized layout.
Human Resources and Talent Management
Government & Public Sector
The slide provides actionable steps for corporate Canada to enhance diversity and inclusion: fostering leadership commitment, promoting allyship, and implementing employee-centric programs.
Actionable Steps, Leadership, Allyship, Employee-Centric, Diversity, Inclusion, Corporate Canada, Commitment, Programs
false
Human Resources and Talent Management
Government & Public Sector government-and-public-sector
Boxed
BCG
View slide
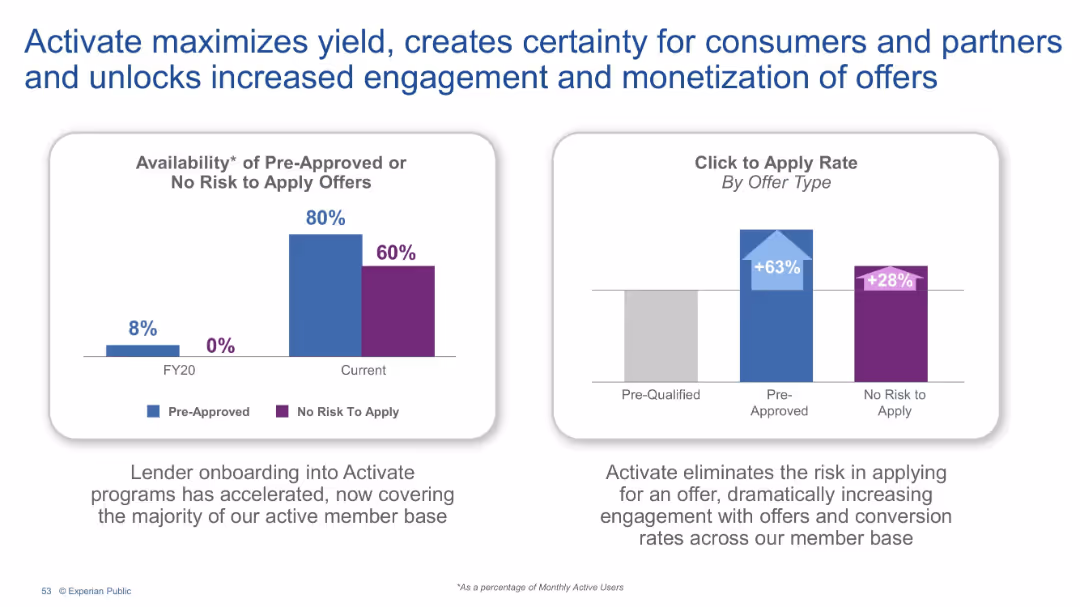
Two bar charts comparing FY20 to current data. Left: availability of pre-approved offers. Right: click-to-apply rates by offer type. Text explanation below.
Pricing Strategies
Financial Services
This slide showcases the impact of Activate, Experian's program that improves offer clarity and reduces application risks. With increased pre-approval availability and click-through rates, Activate drives stronger partner engagement and consumer conversion.
Activate, Pre-approved offers, Monetization, Consumer engagement, Click rate, Offer certainty
false
Pricing Strategies
Financial Services financial-services
Multiple Chart
Barclays
View slide
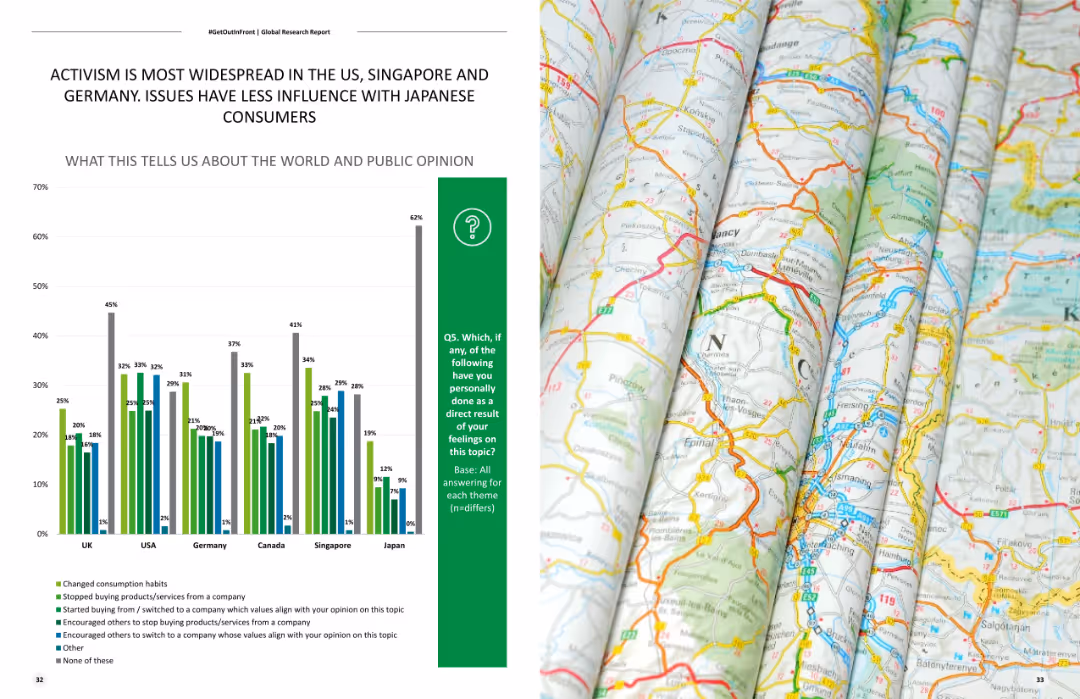
Shows a column chart comparing levels of activism across different countries, highlighting the differences in public engagement with various social issues.
Market Analysis and Trends
Government & Public Sector
Compares levels of activism across multiple countries, focusing on public engagement with social issues in the US, Singapore, Germany, and Japan.
Activism, country comparison, social issues, public engagement, market trends
false
Market Analysis and Trends
Government & Public Sector government-and-public-sector
Mixed Chart
Deloitte
View slide
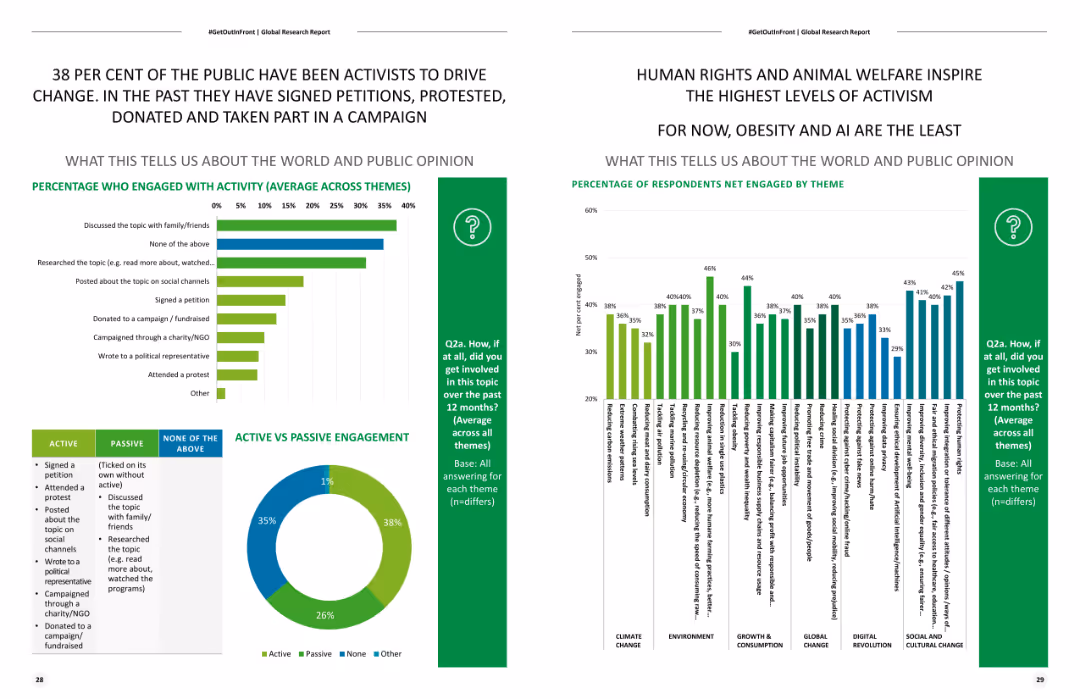
Contains a bar chart on public engagement activities and a pie chart on active vs. passive engagement.
Client Case Studies
Government & Public Sector
Details public engagement in activism, including activities like signing petitions and attending protests, highlighting the level of activism and public opinion.
Activism, public engagement, social change, bar chart, public opinion
false
Client Case Studies
Government & Public Sector government-and-public-sector
Multiple Chart
Deloitte
View slide
Combines text blocks and icons to outline strategies for boosting sales effectiveness and enabling multi-platform sales in the advertising industry.
Strategic Planning
Media & Entertainment
Discusses methods to enhance the effectiveness of ad sales and enable sales across multiple platforms, emphasizing automation and audience engagement.
Ad Sales, Effectiveness, Multi-platform, Automation, Audience Engagement, Advertising, Strategy, Sales Optimization
false
Strategic Planning
Media & Entertainment media-and-entertainment
Header Horizontal
Accenture
View slide
The slide is divided into textual content and infographic elements with percentage figures and pictograms related to agility and talent. Green and grey color highlights are used for emphasis.
Organizational Structure and Change
Professional Services
Discusses the Adaptable Organization (AO) as a shift in management philosophy to increase agility through empowered networks of teams. It points out the current state of digital disruption, organizational agility, leadership, and the need for new talent within professional services.
Adaptable Organization, management, agility, talent, disruption, teams
false
Organizational Structure and Change
Professional Services professional-services
Linear Flow
Deloitte
View slide
Bar chart listing additional services consumers plan to acquire with their next vehicle, including insurance and roadside assistance. Simple and clean presentation.
Product and Service Analysis
Transportation & Logistics
This slide outlines the most common additional services that vehicle consumers intend to purchase or subscribe to, highlighting the high demand for vehicle insurance and roadside assistance.
Additional services, consumer planning, vehicle insurance, roadside assistance
false
Product and Service Analysis
Transportation & Logistics transportation-and-logistics
Single Chart
Deloitte
View slide
The slide uses funnel diagrams to represent market size and opportunities across banking sectors, complemented by ROE accretion information. The visual elements are clear and informative, using contrasting colors for different sectors.
Market Analysis and Trends
Financial Services
This slide assesses potential market opportunities and the expected return on equity (ROE) in various financial sectors. It implies a focus on understanding market size and shares to drive strategic growth and profitability within transaction banking, wealth management, and consumer sectors.
Addressable market, Market size, ROE, Financial sectors, Profitability
false
Market Analysis and Trends
Financial Services financial-services
Table
Goldman Sachs
View slide
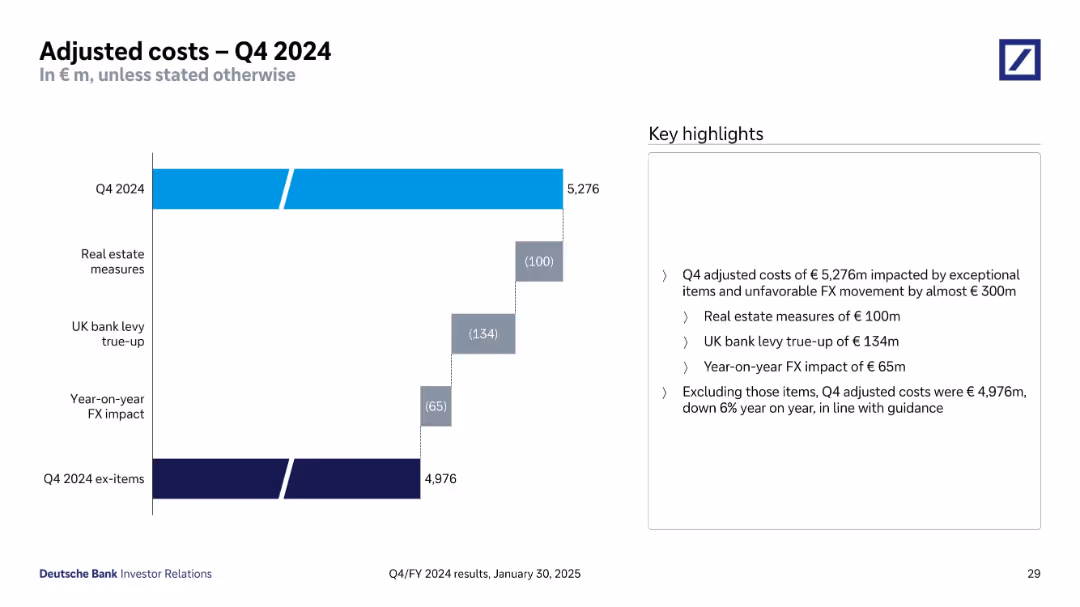
Waterfall chart showing Q4 2024 costs and exceptional item impacts; highlight bullets to the right
Operational Efficiency
Financial Services
This slide presents Q4 2024 adjusted costs of €5,276m, including exceptional items and FX impact totaling nearly €300m. A breakdown shows the impact of real estate measures, UK bank levy, and FX changes. Excluding these items, adjusted costs are €4,976m, down 6% YoY.
Adjusted Costs, Exceptional Items, FX Impact, Cost Reduction, Efficiency
false
Operational Efficiency
Financial Services financial-services
Mixed Chart
Deutsche Bank
View slide
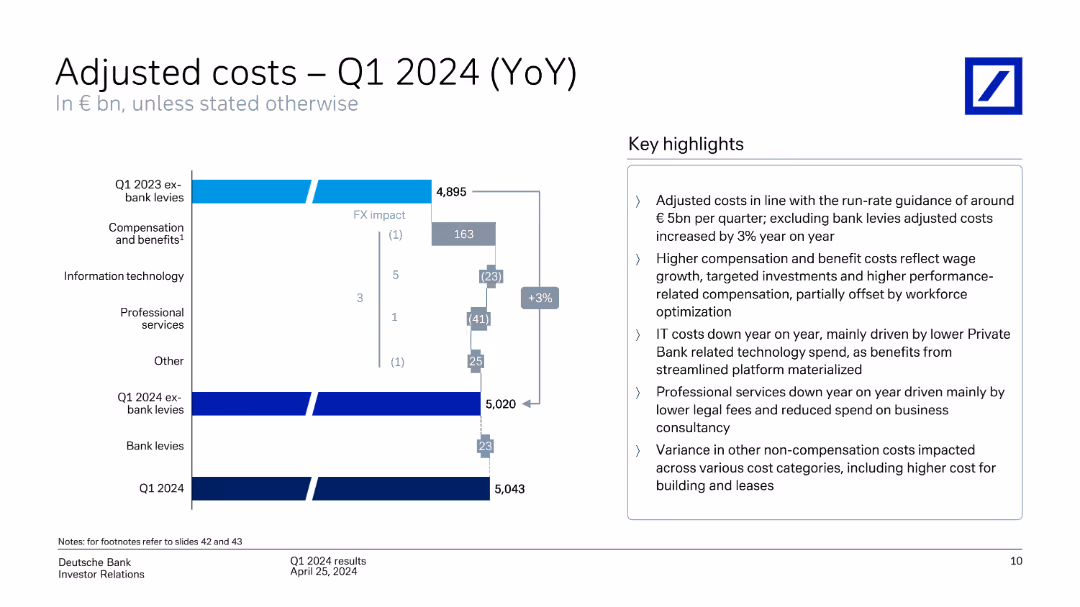
A column chart breaking down adjusted costs year-over-year with key highlights on the right. The slide is moderately dense with a mix of graphical and textual elements.
Operational Efficiency
Financial Services
This slide breaks down the adjusted costs for Q1 2024, comparing them year-over-year and providing insights into cost drivers such as compensation, IT, and professional services.
Adjusted costs, year-over-year, cost drivers, compensation, IT
false
Operational Efficiency
Financial Services financial-services
Mixed Chart
Deutsche Bank
View slide
The slide includes a table and bar charts showing different levers in administration and overhead with corresponding activity levels and trends.
Operational Efficiency
Professional Services
Discusses the lesser relevance of administration and overhead levers, focusing on corporate structures, back-office services, and staffing costs.
Administration, Overhead, Corporate Structures, Trends
false
Operational Efficiency
Professional Services professional-services
Single Chart
Roland Berger
View slide
This slide is dominated by a blue and turquoise bar graph comparing merchant intentions for digital financial services usage. The title and a brief introductory text are placed at the top, and a source citation is at the bottom. The graph is detailed with percentages, making it dense in information.
Market Analysis and Trends
Financial Services
The slide details the expectations of digital merchants towards the adoption of digital financial services over the next couple of years. It specifically quantifies the percentage of merchants likely to increase or maintain their usage of services like digital payments, remittance, insurance, and lending. The purpose of the slide is to convey future usage trends among digital merchants, which is crucial for forecasting and strategic planning in the financial services industry.
Adoption, Digital Merchants, Financial Services, Trends, Payments, Remittance, Insurance, Lending, Growth, Statistics
false
Market Analysis and Trends
Financial Services financial-services
Single Chart
Bain
View slide
Simple, clean design with a complex network graphic, representing interconnectedness and the concept of advanced connectivity.
Industry Overview
Technology & Software
Dedicated to the theme of advanced connectivity, it signals the beginning of a deep dive into this specific tech trend.
Advanced Connectivity, Technology, Trends, Network, Interconnection, Outlook
false
Industry Overview
Technology & Software technology-and-software
Title
McKinsey
View slide
Contains a line chart showing historical shifts between digital and traditional advertising spends. Detailed annotations explain shifts in spending and digital growth.
Strategic Planning
Media & Entertainment
Discusses historical and future trends in advertising spend, emphasizing the transition from traditional to digital platforms and strategies to future-proof ad sales.
Advertising, Digital, Traditional, Spending Trends, Strategic Planning, Future-proof, Media, Transition
false
Strategic Planning
Media & Entertainment media-and-entertainment
Single Chart
Accenture
View slide
Slide features two line charts comparing changes in advertising spending and GDP over time. Text blocks provide contextual information and a global perspective on economic impacts on advertising.
Strategic Planning
Media & Entertainment
Analyzes the disproportionate impact of economic shocks on advertising spend compared to GDP, highlighting historical trends and predicting future behaviors in the advertising market.
Advertising, GDP, Economic Shock, Impact, Historical Trends, Future Prediction, Media, Global Perspective
false
Strategic Planning
Media & Entertainment media-and-entertainment
Single Chart
Accenture
View slide
Showcases a line chart of US ad spend per user per day from 2015 to 2022, with color coding for different media types. The slide emphasizes the growth of digital over traditional media.
Strategic Planning
Media & Entertainment
Examines how the advertising market is expected to evolve post-pandemic, with a significant lean towards digital media over traditional forms like TV, informed by recent spending trends.
Advertising, Post-pandemic, Digital Growth, Media Trends, US Market, Spending Analysis, Traditional Media
false
Strategic Planning
Media & Entertainment media-and-entertainment
Mixed Chart
Accenture
View slide
Features a line chart detailing the shift in advertising spend among digital, TV, and other platforms. Text blocks explain the trends and future predictions for advertising revenues.
Strategic Planning
Media & Entertainment
Details the redistribution of advertising revenues across digital, TV, and other media platforms from 2019 to 2024, analyzing the shift towards digital and its implications for media strategies.
Advertising, Revenue Trends, Digital Shift, Media Platforms, Future Predictions, TV, Market Analysis
false
Strategic Planning
Media & Entertainment media-and-entertainment
Mixed Chart
Accenture
View slide
Column chart showing the percentage distribution of advertising spots by length for the year 2018 with distinct color bars.
Market Analysis and Trends
Media & Entertainment
Analyzes the popularity of different advertising spot lengths in 2018, highlighting the prevalence of 60-second spots.
Advertising, Spot Length, 2018, 60 Seconds, 30 Seconds, 90 Seconds
false
Market Analysis and Trends
Media & Entertainment media-and-entertainment
Single Chart
PwC/Strategy&
View slide
Diagram depicting a six-element framework for transforming ad sales, including enhancing creative development and managing multi-platform inventory. Icons and labels explain each element.
Strategic Planning
Media & Entertainment
Presents a comprehensive framework for transforming advertising sales, focusing on six strategic areas to enhance scalability, intimacy, and revenue growth through technology.
Advertising, Transformation, Strategy, Framework, Sales Enhancement, Multi-platform Management, Revenue Growth
false
Strategic Planning
Media & Entertainment media-and-entertainment
Framework
Accenture
View slide
This slide presents a column chart with projected advisor headcount growth and several icon-based stats related to advisor productivity. It has a clean, organized layout with a blue and grey color scheme.
Operational Efficiency
Financial Services
Discusses the strategy to increase advisor headcount in branches and the outcomes like advisor productivity and client satisfaction. It's intended to inform about scaling operations and anticipated outcomes in advisor channels and client satisfaction levels through a unique branch-based model.
Advisor headcount, Productivity, Client satisfaction, Growth, Talent
false
Operational Efficiency
Financial Services financial-services
Mixed Chart
JP Morgan
Previous
Loading...
Hold On!
We are searching in our database
If nothing, comes up, please try different filters!
Column Chart
Heatmap
Chevron
Org Chart
Infographic
Callouts
Timeline
List
Graphic
Picture
Process Flow
Diagram
Paragraph
Map
Table
Framework
Subtitle
Takeaway Box
Icon
Other Chart
Radar Chart
Waterfall Chart
Mekko Chart
Pie Chart
Scatter Plot
Line Chart
Bar chart
Bullet points
Create a FREE account to continue browsing
Receive Instant Access to 1,000+ slides from companies like McKinsey, Google, and Goldman Sachs
First Name
Last Name
Email
Password
I agree to all
Terms & Privacy Policy
Thank you! Your submission has been received!
Oops! Something went wrong while submitting the form.
Have an account?
Sign in
Upgrade to PRO to Save slides
Advanced Search and Filters
Access to 15,000+ slides
Access to Category Pages
Save/Bookmark Slides
PowerPoint Template Library
Pick a Plan
MONTHLY
$12/month
Billed every month, Cancel anytime.
YEARLY
$9/year
Billed $108 annually, Cancel anytime.
Checkout for $12/month
Checkout for $108/yr
Secured by Stripe | AES-256 bit encryption