My Account
My Slides
Search by Category
Templates
View All Templates
Download Template Slides
Leave Feedback
Login
Logout
Get Started
Browse all Slides
Browse all Slides
Create a FREE Account
Instant access to 1,000+ real slides from top companies like McKinsey, BCG, Goldman Sachs, Google and many more!
First Name
Last Name
Email
Password
I agree to all
Terms & Privacy Policy
Thank you! Your submission has been received!
Oops! Something went wrong while submitting the form.
Have an account?
Sign in
Spark Your Next Big Idea with New Presentation Templates
VIEW ALL Templates
Welcome,
Welcome
PRO
Show Featured Only
Checkbox 8
Companies
Mckinsey
Bain
BCG
EY
Deloitte
Accenture
PwC/Strategy&
JP Morgan
Goldman Sachs
Morgan Stanley
Citigroup
Deutsche Bank
Barclays
LEK
KPMG
Kearney
Oliver Wyman
Booz Allen Hamilton
Gartner
IPSOS
Nielsen
Slide type
Text Only
Linear Flow
Vertical Flow
Single Chart
Header Horizontal
Mixed Chart
Header Vertical
Pillar
Multiple Chart
Graphic
Agenda
Title
Table
Framework
Industry
Technology & Software
Artificial Intelligence
Financial Services
Retail & E-commerce
Consumer Goods
Industrial & Manufacturing
Transportation & Logistics
Telecommunications
Real Estate & Construction
Hospitality & Tourism
Professional Services
Education & Training
Media & Entertainment
Agriculture & Food Production
Healthcare & Pharmaceuticals
Environmental Services & Sustainability
Government & Public Sector
Use Case
Mergers and Acquisitions
Performance Metrics and KPIs
Client Case Studies
Competitive Landscape
Corporate Finance and Valuation
Product and Service Analysis
Customer and Market Segmentation
Organizational Structure and Change
Industry Overview
Regulatory and Compliance
Risk Assessment and Management
Investment Analysis
Organizational Structure and Change
Human Resources and Talent Management
Financial Performance
Market Analysis and Trends
Sales and Business Development
Human Resources and Talent Management
Clear all
Thank you! Your submission has been received!
Oops! Something went wrong while submitting the form.
Tag
View slide
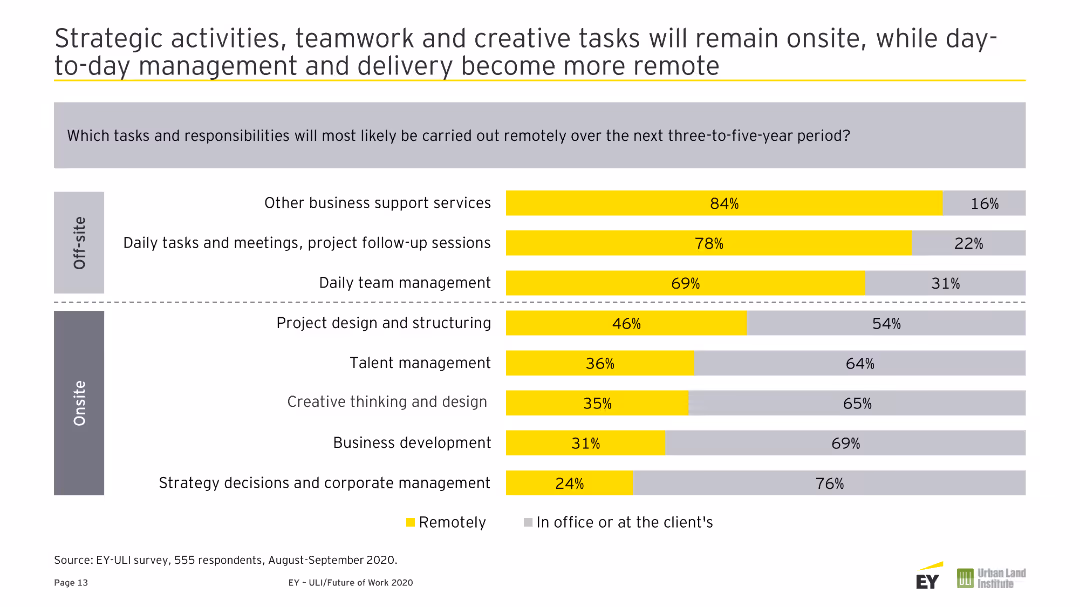
Shows a bar chart with advisor recommendations on purchasing crypto assets, divided by recommendation level.
Market Analysis and Trends
Financial Services
The slide presents data on the extent to which financial advisors recommend crypto assets, showing a majority of investors have not been advised to purchase, and details the recommendation levels by various demographics.
Advisor recommendations, crypto assets
false
Market Analysis and Trends
Financial Services financial-services
Mixed Chart
IPSOS
View slide
Shows a bar chart with financial advisor recommendations on purchasing crypto investment funds, by recommendation level.
Market Analysis and Trends
Financial Services
This slide details the recommendations by financial advisors regarding crypto investment funds, indicating that most investors have not discussed or received recommendations, and presents demographic differences in these advisory interactions.
Advisor recommendations, crypto funds
false
Market Analysis and Trends
Financial Services financial-services
Mixed Chart
IPSOS
View slide
The slide has a multicolor action plan list on the left side and a red-highlighted text box on the right emphasizing a key achievement. A gray background distinguishes the bottom section, which details specific program progress.
Operational Efficiency
Industrial & Manufacturing
Presenting the recovery plan for aerostructures, the slide outlines various actions taken and their progress. It emphasizes improvements and milestones, including collaborations and deliveries. It's used for performance reviews and showcasing operational progress in the aerospace sector.
Aerostructures, Recovery Plan, Progress, Operational Efficiency, Milestone
false
Operational Efficiency
Industrial & Manufacturing industrial-and-manufacturing
Table
Goldman Sachs
View slide
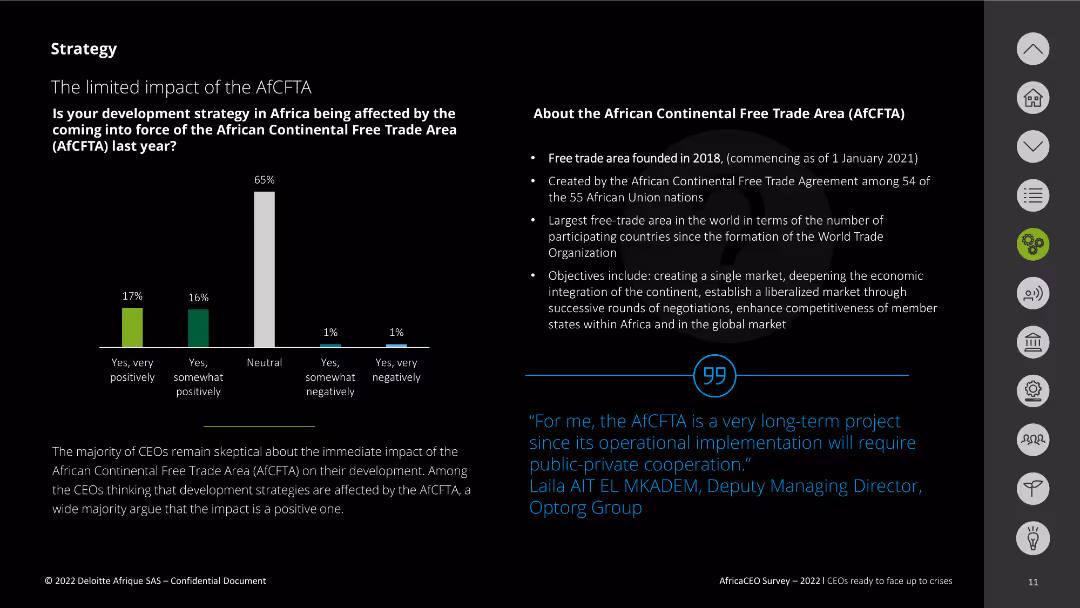
The slide features a column chart displaying survey responses about the impact of the AfCFTA. It also includes a text box explaining the AfCFTA, its founding, and objectives. A quote from a CEO is included at the bottom right.
Regulatory and Compliance
Government & Public Sector
This slide presents the survey results on the impact of the African Continental Free Trade Area (AfCFTA) on development strategies. It highlights skepticism among CEOs about its immediate impact and outlines the AfCFTA's key objectives and background.
AfCFTA, impact, survey, objectives, development strategy
false
Regulatory and Compliance
Government & Public Sector government-and-public-sector
Mixed Chart
Deloitte
View slide
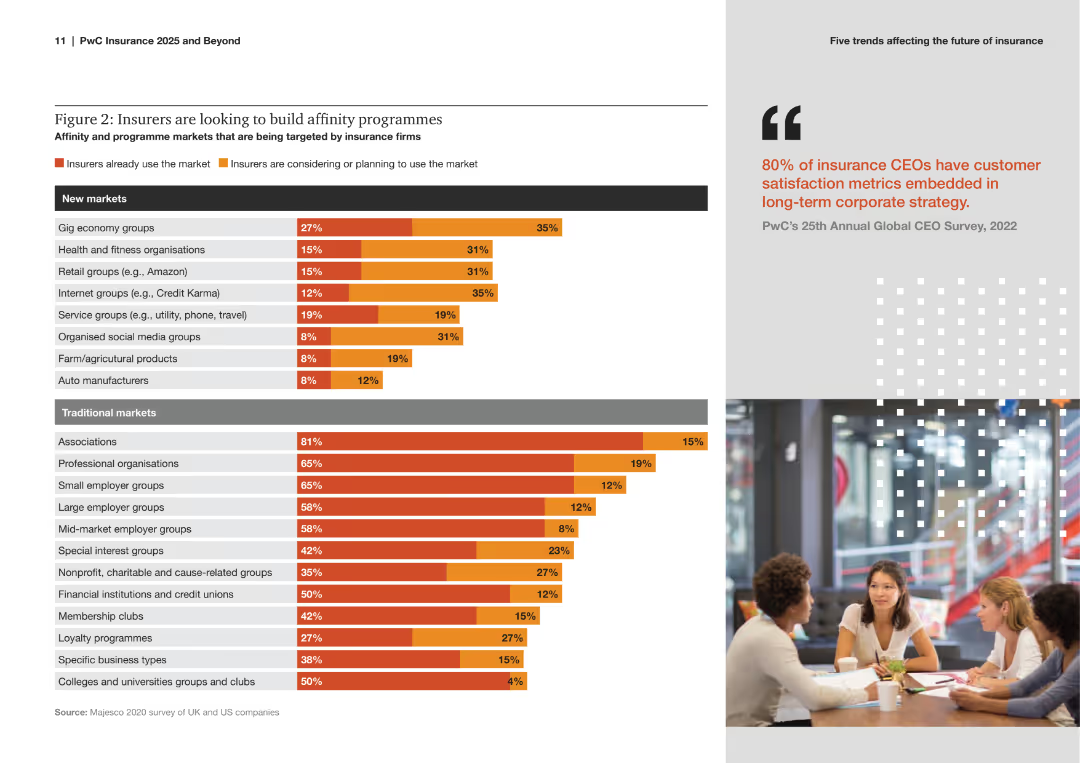
The slide includes a bar chart listing various new and traditional markets that insurance firms are targeting for affinity programs, with percentages indicating the level of current and planned market usage.
Strategic Planning
Financial Services
The slide explores the focus of insurance companies on developing affinity programs across different markets. It compares current usage and future plans for both new and traditional markets, emphasizing strategic expansion efforts.
Affinity Programs, Insurance, Market Strategy, New Markets, Traditional Markets, Strategic Planning, Bar Chart, Expansion, Trends, Analysis
false
Strategic Planning
Financial Services financial-services
Multiple Chart
PwC/Strategy&
View slide
Features a silhouette of construction workers against a sunset, overlaid with diagonal blue and white design elements. The slide is visually simple with a bold title, a website link, and a subtitle stating an economic impact.
Operational Efficiency
Real Estate & Construction
The slide's focus is on the economic impact on affordable housing, likely used for a presentation on market analysis or investment opportunities within the real estate sector.
Affordable Housing, Economy, Real Estate, Construction, Investment, Market Analysis, Impact, Finance
false
Operational Efficiency
Real Estate & Construction real-estate-and-construction
Title
Citigroup
View slide
Three line charts depicting Sub-Saharan Africa's y/y real GDP, y/y percentage change in CPI, and repurchase rate path for Nigeria, South Africa, and Kenya from 2005-25F. Moderate complexity, suitable for presenting regional economic trends.
Market Analysis and Trends
Financial Services
This slide provides an economic forecast for Sub-Saharan Africa, discussing GDP growth, inflation trends, and repurchase rate projections. It highlights the economic performance of Nigeria, South Africa, and Kenya.
Africa, GDP, CPI, repurchase rate, economy
false
Market Analysis and Trends
Financial Services financial-services
Multiple Chart
EY
View slide
The slide presents a circular graph and a line chart, both using a soothing beige palette, to show spending patterns on Afterpay, with specific focus on Gen Z. The design is clean and effective in highlighting key data points.
Market Analysis and Trends
Retail & E-commerce
Illustrates spending patterns on Afterpay, focusing on the rapid growth among Gen Z consumers. This analysis is valuable for understanding market trends and consumer preferences in digital payment solutions.
Afterpay, Consumer Spending, Gen Z, Growth
false
Market Analysis and Trends
Retail & E-commerce retail-and-e-commerce
Multiple Chart
Accenture
View slide
Contains mainly dense text that describes the number of startups involved in AgTech and their focus areas. The slide is dense with data and uses color to differentiate between segments.
Market Analysis and Trends
Agriculture & Food Production
This slide analyses the precision farming sector within the AgTech industry, highlighting the number of startups, investment trends, and key players in the market. It underlines the significance of sustainable agriculture practices.
AgTech, precision farming, sustainable agriculture, investment, startups
false
Market Analysis and Trends
Agriculture & Food Production agriculture-and-food-production
Header Vertical
Accenture
View slide
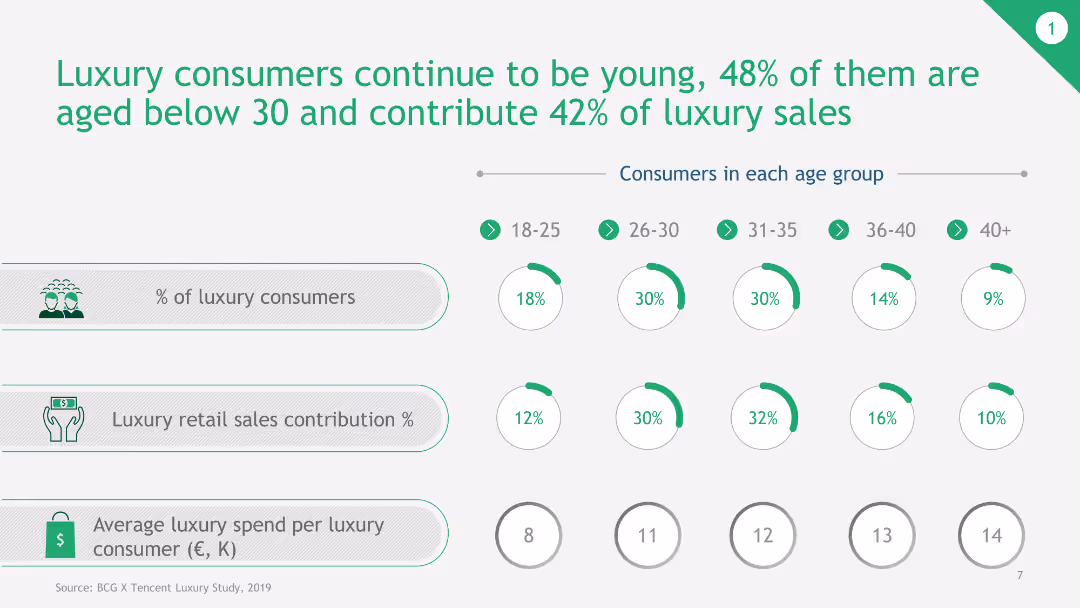
The slide features circular data visuals and icons to represent age groups, percentages of luxury consumers, and sales contributions. Predominantly green and white color scheme.
Customer and Market Segmentation
Consumer Goods
This slide presents data on the age distribution of luxury consumers and their contributions to luxury sales, highlighting that a significant portion is under 30 years old.
Age Distribution, Luxury Consumers, Sales Contribution, Young Consumers, Market Analysis
false
Customer and Market Segmentation
Consumer Goods consumer-goods
Multiple Chart
BCG
View slide
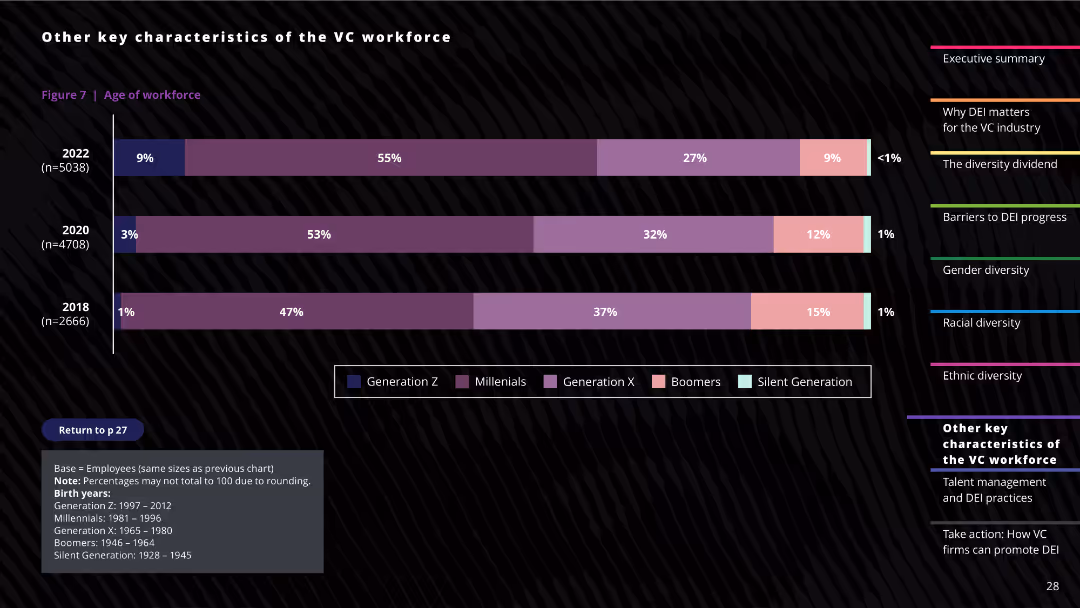
The slide includes a column chart showing the age distribution of the venture capital workforce, divided into different generational cohorts. Textual notes provide context about the data sources and definitions.
Human Resources and Talent Management
Professional Services
This slide analyzes the age demographics of the venture capital workforce, illustrating the proportion of employees in different generational groups, and highlighting changes in the workforce composition over time.
Age demographics, Workforce analysis, Generational cohorts, VC industry, Demographic trends
false
Human Resources and Talent Management
Professional Services professional-services
Mixed Chart
Deloitte
View slide
Lists key topics in a clean format with blue accents. Simple layout for easy reading.
Strategic Planning
Professional Services
Outlines the main points to be covered, focusing on distribution industry dynamics and profitability.
Agenda, Distribution, Profitability, Overview, Dynamics, Strategy
false
Strategic Planning
Professional Services professional-services
Agenda
EY
View slide
This simple layout slide displays a three-point agenda, each with a title and sub-points, set against a backdrop of a molecular structure graphic.
Strategic Planning
Financial Services
The agenda outlines the main topics for the presentation, including an executive summary, financial and business details, and additional backup information.
Agenda, Executive Summary, Details, Backup
false
Strategic Planning
Financial Services financial-services
Agenda
Morgan Stanley
View slide
A minimalist slide with an agenda list on the left and a vibrant image of shipping containers on the right, suggesting a theme related to logistics or global business.
Strategic Planning
Professional Services
Serves to outline the topics of discussion in a business or strategy meeting, with a visual nod to global operations and logistics.
Agenda, Logistics, Global Business, Meeting, Strategy
false
Strategic Planning
Professional Services professional-services
Agenda
Morgan Stanley
View slide
Features icons next to text headings, each representing different sections of the report. The design is straightforward, utilizing white space effectively to enhance readability.
Organizational Structure and Change
Environmental Services & Sustainability
Outlines the main sections of the presentation which include investment opportunities, impediments to change, and recommendations for accelerating the green economy.
Agenda, sections, green economy, investment opportunities, recommendations
false
Organizational Structure and Change
Environmental Services & Sustainability environmental-services-and-sustainability
Agenda
Bain
View slide
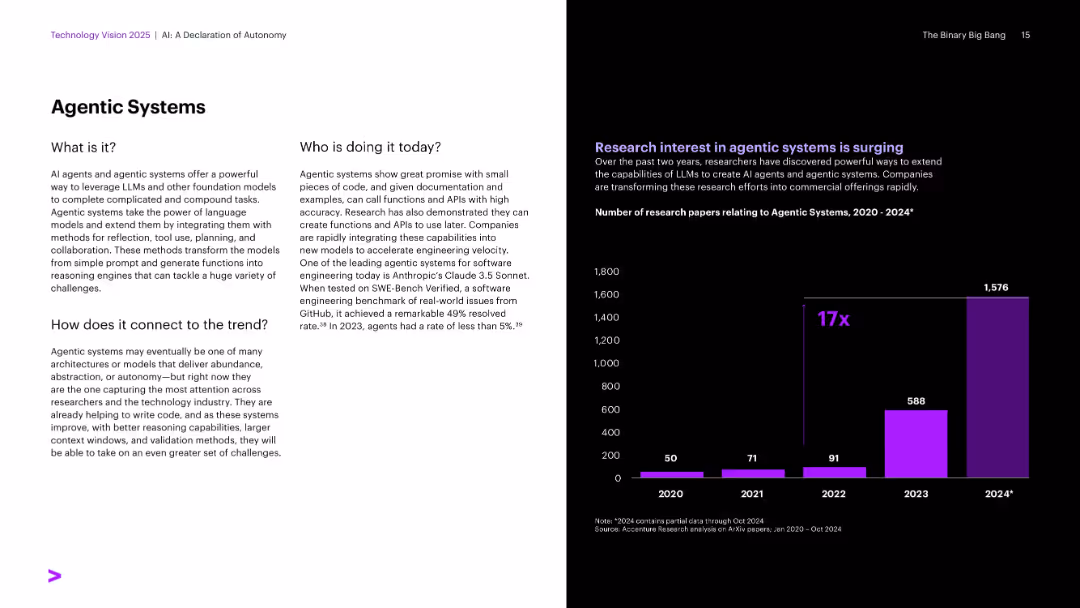
Split layout with descriptive text on left and vertical bar chart on right showing research paper growth. White and black backgrounds with purple highlights.
Strategic Planning
Artificial Intelligence
Explains the concept and rise of agentic systems, highlighting their use in complex task automation and planning. Research interest in this area has grown 17x from 2020 to 2024.
Agentic Systems, LLMs, Research Trends, Task Automation, Claude, Engineering Velocity
false
Strategic Planning
Artificial Intelligence artificial-intelligence
Mixed Chart
Accenture
View slide
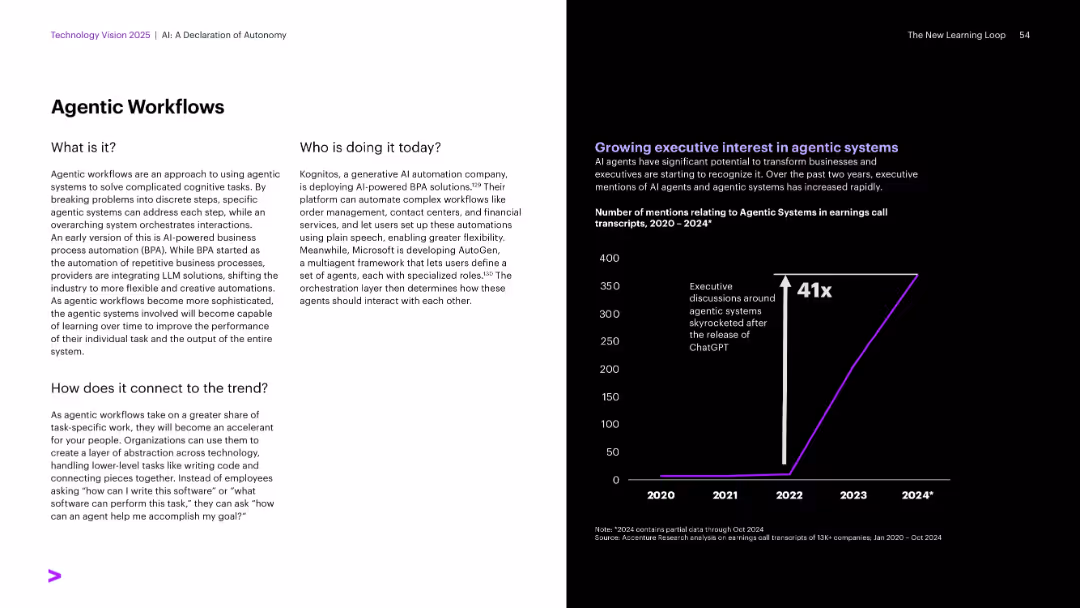
Same split format: white left with text, black right with steep line chart.
Organizational Structure and Change
Technology & Software
The slide introduces agentic workflows—systems that divide tasks among AI agents for complex problem-solving. It features examples like Kognitos and Microsoft AutoGen. A 41x increase in mentions of agentic systems shows growing executive interest, especially since ChatGPT's release.
Agentic systems, AutoGen, workflow automation, generative AI, Kognitos
false
Organizational Structure and Change
Technology & Software technology-and-software
Mixed Chart
Accenture
View slide
A bar graph displaying potential revenue increase from agility across various industries, with an 'Estimated average revenue lift' callout box.
Financial Performance
Professional Services
Details how adopting an agile business model is projected to impact revenue across different industries, with a focus on future growth.
Agile Model, Revenue Impact, Industry Comparison, Bar Graph, Future Growth
false
Financial Performance
Professional Services professional-services
Single Chart
Kearney
View slide
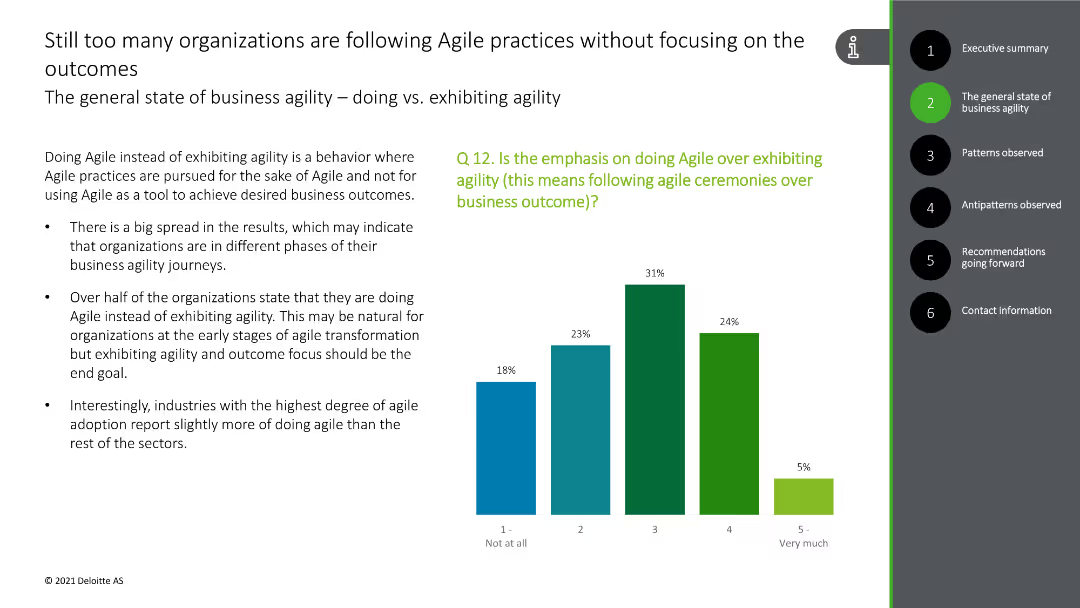
This slide contains a column chart showing the emphasis on following Agile ceremonies over outcomes, with green and blue bars.
Strategic Planning
Technology & Software
The slide discusses the focus on Agile practices rather than outcomes in many organizations, with survey data supporting this observation.
Agile practices, outcomes, focus, survey data, organizational behavior
false
Strategic Planning
Technology & Software technology-and-software
Mixed Chart
Deloitte
View slide
Pie charts showing survey results, text with bullet points and manifesto sections
Organizational Structure and Change
Professional Services
Discusses EY's approach to flexible work policies, survey results, and the EYManifesto
Agile work, flexibility, survey, manifesto, EY
false
Organizational Structure and Change
Professional Services professional-services
Multiple Chart
EY
View slide
The slide is laid out as a flowchart diagram known as the 'Innovation Flywheel', with descriptions accompanying each step. It includes side text elaborating on the process details.
Strategic Planning
Technology & Software
It suggests using agile methods to build, test, and launch innovations, tailored to different innovation focus areas. Suitable for process optimization discussions.
Agile, Innovation, Process, Flywheel, Prototyping, MVP, Customer Feedback, Experiments, Product Development
false
Strategic Planning
Technology & Software technology-and-software
Linear Flow
BCG
View slide
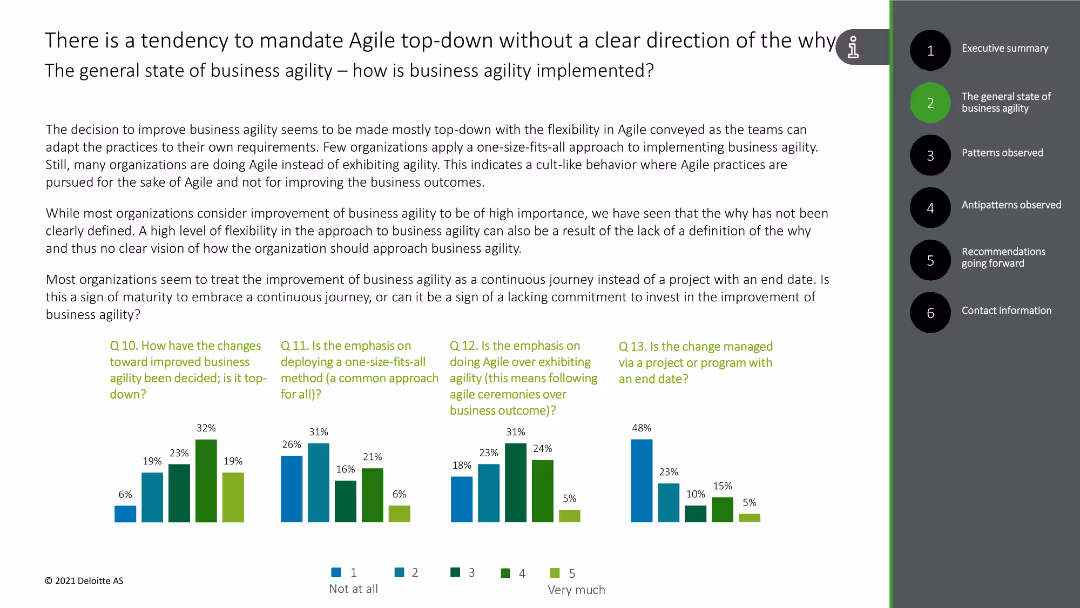
This slide includes a column chart depicting the approach towards business agility changes in organizations, with bars in green and blue.
Organizational Structure and Change
Technology & Software
The slide discusses the top-down mandate of Agile practices without clear articulation of the purpose, supported by survey data.
Agile, top-down, business agility, survey data, organizational change
false
Organizational Structure and Change
Technology & Software technology-and-software
Multiple Chart
Deloitte
View slide
Bar graph and quotes highlighting cultural and other barriers to organizational agility.
Operational Efficiency
Professional Services
Identifies and quantifies the main barriers to achieving agility in business, with cultural issues being the most significant.
Agility Barriers, Culture, Organizational Change, Bar Graph, Executive Quotes
false
Operational Efficiency
Professional Services professional-services
Mixed Chart
Kearney
View slide
The slide features two column charts comparing 'Production Releases' and 'Improved App Ratings' over time, with annotations. On the right side, there's a text box listing awards and recognitions.
Financial Performance
Financial Services
Demonstrates increased agility in technology with a threefold increase in production releases and higher app ratings. It includes accolades such as innovation and model bank awards, implying industry recognition for technological advancements.
Agility, App Ratings, Awards, Recognition, Innovation, Technology
false
Financial Performance
Financial Services financial-services
Single Chart
Goldman Sachs
View slide
Bar graph comparison between 'Today' and '2026' expectations of business agility, accompanied by a pie chart indicating industry goals for agility.
Market Analysis and Trends
Media & Entertainment
Details executive insights on the need for agility in business processes and systems, forecasting changes by 2026.
Agility, Business Processes, Executive Survey, Future Forecasting, Industry Goals, Respondent Views
false
Market Analysis and Trends
Media & Entertainment media-and-entertainment
Mixed Chart
Kearney
View slide
Column chart depicting potential benefits from the Future of Work. The right side of the slide contains two text quotes in gray boxes. Colors are primarily yellow and gray.
Strategic Planning
Real Estate & Construction
Highlights the top 5 benefits of the Future of Work, including increased work flexibility, reduced commuting, and better workplace environments.
Agility, Flexibility, Work, Corporate, Office, Real Estate, Environment, Commuting, Costs, Savings
false
Strategic Planning
Real Estate & Construction real-estate-and-construction
Single Chart
EY
View slide
Features a bar graph and breakout boxes highlighting the prioritization of agility by job titles and company size.
Market Analysis and Trends
Professional Services
Examines the priority levels that executives in different roles and company sizes place on achieving agility within their organizations.
Agility, Prioritization, Executives, Company Size, Bar Graph
false
Market Analysis and Trends
Professional Services professional-services
Single Chart
Kearney
View slide
Features a couple of bar charts, clean design with blue and gray colors. Moderate text for explanations.
Human Resources and Talent Management
Professional Services
Focuses on factors impacting GBS footprint strategy and how organizations have added agility and resilience to their models.
Agility, resilience, GBS, business model, strategy
false
Human Resources and Talent Management
Professional Services professional-services
Multiple Chart
Deloitte
View slide
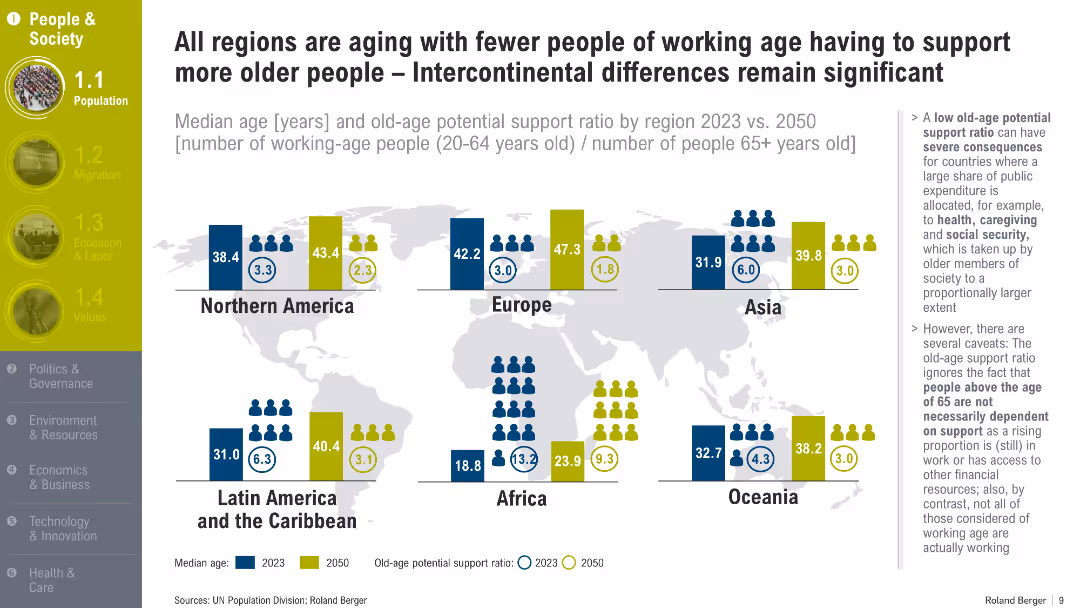
Regional map with median age and support ratio figures (2023 vs. 2050); visualized with icon sets and numeric values
Human Resources and Talent Management
Government & Public Sector
This slide highlights aging demographics globally, showing rising median ages and declining support ratios across continents. It emphasizes the increasing economic burden on working-age populations to support elderly populations by 2050.
Aging Population, Support Ratio, Median Age, 2050, Global Demographics, Workforce, Social Impact
false
Human Resources and Talent Management
Government & Public Sector government-and-public-sector
Mixed Chart
Roland Berger
View slide
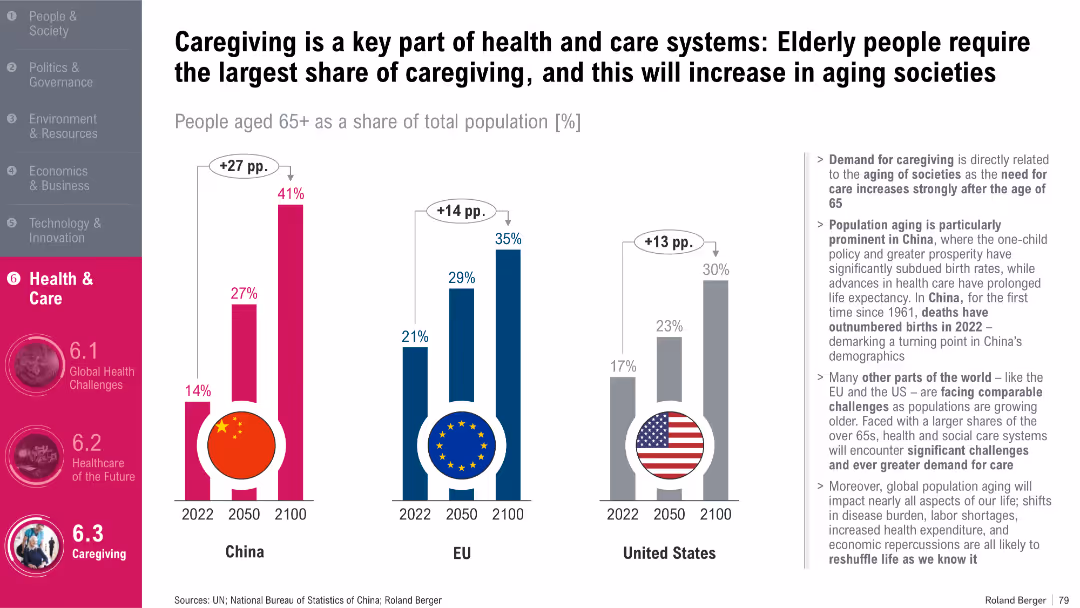
Three side-by-side bar graphs showing aging population projections; flag icons; summary text block
Human Resources and Talent Management
Healthcare & Pharmaceuticals
This slide visualizes the growing proportion of people aged 65+ in China, the EU, and the US through 2100. It explains that an aging population increases demand for caregiving services and highlights demographic trends that influence health system planning and workforce needs in elderly care.
Aging, Caregiving, Elderly, Demographics, Health Workforce
false
Human Resources and Talent Management
Healthcare & Pharmaceuticals healthcare-and-pharmaceuticals
Multiple Chart
Roland Berger
Previous
Loading...
Hold On!
We are searching in our database
If nothing, comes up, please try different filters!
Column Chart
Heatmap
Chevron
Org Chart
Infographic
Callouts
Timeline
List
Graphic
Picture
Process Flow
Diagram
Paragraph
Map
Table
Framework
Subtitle
Takeaway Box
Icon
Other Chart
Radar Chart
Waterfall Chart
Mekko Chart
Pie Chart
Scatter Plot
Line Chart
Bar chart
Bullet points
Create a FREE account to continue browsing
Receive Instant Access to 1,000+ slides from companies like McKinsey, Google, and Goldman Sachs
First Name
Last Name
Email
Password
I agree to all
Terms & Privacy Policy
Thank you! Your submission has been received!
Oops! Something went wrong while submitting the form.
Have an account?
Sign in
Upgrade to PRO to Save slides
Advanced Search and Filters
Access to 15,000+ slides
Access to Category Pages
Save/Bookmark Slides
PowerPoint Template Library
Pick a Plan
MONTHLY
$12/month
Billed every month, Cancel anytime.
YEARLY
$9/year
Billed $108 annually, Cancel anytime.
Checkout for $12/month
Checkout for $108/yr
Secured by Stripe | AES-256 bit encryption