My Account
My Slides
Search by Category
Templates
View All Templates
Download Template Slides
Leave Feedback
Login
Logout
Get Started
Browse all Slides
Browse all Slides
Create a FREE Account
Instant access to 1,000+ real slides from top companies like McKinsey, BCG, Goldman Sachs, Google and many more!
First Name
Last Name
Email
Password
I agree to all
Terms & Privacy Policy
Thank you! Your submission has been received!
Oops! Something went wrong while submitting the form.
Have an account?
Sign in
Spark Your Next Big Idea with New Presentation Templates
VIEW ALL Templates
Welcome,
Welcome
PRO
Show Featured Only
Checkbox 8
Companies
Mckinsey
Bain
BCG
EY
Deloitte
Accenture
PwC/Strategy&
JP Morgan
Goldman Sachs
Morgan Stanley
Citigroup
Deutsche Bank
Barclays
LEK
KPMG
Kearney
Oliver Wyman
Booz Allen Hamilton
Gartner
IPSOS
Nielsen
Slide type
Text Only
Linear Flow
Vertical Flow
Single Chart
Header Horizontal
Mixed Chart
Header Vertical
Pillar
Multiple Chart
Graphic
Agenda
Title
Table
Framework
Industry
Technology & Software
Artificial Intelligence
Financial Services
Retail & E-commerce
Consumer Goods
Industrial & Manufacturing
Transportation & Logistics
Telecommunications
Real Estate & Construction
Hospitality & Tourism
Professional Services
Education & Training
Media & Entertainment
Agriculture & Food Production
Healthcare & Pharmaceuticals
Environmental Services & Sustainability
Government & Public Sector
Use Case
Mergers and Acquisitions
Performance Metrics and KPIs
Client Case Studies
Competitive Landscape
Corporate Finance and Valuation
Product and Service Analysis
Customer and Market Segmentation
Organizational Structure and Change
Industry Overview
Regulatory and Compliance
Risk Assessment and Management
Investment Analysis
Organizational Structure and Change
Human Resources and Talent Management
Financial Performance
Market Analysis and Trends
Sales and Business Development
Human Resources and Talent Management
Clear all
Thank you! Your submission has been received!
Oops! Something went wrong while submitting the form.
Tag
View slide
This slide shows a set of circular charts displaying Australian consumers' top values in healthcare, such as access to care, cost-effectiveness, and relief from pain and anxiety.
Market Analysis and Trends
Healthcare & Pharmaceuticals
It presents the top values Australian consumers hold in healthcare, emphasizing the importance of access to care, cost-effectiveness, and relief from negative experiences.
Australian consumers, healthcare values, access to care, cost-effectiveness, pain relief
false
Market Analysis and Trends
Healthcare & Pharmaceuticals healthcare-and-pharmaceuticals
Mixed Chart
EY
View slide
The slide contains two line charts. The left chart shows the commodity prices and FX, comparing the commodity price index and AUD/USD. The right chart illustrates short rates and FX with the bond yield spread and AUD/USD.
Market Analysis and Trends
Financial Services
This slide examines the Australian dollar's performance in relation to commodity prices and bond yields, providing valuable insights for financial analysis and market predictions.
Australian dollar, commodity prices, FX, bond yield, market analysis, financial analysis, AUD/USD, short rates
false
Market Analysis and Trends
Financial Services financial-services
Multiple Chart
JP Morgan
View slide
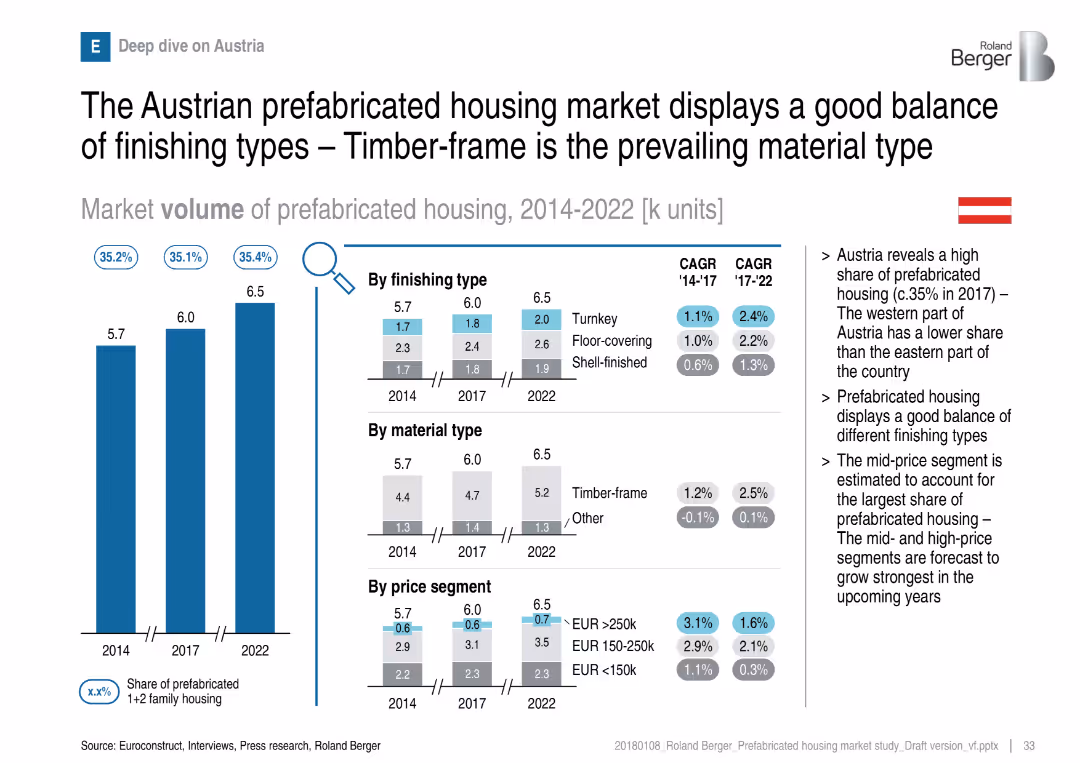
Austrian market breakdown with segmentations and consistent visual format
Customer and Market Segmentation
Real Estate & Construction
Austria shows a balanced mix of finishing types, though timber-frame dominates material choice. Growth is steady, especially in mid- and high-price segments. Regional variation is noted between east and west Austria.
Austria, timber-frame, prefabricated, finishing types, price segments, market balance
false
Customer and Market Segmentation
Real Estate & Construction real-estate-and-construction
Multiple Chart
Roland Berger
View slide
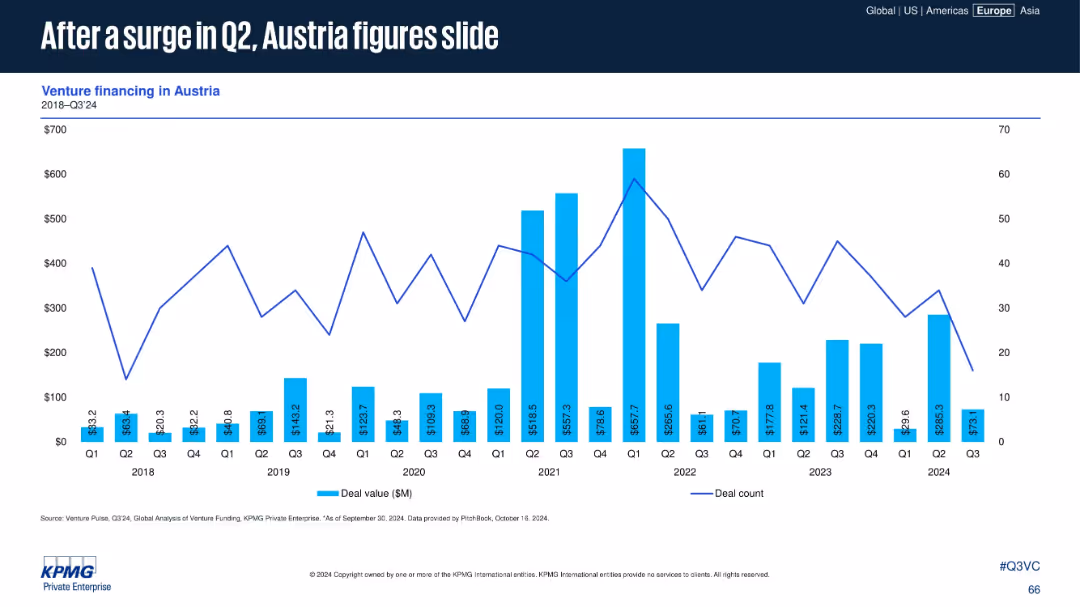
Venture financing data for Austria shown in bar/line format. Covers 2018–Q3 2024, highlighting fluctuations. No commentary.
Market Analysis and Trends
Financial Services
Austria's venture financing experienced a decline in Q3 2024 following a spike in Q2. The chart suggests volatility in deal flow and investment volume, with relatively low deal count compared to other European markets.
Austria, venture capital, deal volume, investment slide, Q3 2024, VC trends, volatility, European markets
false
Market Analysis and Trends
Financial Services financial-services
Single Chart
KPMG
View slide
Features a mix of column charts and a line graph comparing loan and lease originations, revenues, net charge-offs, and macroeconomic factors affecting the auto finance industry.
Financial Performance
Financial Services
Illustrates the company’s position as a top auto finance lender focused on risk-adjusted returns, detailing originations, revenues, and net charge-offs, alongside recent macroeconomic challenges.
Auto Finance, Lender Ranking, Risk Management, Macroeconomics, Revenue, Originations
false
Financial Performance
Financial Services financial-services
Multiple Chart
JP Morgan
View slide
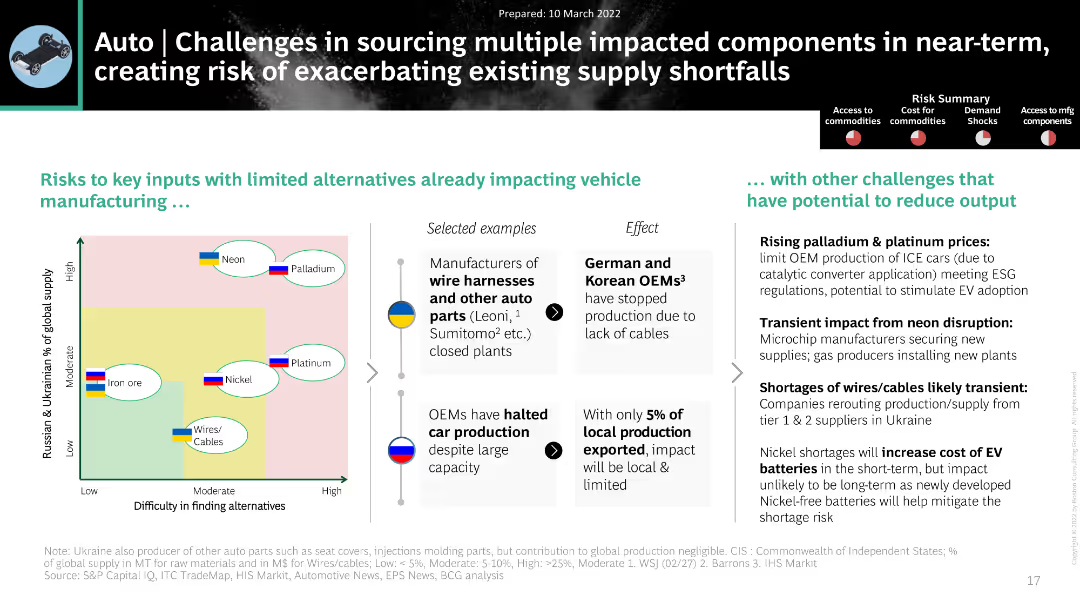
The slide features a matrix chart and bullet points. The design is clean with moderate complexity and relevant icons.
Market Analysis and Trends
Transportation & Logistics
The slide highlights challenges in sourcing components for auto manufacturing due to the Ukraine crisis, focusing on specific materials like neon and palladium.
Auto, Supply Chain, Ukraine Crisis, Neon, Palladium
false
Market Analysis and Trends
Transportation & Logistics transportation-and-logistics
Header Horizontal
BCG
View slide
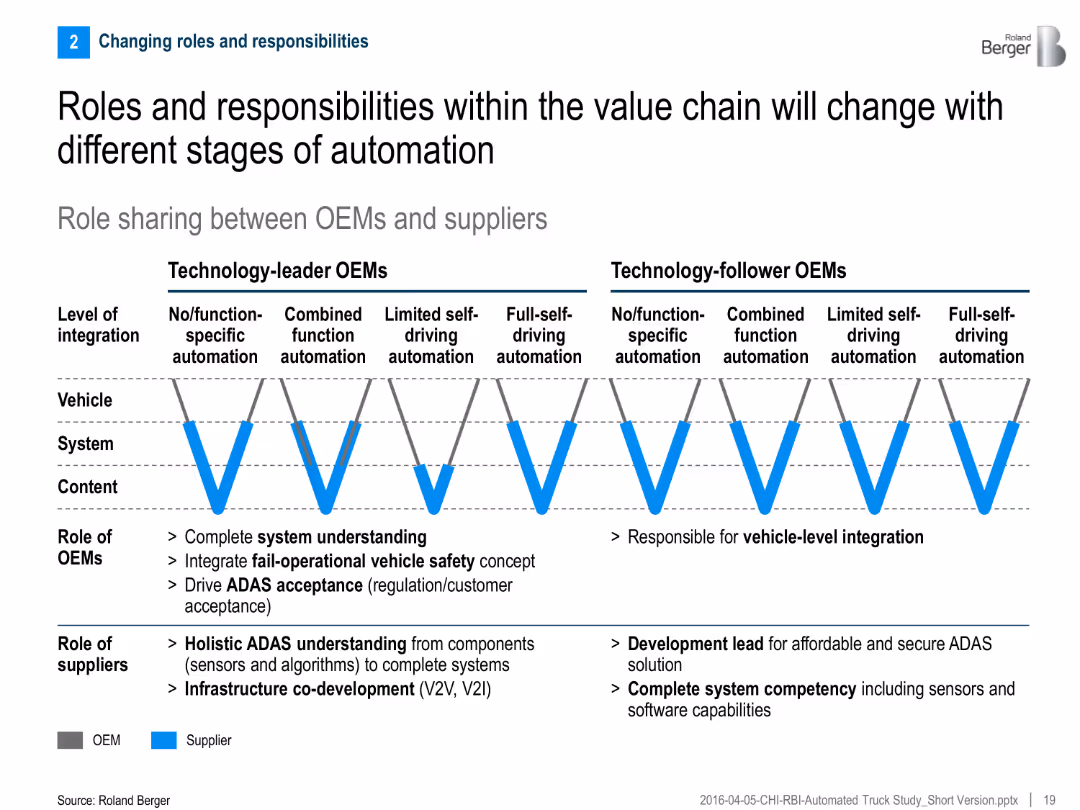
Matrix chart comparing OEM and supplier roles across 4 automation levels; includes two OEM categories (leader/follower)
Organizational Structure and Change
Transportation & Logistics
This slide shows how OEM and supplier responsibilities evolve across automation stages, emphasizing system understanding, vehicle integration, and infrastructure co-development.
Automation levels, OEM, suppliers, system integration, value chain, ADAS, role sharing
false
Organizational Structure and Change
Transportation & Logistics transportation-and-logistics
Uncategorized
Roland Berger
View slide
The slide has moderate visual complexity, featuring an industrial automation technology stack and corresponding companies in each category. The layout is informative, with a balance between text descriptions and graphic representations of the technology levels and companies.
Technology and Digital Transformation
Industrial & Manufacturing
This slide maps out the landscape of companies in the process automation technology space. It visually categorizes companies by their specialization within the technology stack, providing a comprehensive overview of key players and their roles in the ecosystem.
Automation technology, Company landscape, Industry mapping, Tech stack
false
Technology and Digital Transformation
Industrial & Manufacturing industrial-and-manufacturing
Framework
LEK
View slide
The slide features a series of pie charts and circular graphics depicting consumer preferences for drone delivery, voice-automated ordering systems, and kitchen automation.
Market Analysis and Trends
Hospitality & Tourism
This slide explores consumer attitudes towards automation technologies in restaurants, showing a high acceptance and interest in innovations like drone delivery and voice-automated systems.
Automation technology, consumer preferences, drone delivery, voice-automated systems, kitchen automation
false
Market Analysis and Trends
Hospitality & Tourism hospitality-and-tourism
Multiple Chart
Deloitte
View slide
The slide contrasts manual vs. automated development techniques. It features text on both sides with a central image of a human and a robot shaking hands, symbolizing the collaboration between humans and AI. The design is straightforward, focusing on the comparison.
Technology and Digital Transformation
Technology & Software
The content compares traditional and modern software development practices, emphasizing the efficiency of automated, AI-driven approaches. It's likely designed for audiences considering the transition to more advanced development workflows, illustrating the shift from manual to automated processes in the tech industry.
Automation, AI, Development, Efficiency, Technology, Transformation, Software
false
Technology and Digital Transformation
Technology & Software technology-and-software
Boxed
McKinsey
View slide
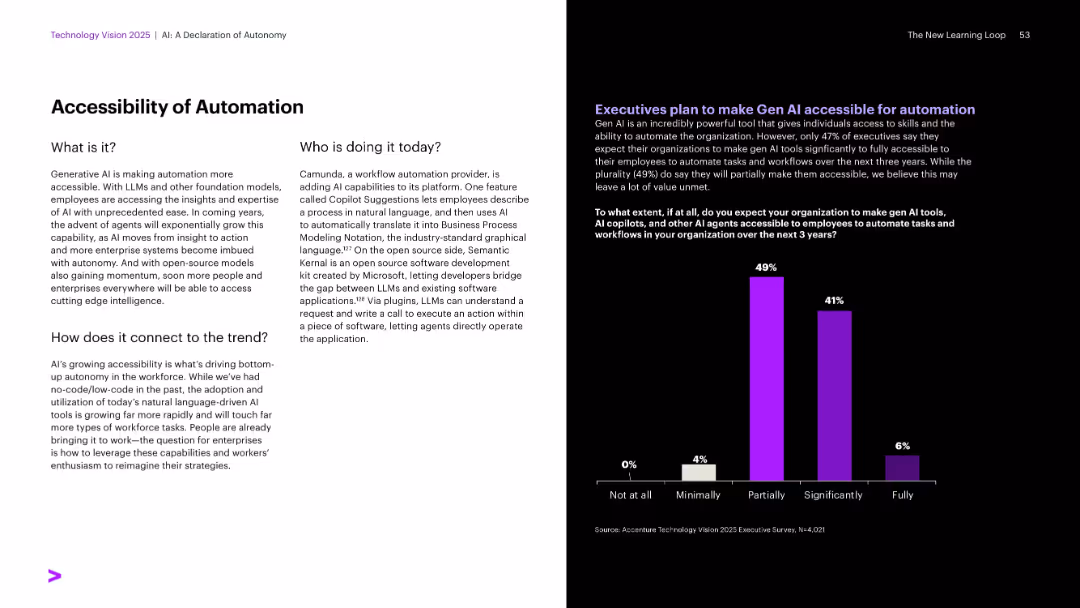
Classic split layout with survey bar graph on right in purple; text-heavy left.
Human Resources and Talent Management
Technology & Software
Describes how generative AI is improving accessibility to automation for employees. It names Camunda and Microsoft as current implementers. A bar chart shows executive expectations on enabling employee access to AI tools over the next three years, with most planning only partial accessibility.
Automation, Gen AI access, Camunda, Semantic Kernel, Microsoft
false
Human Resources and Talent Management
Technology & Software technology-and-software
Mixed Chart
Accenture
View slide
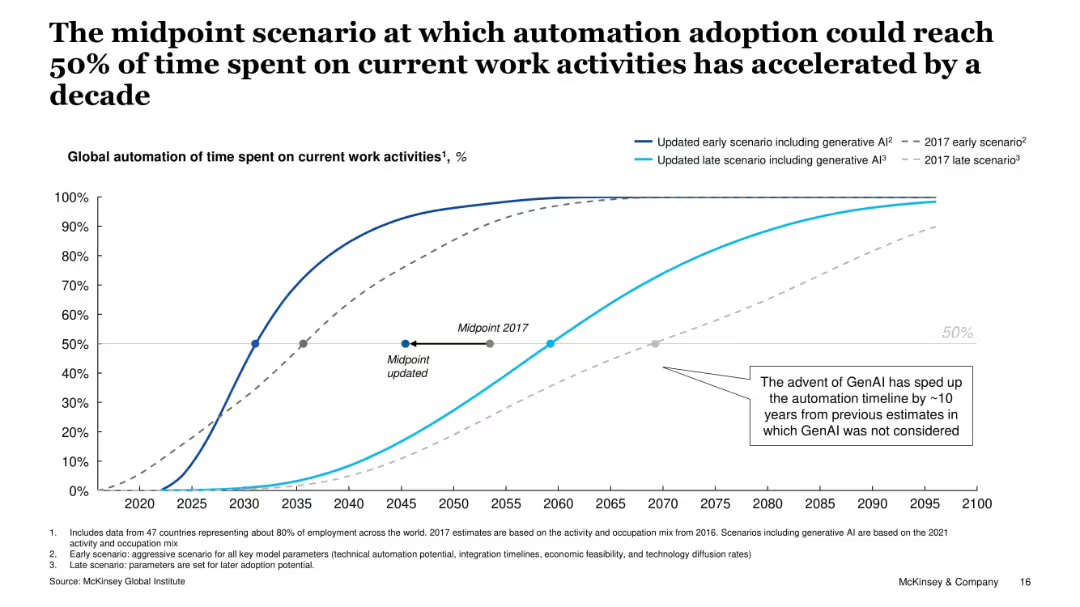
Line graph comparing early and late scenarios of automation adoption (2017 vs. updated with GenAI); includes a 50% midpoint marker and explanatory callouts.
Market Analysis and Trends
Artificial Intelligence
This slide shows how generative AI has accelerated the automation timeline by a decade, with projections showing 50% of work activities becoming automated as early as 2030 in the updated scenario. The chart visually contrasts the 2017 and updated projections using solid and dashed lines.
Automation, Generative AI, Future of Work, Adoption Timeline, Productivity, AI Forecast, Midpoint, Workforce, Labor Trends, McKinsey
false
Market Analysis and Trends
Artificial Intelligence artificial-intelligence
Single Chart
McKinsey
View slide
The slide is divided into two sections. On the left, bulleted text highlights automation benefits for IBKR. On the right, a column chart with overlaid percentage lines displays cost metrics over three years.
Operational Efficiency
Technology & Software
This slide illustrates how automation makes IBKR a cost-efficient processor in the industry, highlighting management software expertise and featuring a cost comparison chart to reflect financial growth.
Automation, IBKR, Software Engineering, Risk Management, Cost Efficiency, Financial Growth, Column Chart, Real-Time, Trades
false
Operational Efficiency
Technology & Software technology-and-software
Mixed Chart
Goldman Sachs
View slide
Bar charts showing the share of task hours carried out by machines in selected industries (ICT, financial services, automotive, energy utilities, professional services, health & healthcare) for 2018 and 2024.
Technology and Digital Transformation
Technology & Software
The slide illustrates the shift towards automation across various industries, comparing the share of task hours performed by machines in 2018 and projected for 2024. It highlights the extent to which machines will complement or substitute human labor in different sectors, emphasizing the growing role of automation.
Automation, Industries, Task Hours, 2024
false
Technology and Digital Transformation
Technology & Software technology-and-software
Multiple Chart
Roland Berger
View slide
This slide presents a detailed table showing industry trends, impacts on factory automation products, and their overall impacts. It includes column charts depicting benefits of IT & OT convergence, cost reduction through XaaS, and market forecasts for AI in manufacturing, smart machines, IoT connected machines, and cobots.
Technology and Digital Transformation
Industrial & Manufacturing
The slide discusses trends in automation aimed at creating intelligent factories with improved flexibility, quality, security, and productivity. It highlights the convergence of IT and OT, XaaS, intelligent manufacturing, and new technology in manufacturing.
Automation, Intelligent Factories, IT & OT Convergence, XaaS, AI, Smart Machines, IoT, Cobots, Technology
false
Technology and Digital Transformation
Industrial & Manufacturing industrial-and-manufacturing
Multiple Chart
LEK
View slide
Bar chart representing the automation potential and adoption scenarios in New Zealand by 2030.
Strategic Planning
Industrial & Manufacturing
Provides insights into the potential for automation in New Zealand’s workforce, highlighting different adoption scenarios.
Automation, New Zealand, Workforce, 2030, Scenarios
false
Strategic Planning
Industrial & Manufacturing industrial-and-manufacturing
Single Chart
McKinsey
View slide
Divided into three sections with text and small icons, the slide is utilitarian in design, focusing on the content. Blue highlights are used for emphasis in a clean black and white theme.
Technology and Digital Transformation
Technology & Software
The slide outlines the potential industry transformations due to tech trends like automation, AI, and connectivity. It is strategic in nature, ideal for discussions on future opportunities created by technology across different business horizontals, such as value chain automation, customer experience, and product development.
Automation, Productivity, Customer Experience, Innovation, Technology, Business Horizontals
false
Technology and Digital Transformation
Technology & Software technology-and-software
Header Vertical
McKinsey
View slide
Slide shows a central title with three images below, each representing a different report topic: industrial, process, and warehouse automation, with corresponding titles and seasonal indicators.
Industry Overview
Professional Services
Anticipates future detailed reports on factory and warehouse automation, serving as a teaser for upcoming publications.
Automation, Reports, Industry, Factory, Warehouse, Upcoming, Seasonal
false
Industry Overview
Professional Services professional-services
Diagram
LEK
View slide
Bar chart showing the changes in the number of jobs due to one additional robot in the manufacturing sector, by income level of country.
Market Analysis and Trends
Technology & Software
The slide examines the impact of automation and robotics on employment, focusing on the manufacturing sector. It shows how each additional robot affects job numbers in high-income, average, and low-income countries, highlighting the greater substitutive effect in low-income countries.
Automation, Robotics, Manufacturing, Job Loss
false
Market Analysis and Trends
Technology & Software technology-and-software
Mixed Chart
Roland Berger
View slide
The slide contains two columns with bulleted text, a chart titled "FIGURE 2: ROLE CLUSTERS OFFER A UNIQUE LENS ON EVOLVING WORK PATTERNS", and a section with a detailed explanation.
Market Analysis and Trends
Technology & Software
The slide discusses the impact of intelligent technologies on job roles, skill demands, and automation, emphasizing the reconfiguration of roles and the emergence of new patterns in work.
Automation, Workforce, Technology, Skills, Roles
false
Market Analysis and Trends
Technology & Software technology-and-software
Header Horizontal
Accenture
View slide
Column chart showing the percentage of time that can be automated in different activities like 'Manage', 'Expertise', and 'Interface', using a color gradient from blue to orange.
Operational Efficiency
Technology & Software
Details the percentage of time that could be automated in various workplace activities, highlighting sectors like data collection and processing as having high automation potential.
Automation, Workplace, Time Management, Efficiency, Sector
false
Operational Efficiency
Technology & Software technology-and-software
Single Chart
McKinsey
View slide
The slide contains a column graph comparing the tasks and resources of Function X today vs tomorrow. It also features a graphic of a robot to symbolize automation.
Operational Efficiency
Technology & Software
The slide discusses the need for companies to reposition functions due to the automation impact of digitalization, focusing on efficiency and redefining value propositions.
Automation, digitalization, efficiency, tasks, resources, repositioning
false
Operational Efficiency
Technology & Software technology-and-software
Multiple Chart
Roland Berger
View slide
This slide features a large circular progress chart showing a 50% reduction, and multiple icons with text descriptions on benefits of automated matching and remote closing.
Operational Efficiency
Transportation & Logistics
The slide illustrates how automation in transaction matching and business operations has improved efficiency and effectiveness in logistics, highlighting benefits like increased business partnering capacity and remote work adaptation.
Automation, efficiency, reconciliation, remote closing, logistics, business improvement, transaction matching, capacity enhancement, COVID-19 adaptation
false
Operational Efficiency
Transportation & Logistics transportation-and-logistics
Mixed Chart
Deloitte
View slide
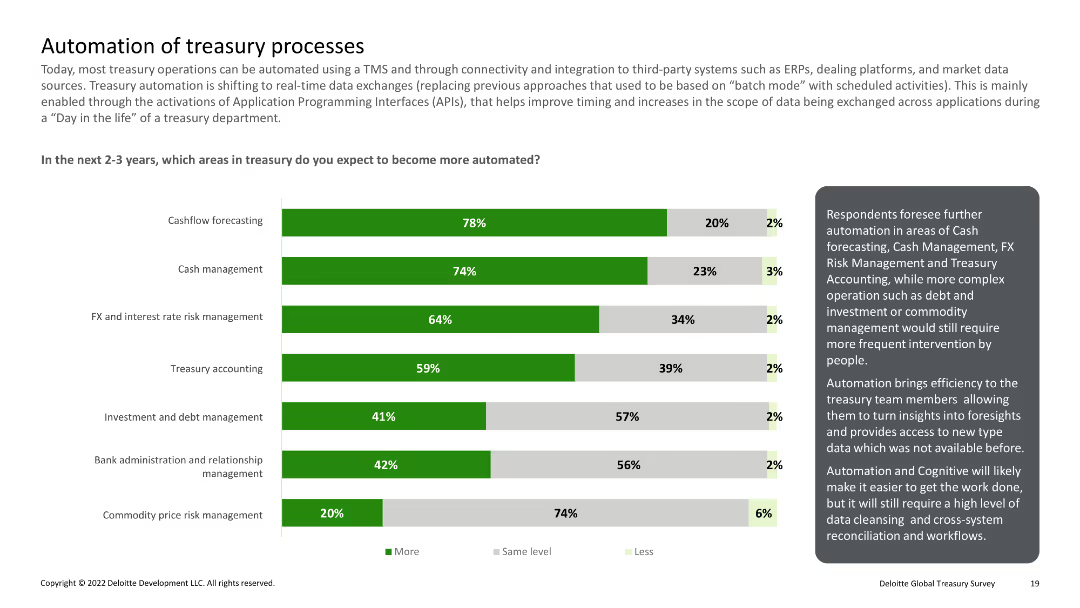
Column chart showing areas expected to be automated in the next 2-3 years, including cashflow forecasting and FX management
Technology and Digital Transformation
Financial Services
Predicts increased automation in various treasury processes over the next few years, emphasizing efficiency improvements.
Automation, treasury, processes, forecasting, management
false
Technology and Digital Transformation
Financial Services financial-services
Mixed Chart
Deloitte
View slide
Incorporates multiple bubble charts showing the value at stake by digital initiatives in the automotive industry. Uses color coding to differentiate between types of value and initiatives.
Market Analysis and Trends
Transportation & Logistics
Details the $2 trillion potential from digital initiatives in the automotive sector, emphasizing multimodal integration and digital enterprise.
Automotive, Digital Transformation, Industry Value, Societal Impact, Efficiency
false
Market Analysis and Trends
Transportation & Logistics transportation-and-logistics
Mixed Chart
Accenture
View slide
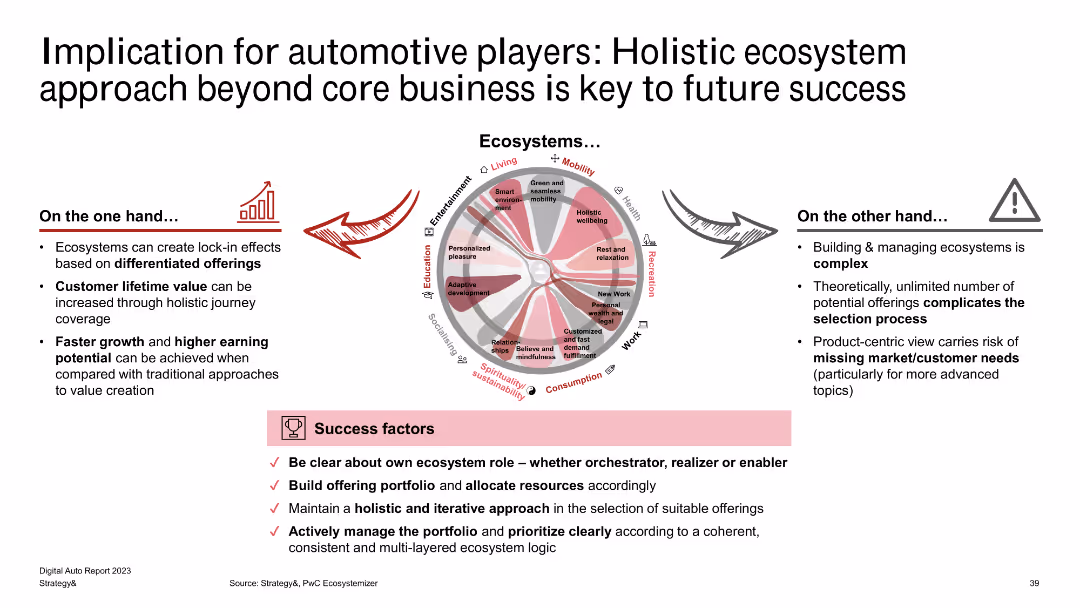
The slide displays a circular diagram representing different ecosystem domains (e.g., mobility, living, entertainment) and their interconnections. The bottom section lists success factors for ecosystem management.
Strategic Planning
Transportation & Logistics
The slide discusses the importance of a holistic ecosystem approach for automotive players, emphasizing the integration of various domains like mobility, living, and entertainment. It highlights success factors such as clear ecosystem roles and iterative approach in managing portfolios.
Automotive, Ecosystem, Holistic Approach, Mobility, Integration, Success Factors, Strategic Planning, Portfolio Management
false
Strategic Planning
Transportation & Logistics transportation-and-logistics
Diagram
PwC/Strategy&
View slide
Features a bar chart showing employment distribution across automotive-related industries.
Market Analysis and Trends
Transportation & Logistics
Provides a breakdown of employment within the automotive sector, analyzing job distribution across core and adjacent industries. Highlights the role of different segments in the automotive workforce.
Automotive, Employment, Industry Distribution, Core, Adjacent
false
Market Analysis and Trends
Transportation & Logistics transportation-and-logistics
Single Chart
BCG
View slide
Contains bar charts comparing job losses and gains from 2020 to 2030 across various industries.
Market Analysis and Trends
Transportation & Logistics
Shows projected job market changes within automotive and energy sectors due to shifts in technology and market dynamics, like the rise of electric vehicles and energy production.
Automotive, Energy, Job Market, 2030, Electric Vehicles, Technology Shift, Market Dynamics, Employment Changes
false
Market Analysis and Trends
Transportation & Logistics transportation-and-logistics
Mixed Chart
BCG
View slide
The slide contains a image of diagram, lists, and a large image of a car display technology on the right. The layout is text-heavy with bullet points and numerical data.
Financial Performance
Transportation & Logistics
This slide details Faurecia's financial performance in H1 2018, including sales growth, operating income, and net cash flow. It highlights technology partnerships and market expansion, particularly in China. It is useful for analyzing corporate financial health and strategic directions.
Automotive, Financials, Technology, China, Growth
false
Financial Performance
Transportation & Logistics transportation-and-logistics
Header Vertical
Deutsche Bank
View slide
Contains multiple column charts showing production volume of passenger cars by region (Global, North America, South America, Europe, South Asia, China, Japan/South Korea). The slide is divided into two sections with text on the left and charts on the right.
Market Analysis and Trends
Transportation & Logistics
Describes the slowing growth in the automotive industry due to the pandemic, supply chain disruptions, labor shortages, and inflation. Highlights regional differences in production volume trends from 2018 to 2030.
Automotive, Production, Trends, Regions, Growth
false
Market Analysis and Trends
Transportation & Logistics transportation-and-logistics
Multiple Chart
Roland Berger
Previous
Loading...
Hold On!
We are searching in our database
If nothing, comes up, please try different filters!
Column Chart
Heatmap
Chevron
Org Chart
Infographic
Callouts
Timeline
List
Graphic
Picture
Process Flow
Diagram
Paragraph
Map
Table
Framework
Subtitle
Takeaway Box
Icon
Other Chart
Radar Chart
Waterfall Chart
Mekko Chart
Pie Chart
Scatter Plot
Line Chart
Bar chart
Bullet points
Create a FREE account to continue browsing
Receive Instant Access to 1,000+ slides from companies like McKinsey, Google, and Goldman Sachs
First Name
Last Name
Email
Password
I agree to all
Terms & Privacy Policy
Thank you! Your submission has been received!
Oops! Something went wrong while submitting the form.
Have an account?
Sign in
Upgrade to PRO to Save slides
Advanced Search and Filters
Access to 15,000+ slides
Access to Category Pages
Save/Bookmark Slides
PowerPoint Template Library
Pick a Plan
MONTHLY
$12/month
Billed every month, Cancel anytime.
YEARLY
$9/year
Billed $108 annually, Cancel anytime.
Checkout for $12/month
Checkout for $108/yr
Secured by Stripe | AES-256 bit encryption