My Account
My Slides
Search by Category
Templates
View All Templates
Download Template Slides
Leave Feedback
Login
Logout
Get Started
Browse all Slides
Browse all Slides
Create a FREE Account
Instant access to 1,000+ real slides from top companies like McKinsey, BCG, Goldman Sachs, Google and many more!
First Name
Last Name
Email
Password
I agree to all
Terms & Privacy Policy
Thank you! Your submission has been received!
Oops! Something went wrong while submitting the form.
Have an account?
Sign in
Spark Your Next Big Idea with New Presentation Templates
VIEW ALL Templates
Welcome,
Welcome
PRO
Show Featured Only
Checkbox 8
Companies
Mckinsey
Bain
BCG
EY
Deloitte
Accenture
PwC/Strategy&
JP Morgan
Goldman Sachs
Morgan Stanley
Citigroup
Deutsche Bank
Barclays
LEK
KPMG
Kearney
Oliver Wyman
Booz Allen Hamilton
Gartner
IPSOS
Nielsen
Slide type
Text Only
Linear Flow
Vertical Flow
Single Chart
Header Horizontal
Mixed Chart
Header Vertical
Pillar
Multiple Chart
Graphic
Agenda
Title
Table
Framework
Industry
Technology & Software
Artificial Intelligence
Financial Services
Retail & E-commerce
Consumer Goods
Industrial & Manufacturing
Transportation & Logistics
Telecommunications
Real Estate & Construction
Hospitality & Tourism
Professional Services
Education & Training
Media & Entertainment
Agriculture & Food Production
Healthcare & Pharmaceuticals
Environmental Services & Sustainability
Government & Public Sector
Use Case
Mergers and Acquisitions
Performance Metrics and KPIs
Client Case Studies
Competitive Landscape
Corporate Finance and Valuation
Product and Service Analysis
Customer and Market Segmentation
Organizational Structure and Change
Industry Overview
Regulatory and Compliance
Risk Assessment and Management
Investment Analysis
Organizational Structure and Change
Human Resources and Talent Management
Financial Performance
Market Analysis and Trends
Sales and Business Development
Human Resources and Talent Management
Clear all
Thank you! Your submission has been received!
Oops! Something went wrong while submitting the form.
Tag
View slide
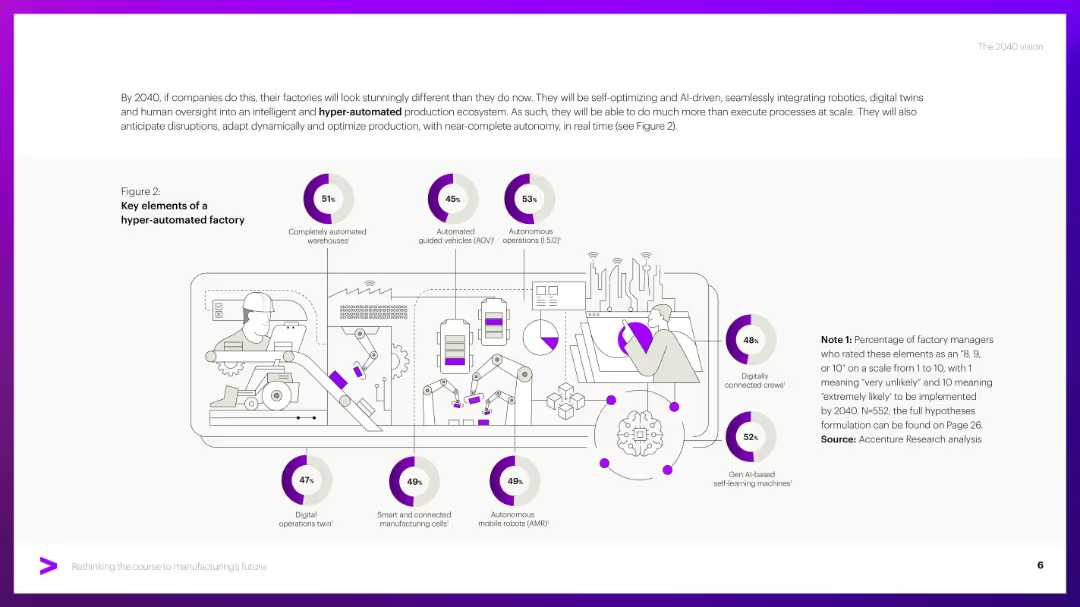
Central factory illustration with icons and annotated percentages arranged around it.
Technology and Digital Transformation
Industrial & Manufacturing
Highlights expected features in future factories including AGVs, AI machines, and digital twins. It includes survey-based stats indicating expected adoption likelihood of each technology by 2040.
Autonomous operations, AGV, AI robots, digital twins, smart factories
false
Technology and Digital Transformation
Industrial & Manufacturing industrial-and-manufacturing
Single Chart
Accenture
View slide
The slide displays a pyramid diagram representing the tiered service approach, and bar charts that quantify the firm's market opportunity. The layout is straightforward with a mix of graphics and bullet points.
Corporate Finance and Valuation
Financial Services
Illustrating Ayco's role in providing integrated corporate client services, the slide highlights the scope of Ayco's reach in the market and outlines its full-service offerings across corporate hierarchies.
Ayco, corporate clients, financial planning, market reach
false
Corporate Finance and Valuation
Financial Services financial-services
Framework
Goldman Sachs
View slide
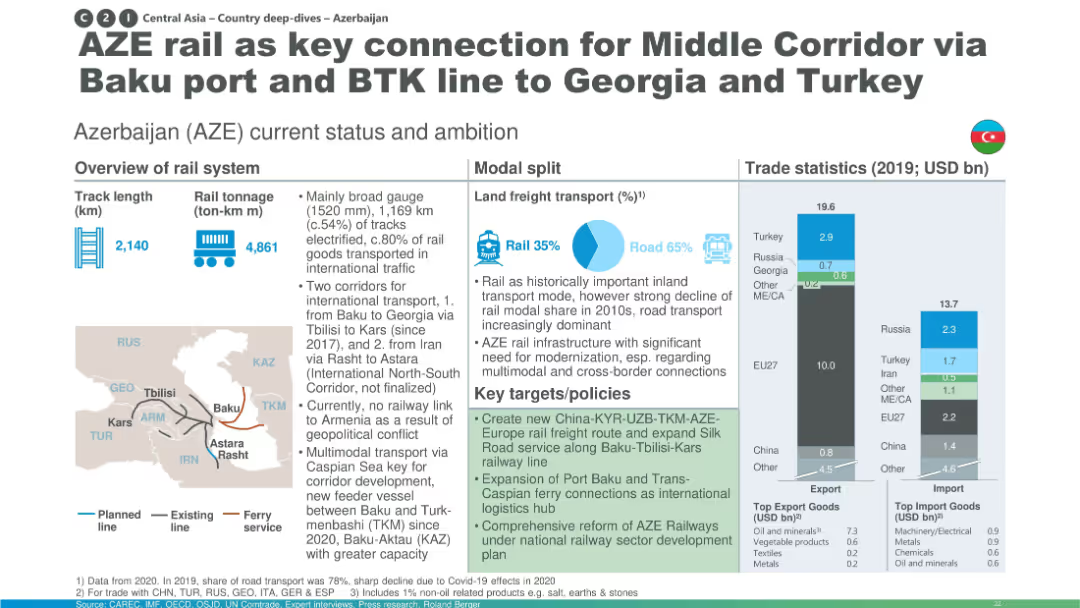
Structured layout with infographics and maps; includes stats on rail length, freight split, and trade data.
Industry Overview
Transportation & Logistics
This slide discusses Azerbaijan’s strategic position in the Middle Corridor, providing vital rail links from Baku to Georgia and Turkey. It shows modal transport data, trade volume (2019), and key initiatives like port and corridor expansions to enhance connectivity.
Azerbaijan, Baku, Middle Corridor, BTK, freight transport, trade, rail infrastructure
false
Industry Overview
Transportation & Logistics transportation-and-logistics
Multiple Chart
Roland Berger
View slide
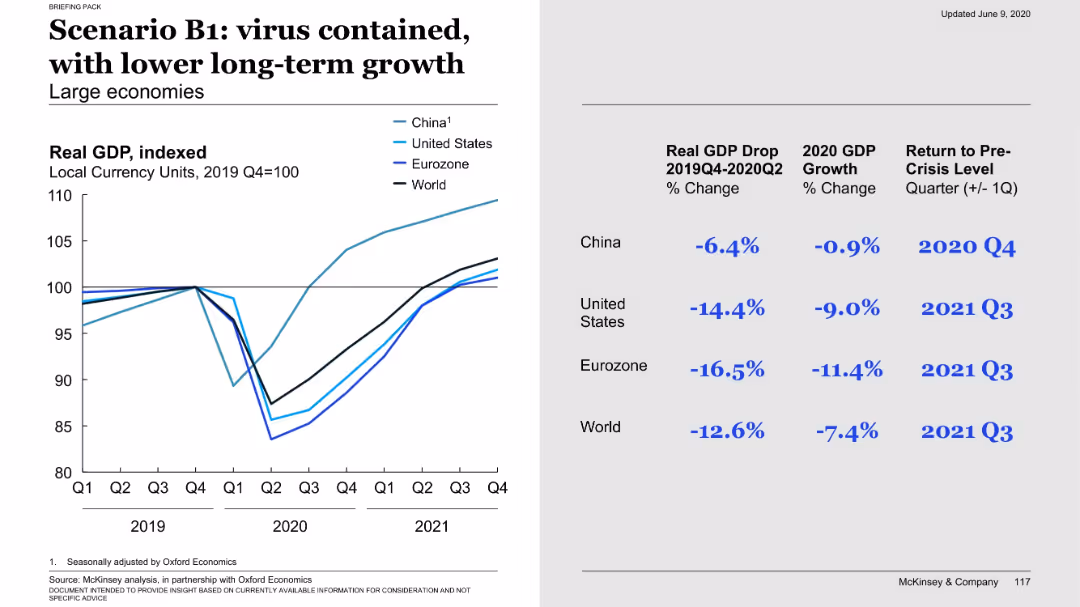
Left graph shows recovery followed by slower long-term trend; right side presents GDP drop and recovery timing across regions.
Financial Performance
Government & Public Sector
The B1 scenario anticipates virus containment but at the cost of sustained economic damage. Though a recovery occurs, long-term growth remains below previous levels. Data highlights severe GDP drops in US and Eurozone with recovery by Q3 2021.
B1, virus containment, long-term growth, GDP impact, economic damage, recovery timing, scenario
false
Financial Performance
Government & Public Sector government-and-public-sector
Mixed Chart
McKinsey
View slide
Column charts showing percentages of company performance indicators like sales, customer retention, and profits.
Market Analysis and Trends
Professional Services
Compares company performance metrics across B2B and B2C sectors, noting particularly strong performance in B2B services.
B2B, B2C, company performance, sales, profits
false
Market Analysis and Trends
Professional Services professional-services
Mixed Chart
Deloitte
View slide
Bar charts show the size and growth potential in B2B markets like merchant acquiring and SME lending.
Strategic Planning
Financial Services
Discusses growth opportunities in the B2B market, identifying high-growth and moderate-growth segments.
B2B, market growth, opportunities, merchant acquiring, SME
false
Strategic Planning
Financial Services financial-services
Single Chart
BCG
View slide
The slide contains text and graphical elements, including a large "16 of the top 30" in teal, a pie chart showing 72% of US businesses, and a financial figure for the cloud computing market size. The design is clean and modern.
Sales and Business Development
Professional Services
The slide highlights Ipsos' engagement with top B2B companies, emphasizing the predominance of B2B businesses in the US and the significant market size of cloud computing.
B2B, market opportunity, cloud computing, US, engagement
false
Sales and Business Development
Professional Services professional-services
Mixed Chart
IPSOS
View slide
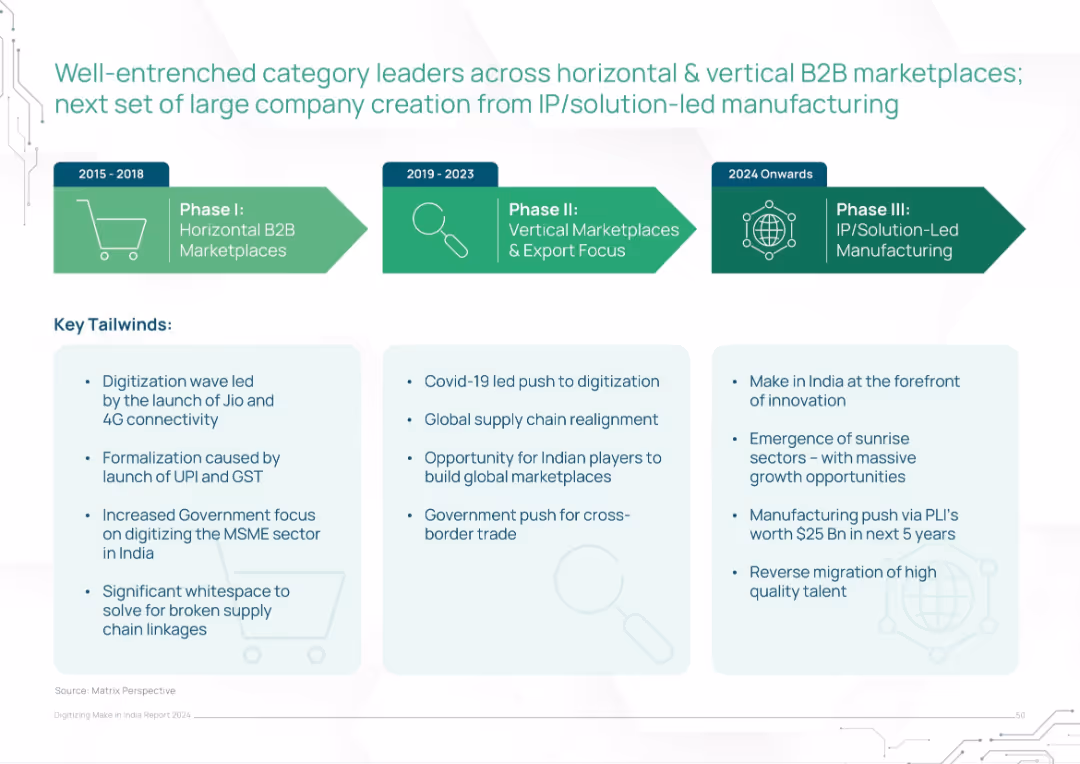
Horizontal timeline across three phases (2015–2024 onwards) with bullet points on key tailwinds underneath
Strategic Planning
Technology & Software
The slide presents a phased evolution of India’s B2B marketplace development, moving from horizontal platforms to IP-driven manufacturing. It identifies key enabling factors like digitization, GST/UPI formalization, Covid-related shifts, and emerging innovation-led sectors. Tailwinds are categorized by era and strategic influence.
B2B, marketplaces, India, digitization, UPI, IP-led, MSME, government policy, manufacturing evolution
false
Strategic Planning
Technology & Software technology-and-software
Pillar
BCG
View slide
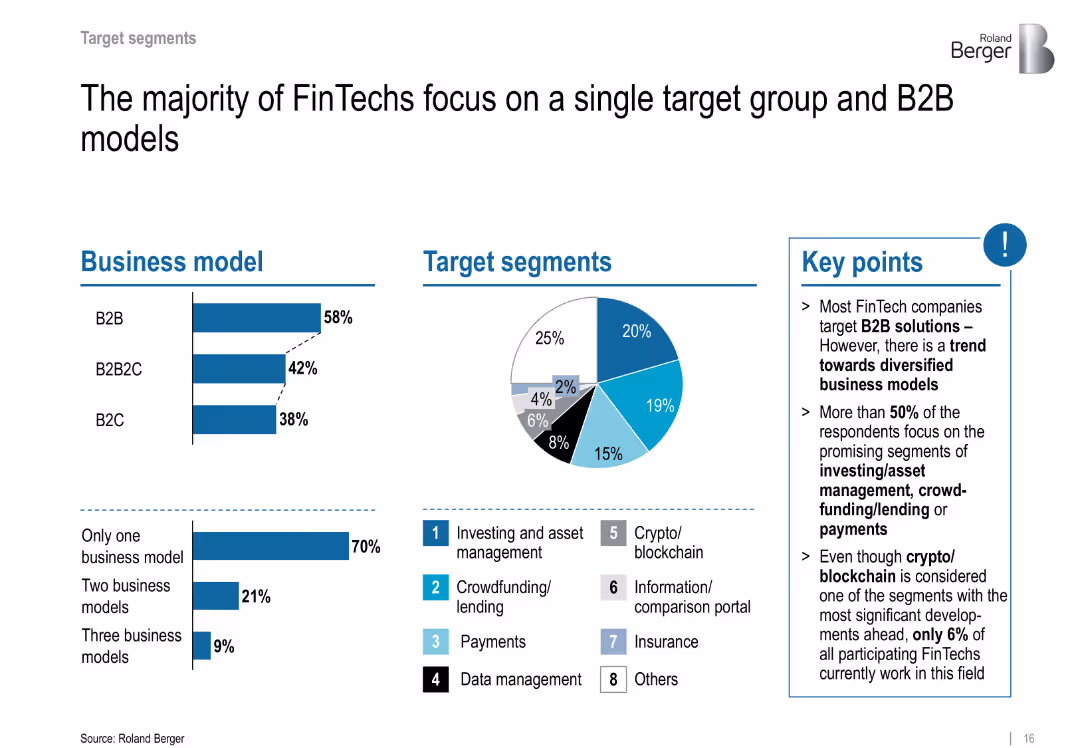
Dual column bar charts and pie chart; B2B and target segments distribution are illustrated
Customer and Market Segmentation
Financial Services
Shows that most FinTechs adopt B2B models and target promising segments like investing and crowdfunding. Despite the buzz, few are active in blockchain.
B2B, target segments, crypto, blockchain, investing, payments
false
Customer and Market Segmentation
Financial Services financial-services
Multiple Chart
Roland Berger
View slide
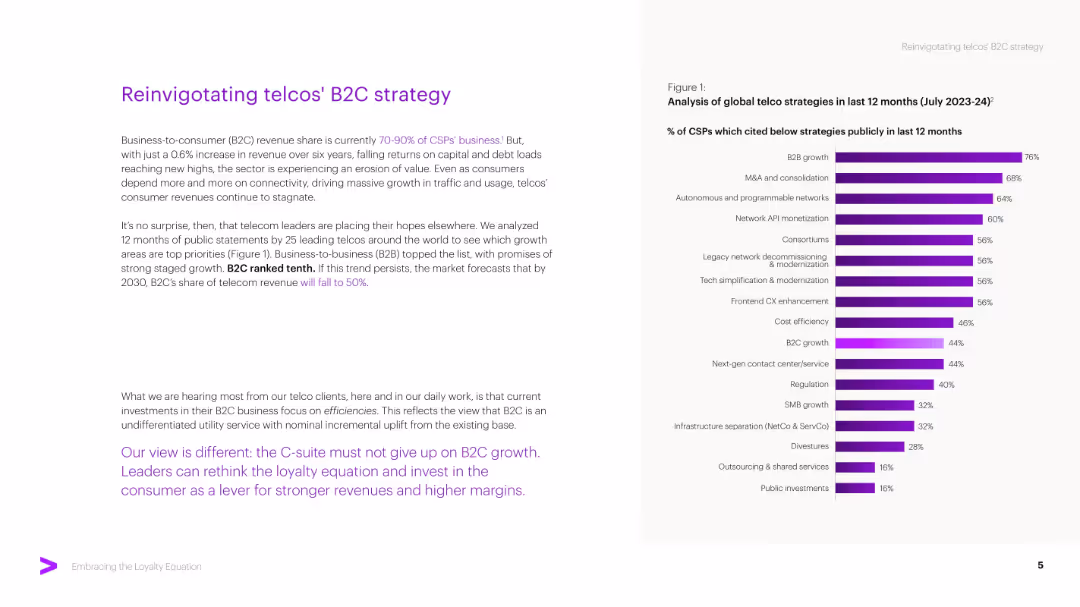
Two-column layout: left side narrative with bold purple callouts; right bar chart ranks CSP growth strategies. Minimalist design.
Strategic Planning
Telecommunications
The slide critiques telcos' overreliance on B2C and recommends pivoting to other growth strategies like B2B. It uses survey data to show that B2C ranks low among strategic priorities and advocates for renewed customer-centric innovation.
B2C Strategy, Telco, B2B Growth, Telecom, CSP, Revenue, Strategy, Efficiency
false
Strategic Planning
Telecommunications telecommunications
Mixed Chart
Accenture
View slide
The slide compares traditional B2C start-ups' expansion into B2B SME services with example cases and a graphical representation of their original and expanded service offerings.
Market Analysis and Trends
Financial Services
The slide outlines the strategic growth of B2C start-ups into adjacent B2B SME services, providing cases like Gojek and Shopee as examples. It's suitable for analyzing how B2C companies are diversifying into the B2B space to capture additional market segments and enhance value propositions.
B2C, B2B, Expansion, SME Services, Market Strategy, Start-ups
false
Market Analysis and Trends
Financial Services financial-services
Linear Flow
Kearney
View slide
Slide includes flow charts and bar charts depicting types of transactions in the informal market and their tender types.
Market Analysis and Trends
Financial Services
Details the prevalence of cash transactions in B2C and B2B sectors within informal markets, highlighting types of payments.
B2C, B2B, cash transactions, informal market, payment types
false
Market Analysis and Trends
Financial Services financial-services
Multiple Chart
BCG
View slide
Slide uses icons, text, and color blocks to present data.
Market Analysis and Trends
Technology & Software
Highlights the strong performance of B2C product companies in utilizing marketing analytics, compared to overall industry averages.
B2C, Product Companies, Marketing, Analytics, Performance, Comparison, Industry Average, Utilization
false
Market Analysis and Trends
Technology & Software technology-and-software
Table
Deloitte
View slide
Uses bar charts to compare market sizes and serviceable addressable market (SAM) across sectors like airtime and electricity.
Market Analysis and Trends
Telecommunications
Analyzes the B2C market dynamics, highlighting sectors with growth potential and those facing decline.
B2C, market dynamics, telecommunications, growth, SAM
false
Market Analysis and Trends
Telecommunications telecommunications
Single Chart
BCG
View slide
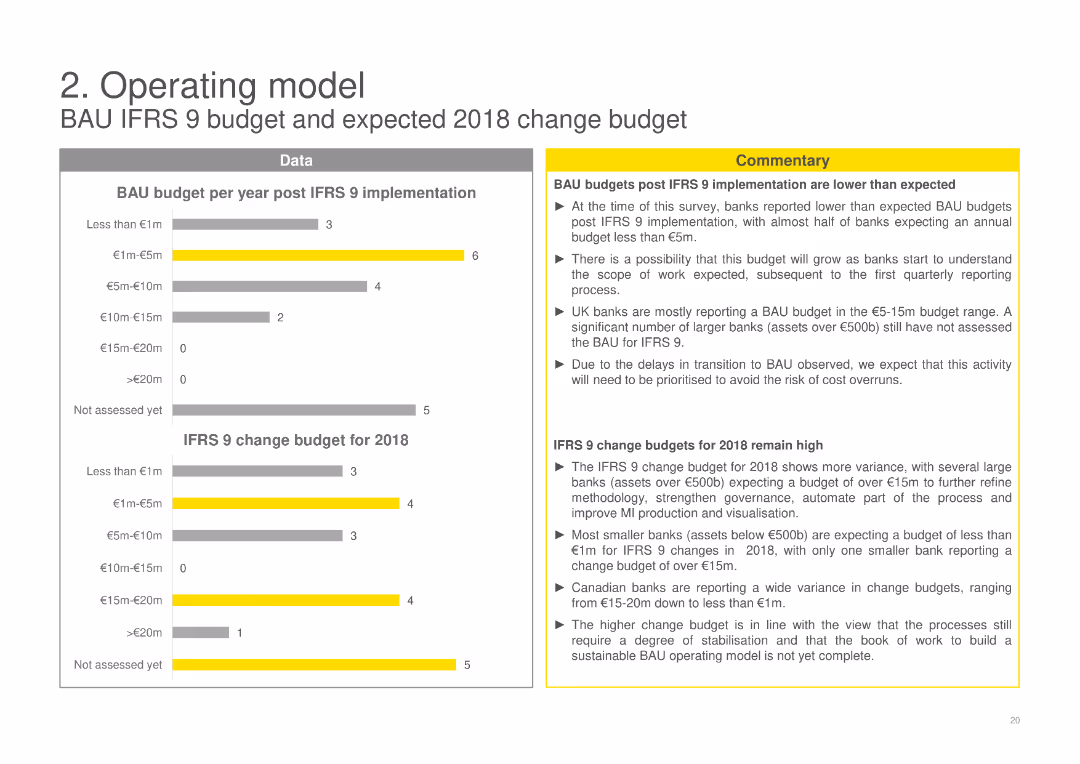
Contains column charts showing the BAU budget per year post-IFRS 9 implementation and the IFRS 9 change budget for 2018, with commentary discussing the variances in budget expectations and actual allocations among banks.
Operational Efficiency
Financial Services
Discusses the budget allocations for BAU post-IFRS 9 and change budgets for 2018, highlighting variances and expectations among banks, and the impact on financial planning and budgeting post-implementation.
BAU budget, IFRS 9, financial planning, budget variance, financial services
false
Operational Efficiency
Financial Services financial-services
Multiple Chart
EY
View slide
Text-heavy slide with a global map of BCG immunization rates among 1-year-olds; includes summary of research insights and implications.
Market Analysis and Trends
Healthcare & Pharmaceuticals
Suggests possible correlation between BCG vaccination and lower COVID-19 burden. While not proven, the hypothesis supports investigating existing vaccines’ protective effects. Map shows global BCG coverage to contextualize this theory.
BCG vaccine, COVID-19, immunity, correlation, vaccination, epidemiology
false
Market Analysis and Trends
Healthcare & Pharmaceuticals healthcare-and-pharmaceuticals
Mixed Chart
McKinsey
View slide
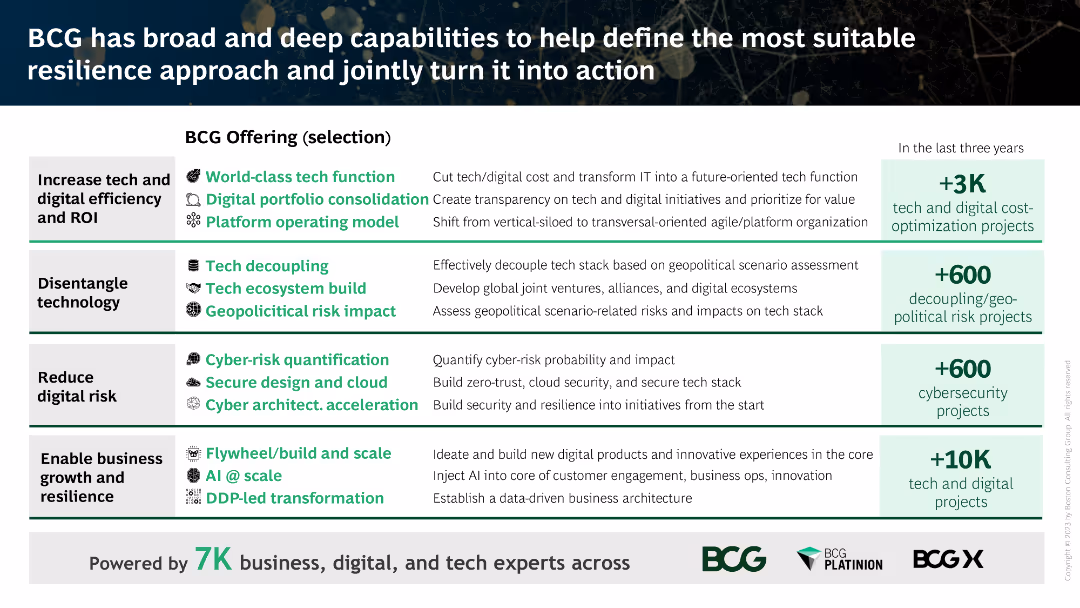
The slide is divided into multiple sections, each highlighting BCG's offerings with icons, descriptive text, and numerical data on completed projects.
Client Case Studies
Professional Services
This slide showcases BCG's capabilities in increasing tech efficiency, disentangling technology, reducing digital risk, and enabling business growth and resilience.
BCG, tech efficiency, digital risk, business growth, resilience
false
Client Case Studies
Professional Services professional-services
Vertical Flow
BCG
View slide
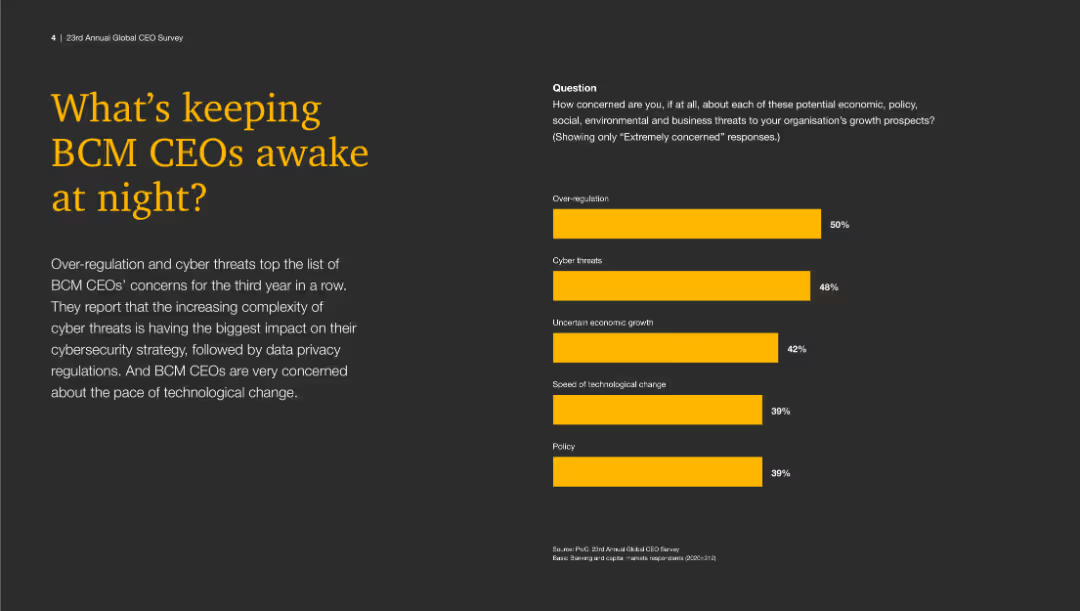
The slide uses a dark background with a large yellow title on the left. On the right, a column chart with yellow bars indicates different concerns for BCM CEOs.
Risk Assessment and Management
Financial Services
This slide shows the top concerns for BCM CEOs, including over-regulation, cyber threats, uncertain economic growth, speed of technological change, and policy concerns.
BCM, CEOs, risks, concerns, cybersecurity, regulation, growth, technology, policy
false
Risk Assessment and Management
Financial Services financial-services
Mixed Chart
PwC/Strategy&
View slide
The slide provides text descriptions and a diagram explaining BECCS technology, including its pros and cons, key features, and potential.
Technology and Digital Transformation
Energy & Utilities
Explains BECCS technology, highlighting its role in sustainable energy production and CO2 storage, as well as the benefits and challenges of this approach.
BECCS, bioenergy, carbon capture, storage, sustainable energy, biomass, technology explanation, pros and cons
false
Technology and Digital Transformation
Energy & Utilities energy-and-utilities
Table
Kearney
View slide
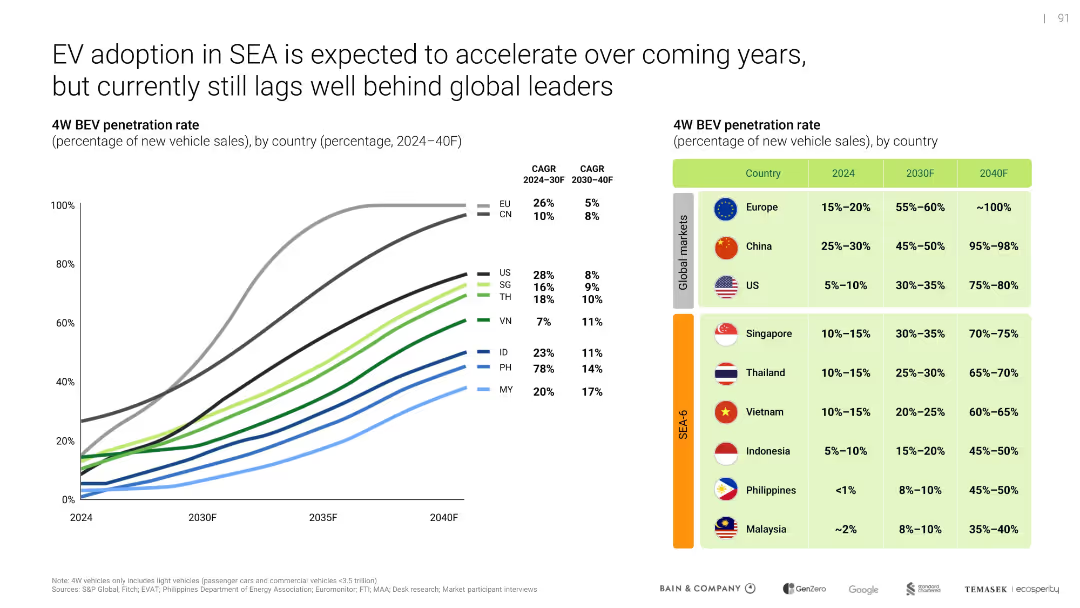
Line graph of BEV penetration projections with accompanying data table; green-blue color gradients distinguish countries
Market Analysis and Trends
Transportation & Logistics
Forecasts the BEV penetration rate in SEA-6 and global markets through 2040, indicating substantial growth but continued lag behind global leaders. Provides CAGR figures and expected market evolution.
BEV forecast, SEA-6, EV penetration, CAGR, global comparison, adoption
false
Market Analysis and Trends
Transportation & Logistics transportation-and-logistics
Mixed Chart
Bain
View slide
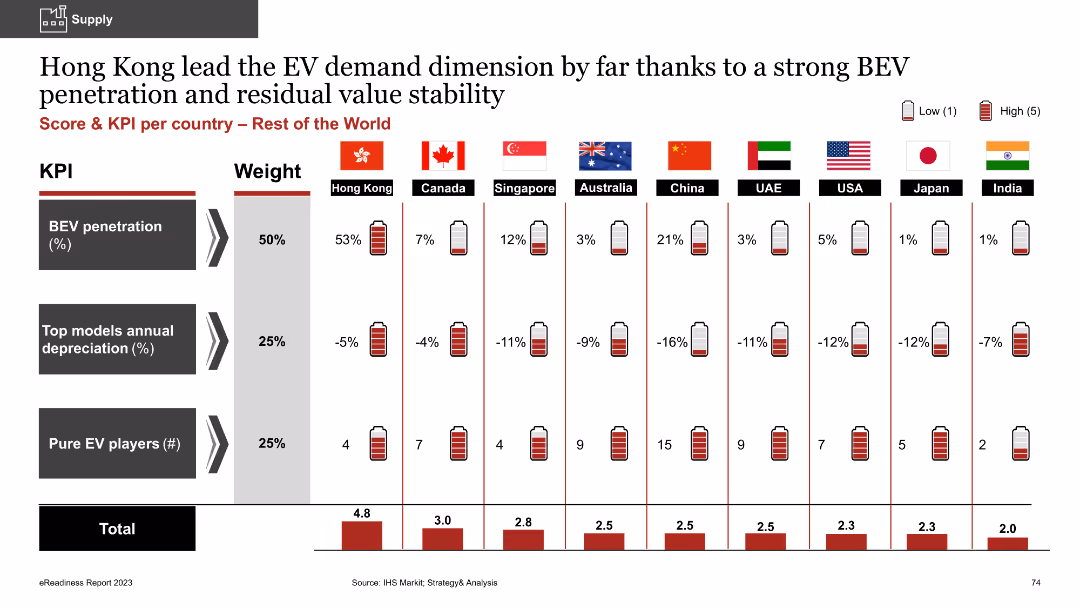
Column chart comparing BEV penetration, annual depreciation of top models, and number of pure EV players
Market Analysis and Trends
Energy & Utilities
The slide shows Hong Kong's leading position in BEV demand, comparing it with other countries based on metrics like BEV penetration, model depreciation rates, and the number of EV players
BEV penetration, demand, depreciation, EV players, comparative analysis
false
Market Analysis and Trends
Energy & Utilities energy-and-utilities
Multiple Chart
PwC/Strategy&
View slide
This slide shows a line graph tracking BEV sales over time, column charts of top selling OEMs and leading EV markets, highlighting significant growth particularly in Europe.
Market Analysis and Trends
Transportation & Logistics
Provides a detailed overview of global battery electric vehicle (BEV) sales trends, highlighting market leaders and key markets driving growth.
BEV sales, market trends, top OEMs, electric vehicles, Europe growth
false
Market Analysis and Trends
Transportation & Logistics transportation-and-logistics
Multiple Chart
PwC/Strategy&
View slide
Column chart displaying BEV penetration, depreciation rates, and EV players across European countries
Market Analysis and Trends
Energy & Utilities
The slide highlights Norway's dominance in BEV supply and market penetration compared to other European countries, showing metrics like BEV penetration percentage, top models' depreciation, and the number of pure EV players
BEV supply, market penetration, depreciation, EV players, European market
false
Market Analysis and Trends
Energy & Utilities energy-and-utilities
Multiple Chart
PwC/Strategy&
View slide
A comparative analysis layout showing potential profit losses for Asian and Chinese BEV manufacturers under different market scenarios. Utilizes color coding for clarity.
Risk Assessment and Management
Transportation & Logistics
Focuses on the challenges facing Asian and Chinese manufacturers in the BEV market, detailing the risk of significant profit losses under slow electrification scenarios and potential gains in more favorable conditions.
BEV, Asian OEMs, Chinese OEMs, profit loss, risks
false
Risk Assessment and Management
Transportation & Logistics transportation-and-logistics
Table
BCG
View slide
The slide includes two column charts comparing the application of BEV, GH2, and LH2 technologies across various segments for Vision 2030 and 2040. Comments section highlights key insights.
Market Analysis and Trends
Energy & Utilities
Discusses the expected dominance of BEV and Gaseous H2 in zero-emission technology over the next decade and limited application of Liquid H2.
BEV, GH2, LH2, zero-emission, Vision 2030, Vision 2040, application, comparison, market trends
false
Market Analysis and Trends
Energy & Utilities energy-and-utilities
Table
Roland Berger
View slide
A structured grid layout with bars and percentages showing projected profits under different market scenarios for BEV adoption. Each OEM type is categorized by strategy alignment.
Strategic Planning
Transportation & Logistics
Analyzes the impact of different electrification strategies on OEM profitability under various market scenarios, providing a strategic overview for stakeholders in the electric vehicle market.
BEV, OEM, profitability, market scenarios, strategy
false
Strategic Planning
Transportation & Logistics transportation-and-logistics
Table
BCG
View slide
A series of comparative charts analyzing the profit potential for different OEM archetypes across various BEV market scenarios. Uses a green-to-red gradient to indicate performance.
Investment Analysis
Transportation & Logistics
Discusses the profit potential for European and American OEMs in the BEV market under different electrification scenarios, highlighting the risks and opportunities associated with each market condition.
BEV, OEM, profits, market scenarios, electrification
false
Investment Analysis
Transportation & Logistics transportation-and-logistics
Table
BCG
View slide
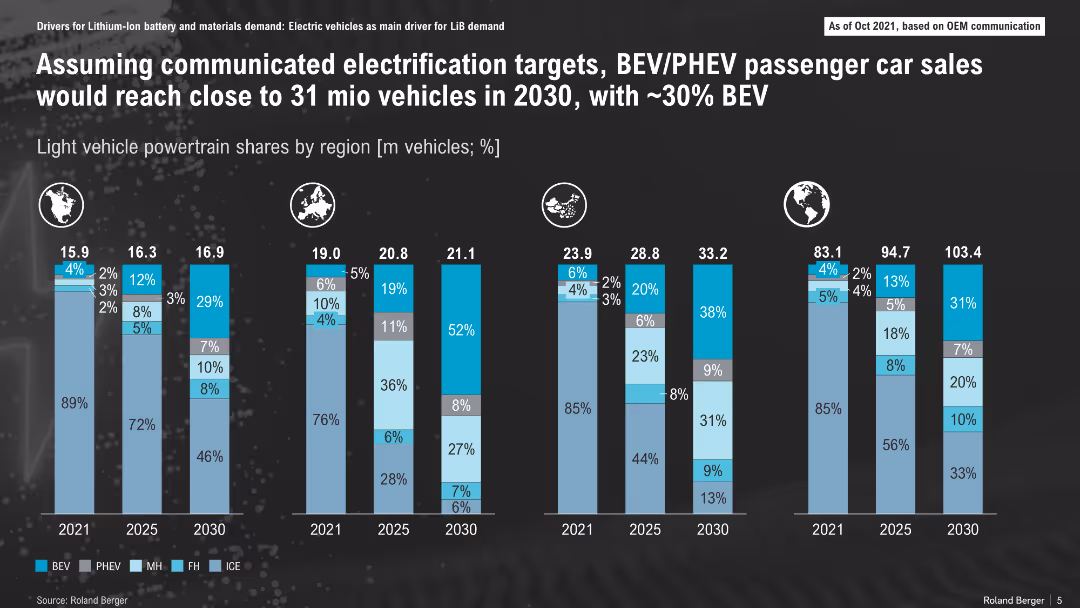
Multiple regional stacked bar charts showing EV powertrain mix forecast through 2030
Market Analysis and Trends
Transportation & Logistics
The slide forecasts EV adoption by region through 2030, indicating rising BEV and PHEV market shares, with BEV expected to hit ~30%. Europe leads in adoption while internal combustion engine (ICE) dominance continues in some regions through 2025.
BEV, PHEV, ICE, electrification, EV market, regional forecast, vehicle sales
false
Market Analysis and Trends
Transportation & Logistics transportation-and-logistics
Single Chart
Roland Berger
View slide
The slide includes a combination of a line chart showing gas prices and a column chart comparing TCO of Opel Corsa ICE vs. BEV. It has text in two columns with analysis and explanations.
Market Analysis and Trends
Energy & Utilities
The slide discusses the potential threat to the total cost of ownership (TCO) advantage of BEVs in Germany due to waning government incentives and rising electricity prices. It uses Opel Corsa as a case study for analysis.
BEV, TCO, Germany, Opel Corsa, incentives, analysis
false
Market Analysis and Trends
Energy & Utilities energy-and-utilities
Multiple Chart
PwC/Strategy&
View slide
Complex visual layout with annotated diagrams of BEV components and systems across a transparent car diagram. Highlights areas like battery, thermal management, and sensors with different color coding for clarity.
Technology and Digital Transformation
Industrial & Manufacturing
Outlines the specific components and systems involved in battery electric and autonomous vehicles, indicating areas of growth and innovation for TI Fluid Systems in these emerging technologies.
BEV, autonomous vehicles, thermal management, diagrams
false
Technology and Digital Transformation
Industrial & Manufacturing industrial-and-manufacturing
Diagram
Deutsche Bank
Previous
Loading...
Hold On!
We are searching in our database
If nothing, comes up, please try different filters!
Column Chart
Heatmap
Chevron
Org Chart
Infographic
Callouts
Timeline
List
Graphic
Picture
Process Flow
Diagram
Paragraph
Map
Table
Framework
Subtitle
Takeaway Box
Icon
Other Chart
Radar Chart
Waterfall Chart
Mekko Chart
Pie Chart
Scatter Plot
Line Chart
Bar chart
Bullet points
Create a FREE account to continue browsing
Receive Instant Access to 1,000+ slides from companies like McKinsey, Google, and Goldman Sachs
First Name
Last Name
Email
Password
I agree to all
Terms & Privacy Policy
Thank you! Your submission has been received!
Oops! Something went wrong while submitting the form.
Have an account?
Sign in
Upgrade to PRO to Save slides
Advanced Search and Filters
Access to 15,000+ slides
Access to Category Pages
Save/Bookmark Slides
PowerPoint Template Library
Pick a Plan
MONTHLY
$12/month
Billed every month, Cancel anytime.
YEARLY
$9/year
Billed $108 annually, Cancel anytime.
Checkout for $12/month
Checkout for $108/yr
Secured by Stripe | AES-256 bit encryption