My Account
My Slides
Search by Category
Templates
View All Templates
Download Template Slides
Leave Feedback
Login
Logout
Get Started
Browse all Slides
Browse all Slides
Create a FREE Account
Instant access to 1,000+ real slides from top companies like McKinsey, BCG, Goldman Sachs, Google and many more!
First Name
Last Name
Email
Password
I agree to all
Terms & Privacy Policy
Thank you! Your submission has been received!
Oops! Something went wrong while submitting the form.
Have an account?
Sign in
Spark Your Next Big Idea with New Presentation Templates
VIEW ALL Templates
Welcome,
Welcome
PRO
Show Featured Only
Checkbox 8
Companies
Mckinsey
Bain
BCG
EY
Deloitte
Accenture
PwC/Strategy&
JP Morgan
Goldman Sachs
Morgan Stanley
Citigroup
Deutsche Bank
Barclays
LEK
KPMG
Kearney
Oliver Wyman
Booz Allen Hamilton
Gartner
IPSOS
Nielsen
Slide type
Text Only
Linear Flow
Vertical Flow
Single Chart
Header Horizontal
Mixed Chart
Header Vertical
Pillar
Multiple Chart
Graphic
Agenda
Title
Table
Framework
Industry
Technology & Software
Artificial Intelligence
Financial Services
Retail & E-commerce
Consumer Goods
Industrial & Manufacturing
Transportation & Logistics
Telecommunications
Real Estate & Construction
Hospitality & Tourism
Professional Services
Education & Training
Media & Entertainment
Agriculture & Food Production
Healthcare & Pharmaceuticals
Environmental Services & Sustainability
Government & Public Sector
Use Case
Mergers and Acquisitions
Performance Metrics and KPIs
Client Case Studies
Competitive Landscape
Corporate Finance and Valuation
Product and Service Analysis
Customer and Market Segmentation
Organizational Structure and Change
Industry Overview
Regulatory and Compliance
Risk Assessment and Management
Investment Analysis
Organizational Structure and Change
Human Resources and Talent Management
Financial Performance
Market Analysis and Trends
Sales and Business Development
Human Resources and Talent Management
Clear all
Thank you! Your submission has been received!
Oops! Something went wrong while submitting the form.
Tag
View slide
This slide features six gauge charts and a timeline. The top three charts indicate risk-weighted assets for 'Trading', 'Lending', and 'Operational Risk and CVA', each in a gauge format with color gradations from green to red. Below, a timeline marks key regulatory milestones for Basel III. The bottom three gauges represent capital buffers: GSIB, SCB, and CCyB. The overall design is structured, with blue as a dominant color and the use of arrows and timeline for historical and future projections.
Regulatory and Compliance
Financial Services
The slide presents the current and projected regulatory capital requirements, including Basel III endgame and various capital buffers like GSIB, SCB, and CCyB, with an emphasis on the uncertainty and preparation for potential regulatory changes.
Basel III, Regulatory, Capital, Risk, GSIB, SCB, CCyB, Timeline, Gauge Chart
false
Regulatory and Compliance
Financial Services financial-services
Linear Flow
JP Morgan
View slide
Contains column chart representing financial values in billions, with a textual note on the baseline and regulatory surplus data, referencing APRA and Basel III standards.
Financial Performance
Financial Services
The slide highlights the APRA Basel III group capital at the end of December 2019, with a detailed breakdown of components affecting the group's regulatory surplus, useful for financial performance review or investor relations.
Basel III, capital, APRA, surplus, financial, group, performance, investment
false
Financial Performance
Financial Services financial-services
Single Chart
Goldman Sachs
View slide
A clear and structured table lists various business groups with corresponding Basel III Capital and ROE data. It's flanked by bar charts illustrating these metrics, providing a comparative and temporal visual analysis.
Regulatory and Compliance
Financial Services
Aimed at conveying Macquarie's capital adequacy and return on equity under Basel III regulations, the slide targets financial analysts and regulatory stakeholders interested in compliance and financial health metrics.
Basel III, capital, ROE, compliance, financial, regulatory, adequacy, analysis, business, metrics
false
Regulatory and Compliance
Financial Services financial-services
Table
Goldman Sachs
View slide
The slide displays a combination of bar and column charts to illustrate the impact of Basel III reforms on regulatory capital, showing significant reductions achieved through strategic actions.
Regulatory and Compliance
Financial Services
This slide discusses how strategic actions have reduced regulatory capital inflation, showing estimates of RWA increase from Basel III reforms and the net impact after mitigation.
Basel III, regulatory compliance, capital management, strategic actions, financial planning
false
Regulatory and Compliance
Financial Services financial-services
Mixed Chart
Credit Suisse
View slide
Two charts: a line chart showing MVR real GDP projections and a bar chart showing 2-year GDP growth for selected industries in Canada, both labeled as preliminary projections.
Market Analysis and Trends
Financial Services
This slide projects Metro Vancouver’s GDP growth and outlines the expected growth rates for various Canadian industries over the next two years.
Baseline projection, MVR GDP, preliminary, industry growth, 2-year projection, Metro Vancouver
false
Market Analysis and Trends
Financial Services financial-services
Multiple Chart
Deloitte
View slide
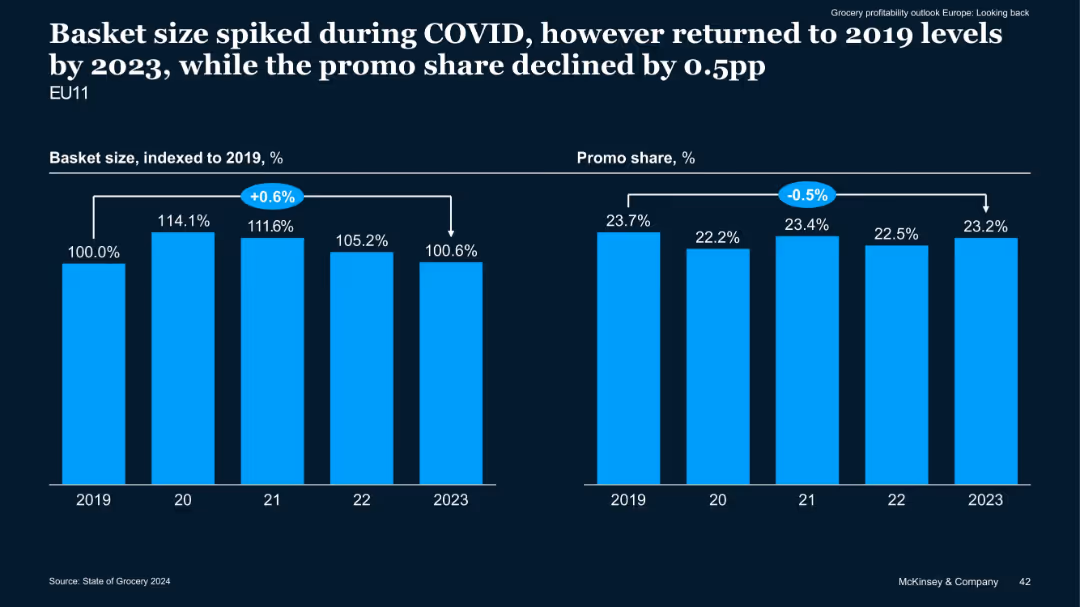
Dual bar chart comparison (basket size vs promo share) over years 2019–2023
Performance Metrics and KPIs
Retail & E-commerce
The slide tracks changes in grocery basket size and promotional share from 2019 to 2023. Basket size peaked during COVID but normalized by 2023, while promotional share decreased by 0.5 percentage points.
Basket Size, Promotions, COVID Impact, EU Grocery, Sales Trends
false
Performance Metrics and KPIs
Retail & E-commerce retail-and-e-commerce
Multiple Chart
McKinsey
View slide
Column chart of projected growth, pie chart with cost breakdown
Market Analysis and Trends
Industrial & Manufacturing
The projected growth in the EU market for battery chemicals
Battery Cells, EU Market, Growth, Chemical Costs, Energy
false
Market Analysis and Trends
Industrial & Manufacturing industrial-and-manufacturing
Mixed Chart
Morgan Stanley
View slide
Table comparing different battery technologies (e.g., Na sulfur, solid state battery) with parameters like technology readiness level, implementation timeline, energy density, and cycle life.
Technology and Digital Transformation
Technology & Software
The slide provides a comparative analysis of various frontier battery technologies, detailing their readiness levels, implementation timelines, energy densities, and potential applications. It highlights the importance of advancing battery technology to support the transition away from fossil fuels.
Battery Technology, Energy Storage, Implementation
false
Technology and Digital Transformation
Technology & Software technology-and-software
Table
Roland Berger
View slide
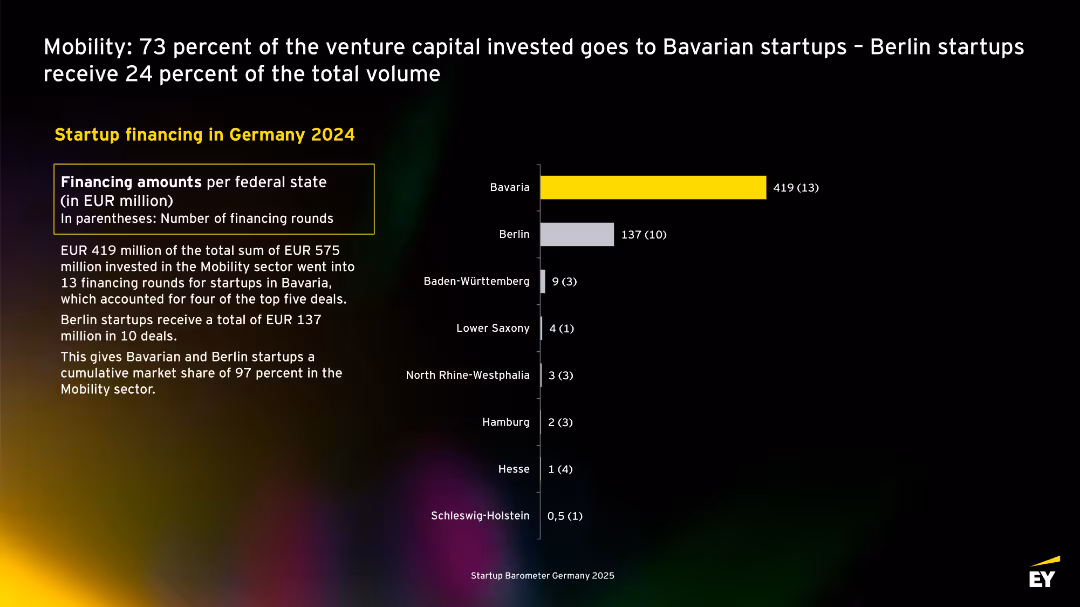
Bar chart ranks federal states by funding; yellow bar for Bavaria; narrative details dominance of Bavarian and Berlin startups.
Investment Analysis
Transportation & Logistics
Bavarian startups received EUR 419M of EUR 575M total mobility funding in 2024 (73%). Berlin follows with EUR 137M. The slide emphasizes Bavaria’s overwhelming share.
Bavaria, Berlin, venture capital, mobility, transportation, 2024, Germany, regional
false
Investment Analysis
Transportation & Logistics transportation-and-logistics
Mixed Chart
EY
View slide
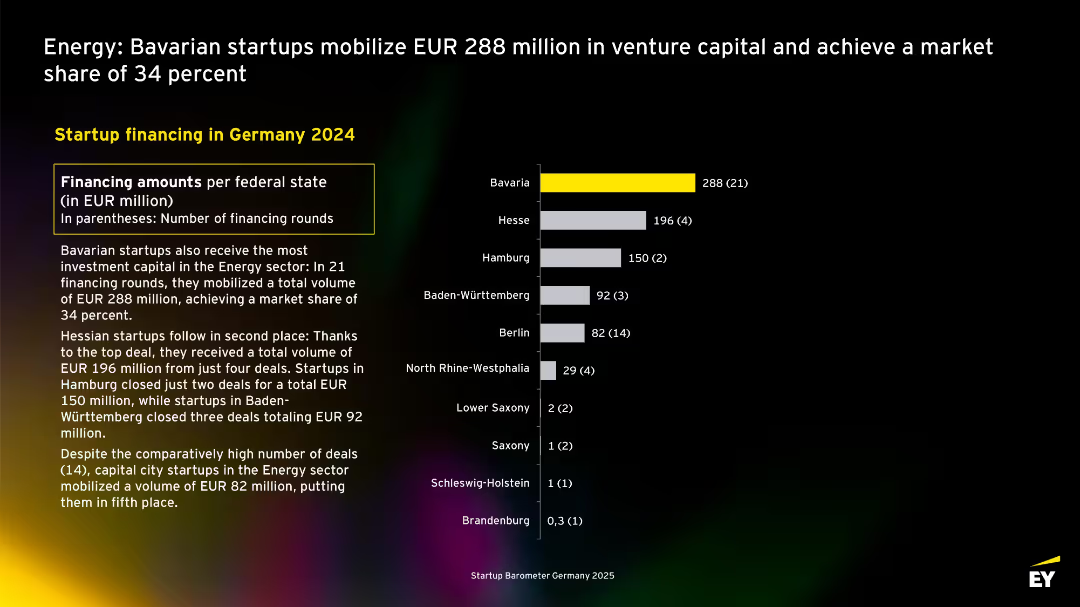
Same layout as prior slide, but shows investment by federal state with Bavaria in yellow as market leader; bar chart on right, text and table on left.
Investment Analysis
Energy & Utilities
Focuses on geographic distribution of energy startup funding in Germany. Bavaria leads with EUR 288M from 21 rounds. Hesse, Hamburg, and Baden-Württemberg follow. Despite more deals, Berlin raised less capital.
Bavaria, energy startups, Germany, state comparison, venture capital, 2024, market share
false
Investment Analysis
Energy & Utilities energy-and-utilities
Mixed Chart
EY
View slide
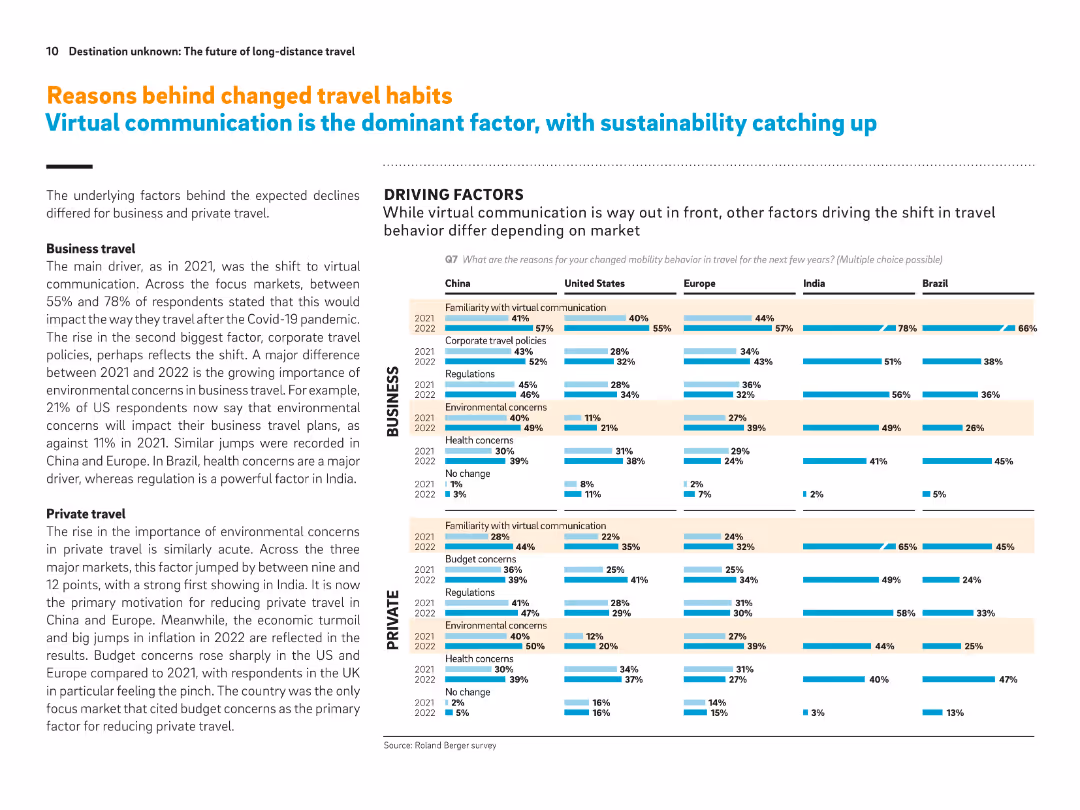
Grid of horizontal bar charts per country showing reasons for behavior change in business and private travel. Emphasis on communication, sustainability, cost.
Market Analysis and Trends
Transportation & Logistics
This slide details country-level breakdowns of reasons for changing travel behavior post-Covid. Virtual communication is the top factor for business travel changes, while environmental and cost concerns lead in private travel. Charts show shifts from 2021 to 2022.
Behavior change, virtual communication, environmental concern, business travel, private travel, travel reduction, cost impact
false
Market Analysis and Trends
Transportation & Logistics transportation-and-logistics
Multiple Chart
Roland Berger
View slide
Diagram showing the process of crisis management and community-based interventions leading to treatment in the community. Visual elements include icons and flow arrows.
Strategic Planning
Healthcare & Pharmaceuticals
This slide explains how an SMI IMD Waiver can help expand the capacity for behavioral health services, providing a detailed flow of the process from crisis management to private sector involvement.
Behavioral health, capacity expansion, community-based interventions, private sector, New Hampshire Hospital, crisis management, SMI IMD Waiver
false
Strategic Planning
Healthcare & Pharmaceuticals healthcare-and-pharmaceuticals
Diagram
Alvarez & Marsal
View slide
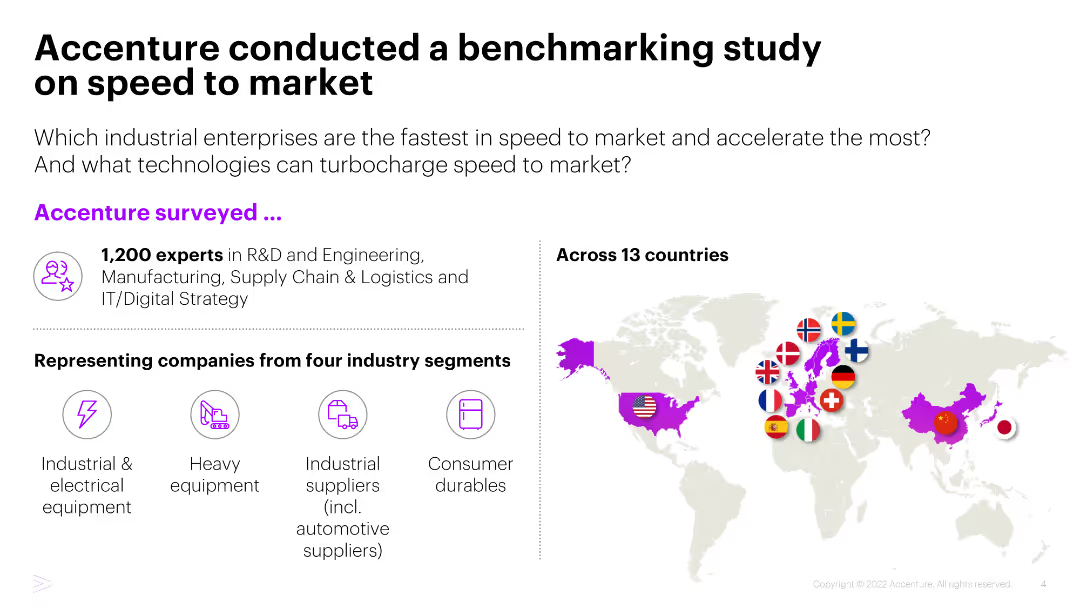
Map showing surveyed countries and icons representing industry segments included in the benchmarking study.
Market Analysis and Trends
Industrial & Manufacturing
The slide summarizes a benchmarking study by Accenture on industrial enterprises' speed to market, detailing the survey's scope, industry segments, and geographical coverage.
Benchmarking study, Speed to market, Industrial enterprises, Survey, Market analysis
false
Market Analysis and Trends
Industrial & Manufacturing industrial-and-manufacturing
Header Vertical
Accenture
View slide
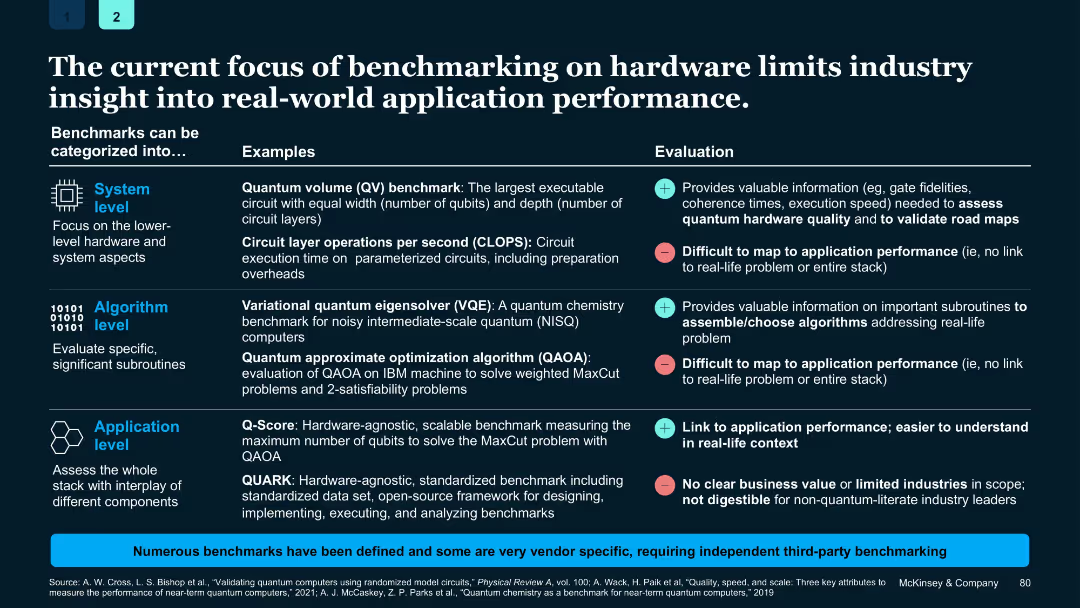
Three-tiered table comparing benchmark levels (System, Algorithm, Application); columns for examples and evaluation; uses color-coded markers.
Performance Metrics and KPIs
Artificial Intelligence
Compares quantum benchmarking types and their relevance to real-world applications. Highlights gap between technical metrics and business performance indicators, suggesting need for broader, application-linked benchmarks.
Benchmarking, performance, system-level, application, quantum evaluation
false
Performance Metrics and KPIs
Artificial Intelligence artificial-intelligence
Table
McKinsey
View slide
Two-side layout separating benefits and risks of connectivity, accompanied by relevant symbols.
Strategic Planning
Professional Services
Highlights the benefits and risks associated with advanced connectivity, giving leaders strategic insights.
Benefits, Risks, Connectivity, Strategy, Digital Transformation, IoT
false
Strategic Planning
Professional Services professional-services
Boxed
McKinsey
View slide
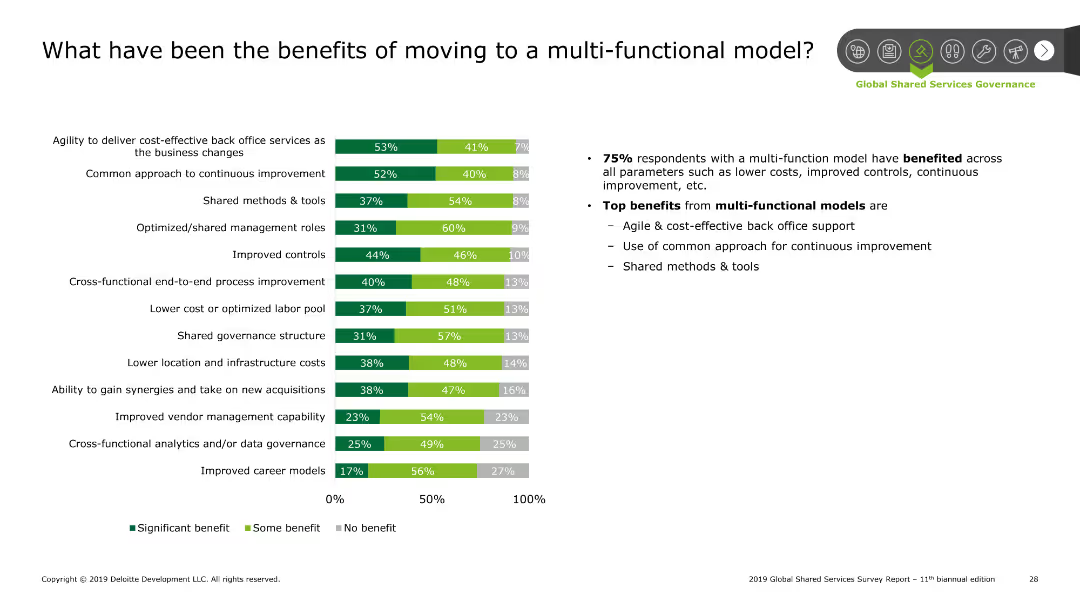
The slide contains a column chart showing the benefits of moving to a multi-functional model. There are three categories in the chart: Significant benefit, Some benefit, No benefit.
Operational Efficiency
Professional Services
This slide presents data on the benefits of adopting a multi-functional model in organizations. Key benefits include cost-effectiveness, improved controls, and shared methods.
Benefits, multi-functional model, cost savings, improvement, controls
false
Operational Efficiency
Professional Services professional-services
Mixed Chart
Deloitte
View slide
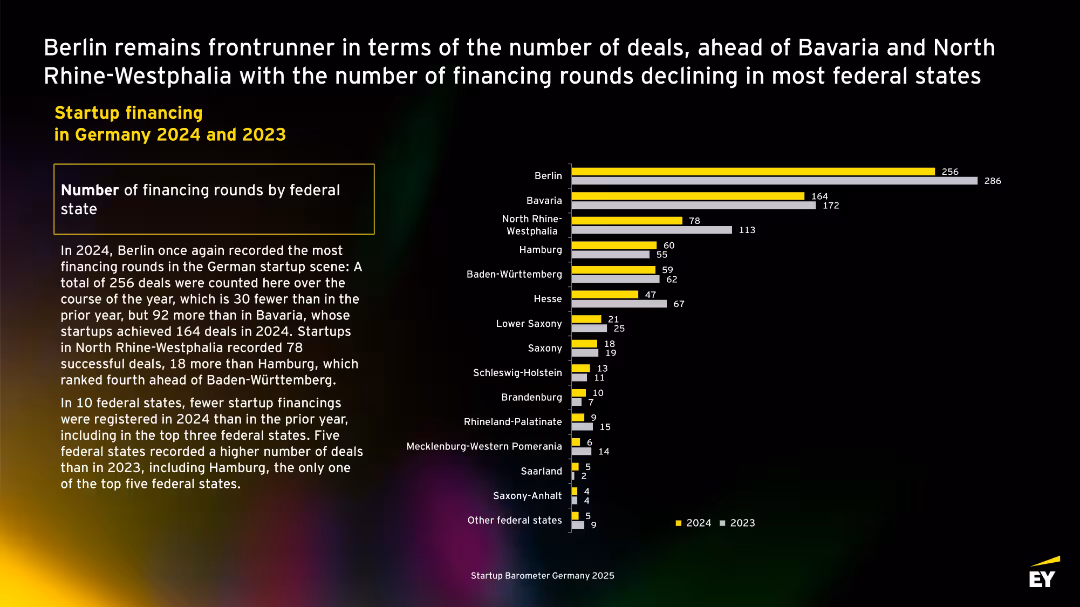
Horizontal bar chart with yellow (2024) and gray (2023) bars representing financing rounds across German federal states; accompanied by a text box summarizing insights; dark background with highlighted yellow labels.
Market Analysis and Trends
Technology & Software
Compares startup financing activity across German states in 2023 and 2024. Berlin leads in number of financing rounds, followed by Bavaria and North Rhine-Westphalia. The slide highlights regional differences and declining trends in most states.
Berlin, Bavaria, North Rhine-Westphalia, financing rounds, startups, federal states, EY, 2024, 2023
false
Market Analysis and Trends
Technology & Software technology-and-software
Mixed Chart
EY
View slide
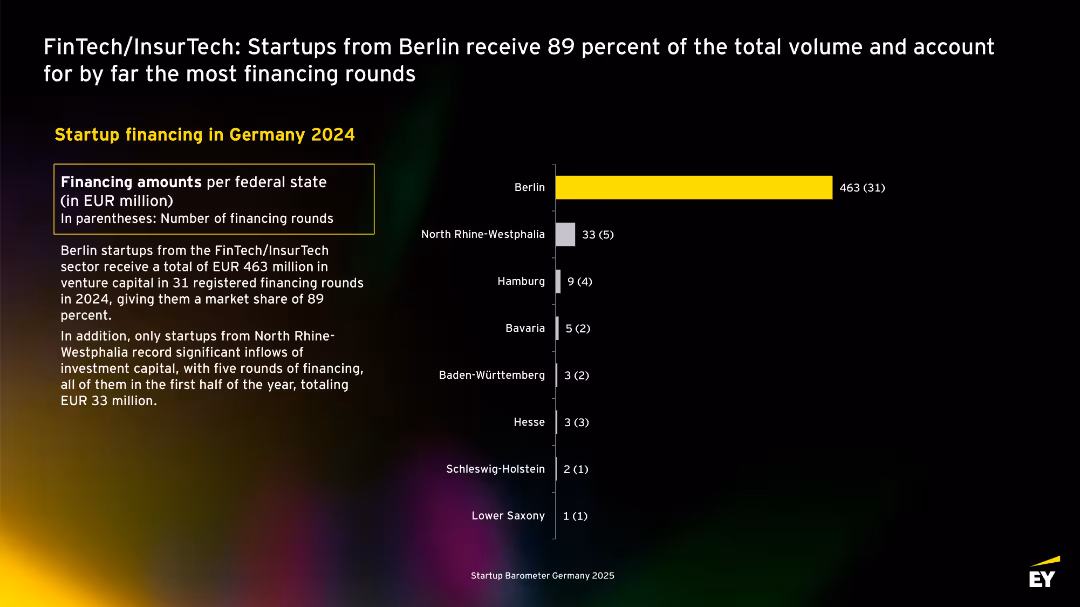
Bar chart shows Berlin dominating regional funding; yellow bar; left text explains Berlin’s overwhelming share of capital.
Investment Analysis
Financial Services
Berlin-based FinTech/InsurTech startups secured EUR 463M in 2024, comprising 89% of the sector's VC volume. 31 rounds were registered in Berlin. Other states lag far behind.
Berlin, FinTech, InsurTech, funding rounds, venture capital, 2024, Germany
false
Investment Analysis
Financial Services financial-services
Mixed Chart
EY
View slide
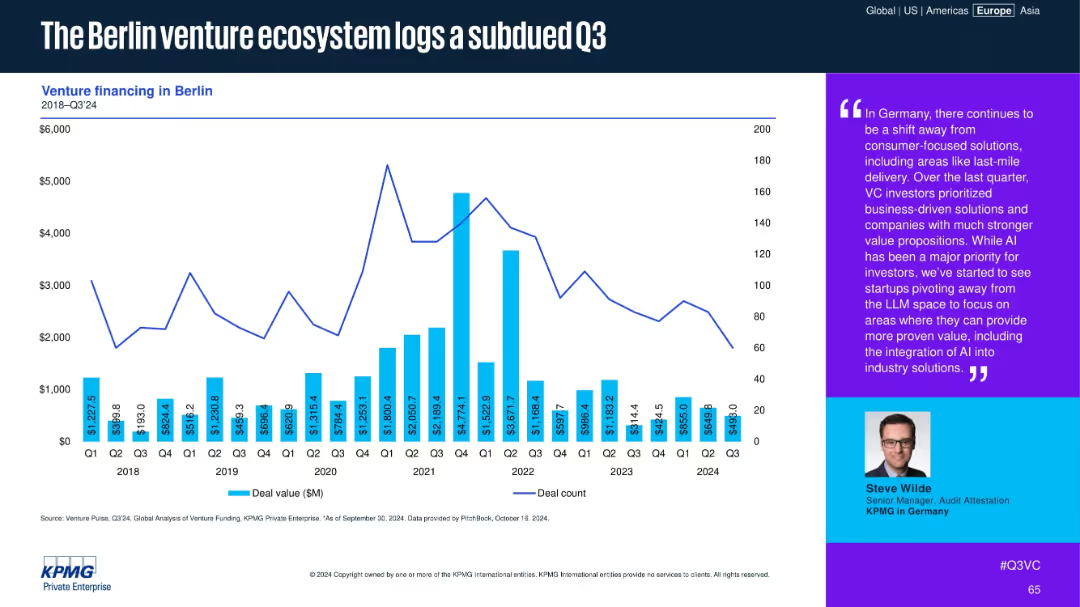
Bar and line chart of venture financing in Berlin (2018–Q3 2024), with quote highlighting VC investor behavior.
Market Analysis and Trends
Financial Services
Berlin's VC ecosystem softened in Q3 2024. Commentary suggests a shift away from last-mile delivery and LLMs, toward business-oriented solutions and AI integration into industrial processes, as investors pursue proven value.
Berlin, VC funding, Q3 2024, AI solutions, investor behavior, industry pivot, last-mile delivery, business focus
false
Market Analysis and Trends
Financial Services financial-services
Mixed Chart
KPMG
View slide
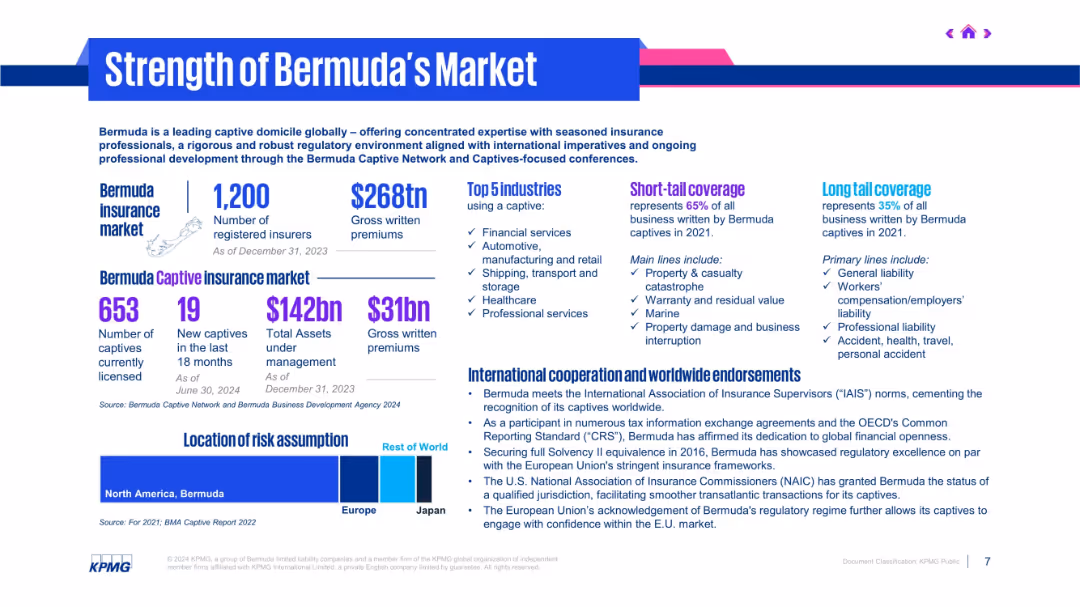
Infographic layout with multiple blocks, charts, and figures using purple and blue tones.
Industry Overview
Financial Services
The slide presents Bermuda’s position as a leading captive insurance market, detailing metrics like number of insurers, gross premiums, and top industries. It highlights coverage types, international endorsements, and geographic risk assumption.
Bermuda, captives, insurance market, premiums, endorsements, coverage
false
Industry Overview
Financial Services financial-services
Mixed Chart
KPMG
View slide
Moderate complexity slide with a line graph showing the decline in 'best practice' mentions, juxtaposed with a cityscape image reflecting corporate progress.
Strategic Planning
Professional Services
Discusses trends in corporate strategy with a focus on moving away from 'best practice' towards unique business reinvention methods.
Best Practice, Corporate Strategy, Trends, Reinvention, Performance
false
Strategic Planning
Professional Services professional-services
Multiple Chart
Accenture
View slide
The slide features pie charts showing the development of self-confidence, presentation skills, and business networking skills among care-experienced youth.
Client Case Studies
Education & Training
The slide presents the Beyond Your Limits program, which provides targeted support for care-experienced young people through skills training and mentoring.
Beyond Your Limits, care-experienced, skills training, mentoring
false
Client Case Studies
Education & Training education-and-training
Multiple Chart
EY
View slide
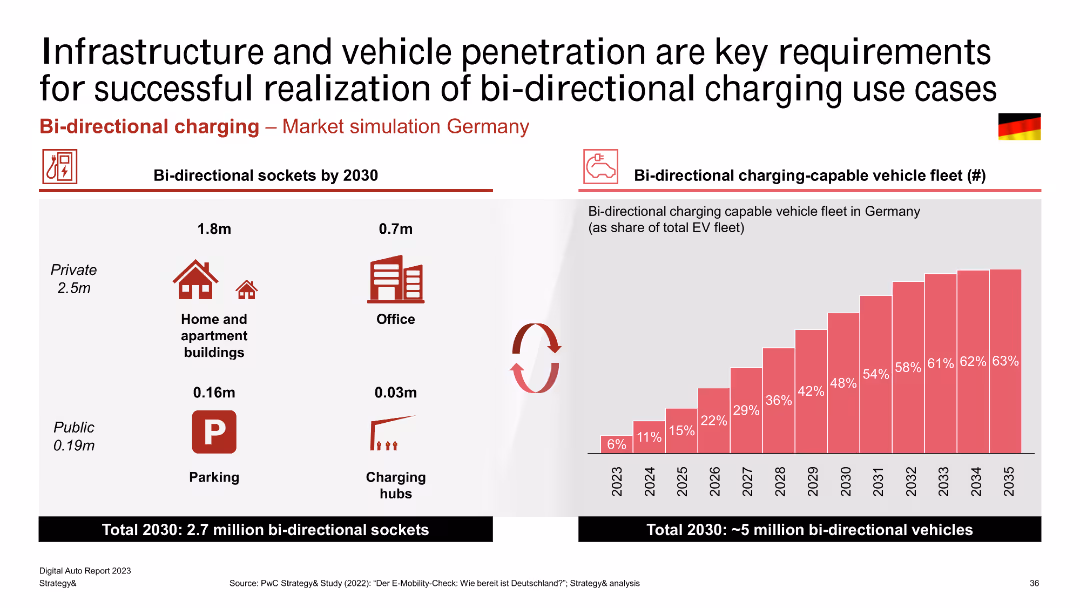
This slide presents a combination of infographics and column charts, highlighting projections for bi-directional sockets and vehicle fleet penetration in Germany by 2030. It includes icons and percentage bars.
Market Analysis and Trends
Energy & Utilities
The slide projects the number of bi-directional sockets and bi-directional charging-capable vehicles in Germany by 2030. It highlights the significant growth expected in private, office, and public charging hubs, emphasizing the infrastructure needed for this transition.
Bi-directional Charging, Infrastructure, Vehicle Penetration, Germany, Market Simulation, Charging Hubs, Projection
false
Market Analysis and Trends
Energy & Utilities energy-and-utilities
Mixed Chart
PwC/Strategy&
View slide
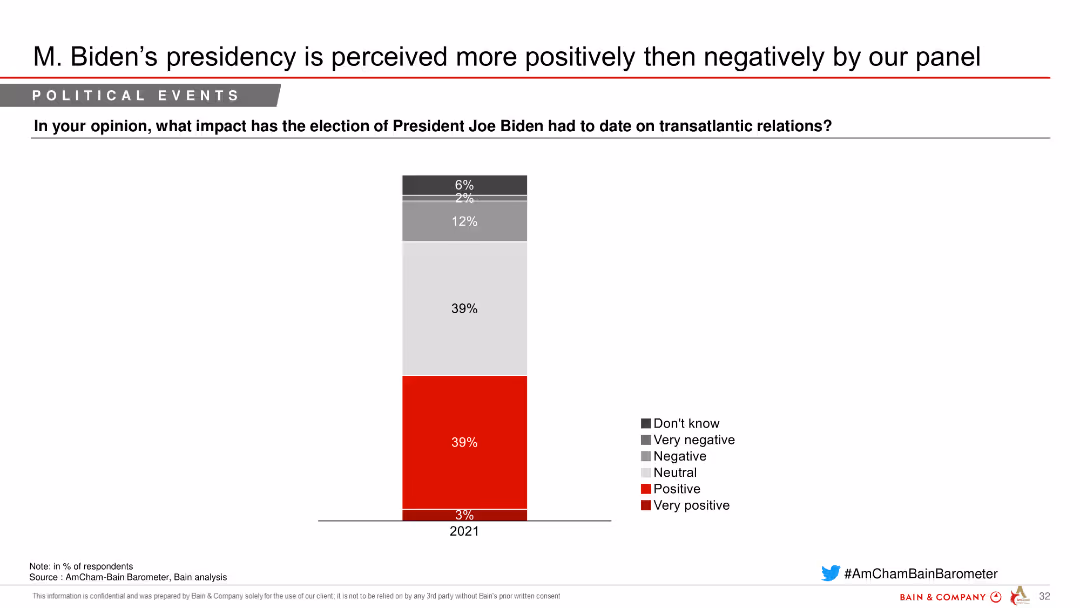
Column chart depicting perceptions of President Joe Biden's impact on transatlantic relations, with segmented responses indicating varying degrees of positivity and negativity.
Market Analysis and Trends
Government & Public Sector
Shows the impact of President Joe Biden's election on transatlantic relations, with a majority seeing it positively, as indicated by a survey of respondents.
Biden, transatlantic, relations, perceptions, survey
false
Market Analysis and Trends
Government & Public Sector government-and-public-sector
Single Chart
Bain
View slide
Slide has bullet points, timelines for data analytics evolution, and column charts showing spend and balance retention with big data. Blue is the primary color.
Technology and Digital Transformation
Financial Services
Focuses on the evolution and future potential of data analytics in enhancing targeting capabilities and the impact of big data on customer retention.
Big Data, Analytics, Targeting, Retention, Spend Behavior, Omni-Channel
false
Technology and Digital Transformation
Financial Services financial-services
Multiple Chart
Citigroup
View slide
Slide displays a line graph illustrating the global Big Data Analytics market forecast. The layout includes bulleted text and a highlighted callout box, making it easy to follow.
Market Analysis and Trends
Environmental Services & Sustainability
Analyzes the integration of Earth Observation data within the Big Data context, forecasting significant growth in EO Big Data revenues. This slide is instrumental for discussions on market opportunities and strategic planning.
Big Data, Earth Observation, market forecast, revenue growth, analytics
false
Market Analysis and Trends
Environmental Services & Sustainability environmental-services-and-sustainability
Mixed Chart
PwC/Strategy&
View slide
Circular diagram highlighting the fragmentation of health data ecosystems and a list of the four dimensions of big data in healthcare (Volume, Veracity, Variety, Velocity).
Market Analysis and Trends
Healthcare & Pharmaceuticals
The slide highlights the importance of big data in the healthcare sector, emphasizing the need to analyze the increasing volumes of data. It discusses the fragmentation of health data ecosystems and outlines the four key dimensions of big data that are crucial for deriving actionable insights in healthcare.
Big Data, Healthcare, Data Analysis, Ecosystems
false
Market Analysis and Trends
Healthcare & Pharmaceuticals healthcare-and-pharmaceuticals
Diagram
Roland Berger
View slide
A diagram slide featuring logos of DIRECTV, Vizio, Dish, and Roku at the top. Below, a four-step integration process for Nielsen Measurement with colored arrows indicating data flow.
Technology and Digital Transformation
Media & Entertainment
Describes the steps for integrating big data into Nielsen measurement, including data quality, demographics, exposure, and ratings calculations.
Big data, Nielsen, integration, data quality, demographics, exposure, ratings
false
Technology and Digital Transformation
Media & Entertainment media-and-entertainment
Linear Flow
Nielsen
View slide
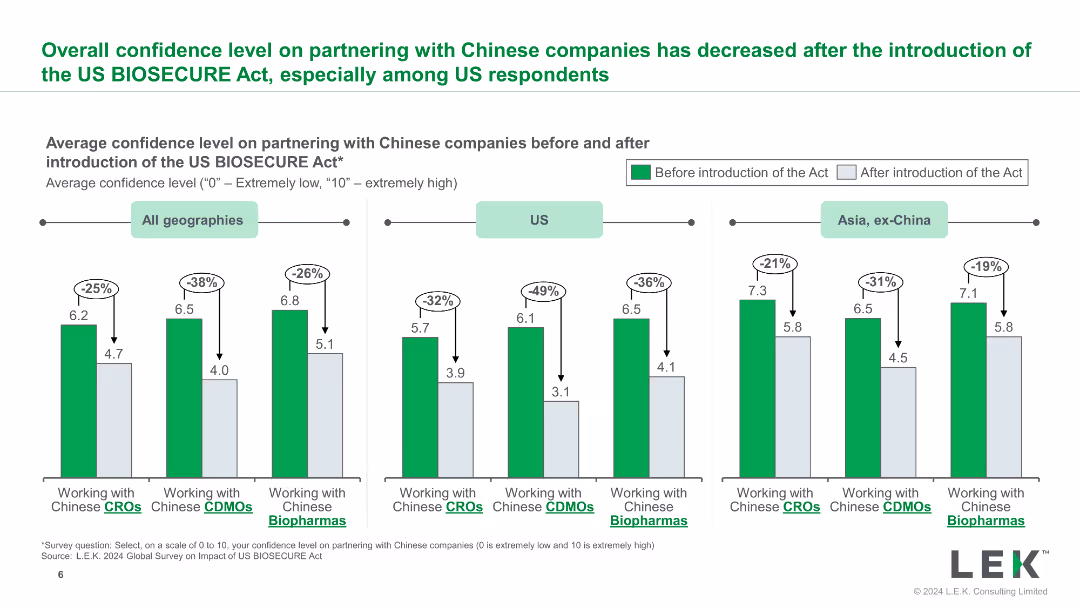
This slide contains a column chart comparing confidence levels in partnering with Chinese companies across different regions before and after the US BioSecure Act. It shows three separate regions with varying confidence levels indicated by green and grey bars.
Risk Assessment and Management
Healthcare & Pharmaceuticals
The slide shows the impact of the US BioSecure Act on the confidence levels of partnering with Chinese companies, with a significant drop observed in the US. This is used to assess changes in partnership dynamics.
BioSecure Act, confidence levels, Chinese companies, partnership, US, impact
false
Risk Assessment and Management
Healthcare & Pharmaceuticals healthcare-and-pharmaceuticals
Multiple Chart
LEK
View slide
The slide includes text boxes outlining key figures and commitments for future dates, and the 'Act4nature International' logo.
Strategic Planning
Environmental Services & Sustainability
Outlines Michelin's environmental performance in 2022 and its commitments for 2030 to reduce the impact of its operations on biodiversity and ecosystems, highlighting progress and future targets.
Biodiversity, Ecosystems, Environmental Impact, Michelin, Commitments, Sustainability, Life Cycle Analysis, Raw Materials, 2030 Targets, Act4nature
false
Strategic Planning
Environmental Services & Sustainability environmental-services-and-sustainability
Table
Morgan Stanley
Previous
Loading...
Hold On!
We are searching in our database
If nothing, comes up, please try different filters!
Column Chart
Heatmap
Chevron
Org Chart
Infographic
Callouts
Timeline
List
Graphic
Picture
Process Flow
Diagram
Paragraph
Map
Table
Framework
Subtitle
Takeaway Box
Icon
Other Chart
Radar Chart
Waterfall Chart
Mekko Chart
Pie Chart
Scatter Plot
Line Chart
Bar chart
Bullet points
Create a FREE account to continue browsing
Receive Instant Access to 1,000+ slides from companies like McKinsey, Google, and Goldman Sachs
First Name
Last Name
Email
Password
I agree to all
Terms & Privacy Policy
Thank you! Your submission has been received!
Oops! Something went wrong while submitting the form.
Have an account?
Sign in
Upgrade to PRO to Save slides
Advanced Search and Filters
Access to 15,000+ slides
Access to Category Pages
Save/Bookmark Slides
PowerPoint Template Library
Pick a Plan
MONTHLY
$12/month
Billed every month, Cancel anytime.
YEARLY
$9/year
Billed $108 annually, Cancel anytime.
Checkout for $12/month
Checkout for $108/yr
Secured by Stripe | AES-256 bit encryption