My Account
My Slides
Search by Category
Templates
View All Templates
Download Template Slides
Leave Feedback
Login
Logout
Get Started
Browse all Slides
Browse all Slides
Create a FREE Account
Instant access to 1,000+ real slides from top companies like McKinsey, BCG, Goldman Sachs, Google and many more!
First Name
Last Name
Email
Password
I agree to all
Terms & Privacy Policy
Thank you! Your submission has been received!
Oops! Something went wrong while submitting the form.
Have an account?
Sign in
Spark Your Next Big Idea with New Presentation Templates
VIEW ALL Templates
Welcome,
Welcome
PRO
Show Featured Only
Checkbox 8
Companies
Mckinsey
Bain
BCG
EY
Deloitte
Accenture
PwC/Strategy&
JP Morgan
Goldman Sachs
Morgan Stanley
Citigroup
Deutsche Bank
Barclays
LEK
KPMG
Kearney
Oliver Wyman
Booz Allen Hamilton
Gartner
IPSOS
Nielsen
Slide type
Text Only
Linear Flow
Vertical Flow
Single Chart
Header Horizontal
Mixed Chart
Header Vertical
Pillar
Multiple Chart
Graphic
Agenda
Title
Table
Framework
Industry
Technology & Software
Artificial Intelligence
Financial Services
Retail & E-commerce
Consumer Goods
Industrial & Manufacturing
Transportation & Logistics
Telecommunications
Real Estate & Construction
Hospitality & Tourism
Professional Services
Education & Training
Media & Entertainment
Agriculture & Food Production
Healthcare & Pharmaceuticals
Environmental Services & Sustainability
Government & Public Sector
Use Case
Mergers and Acquisitions
Performance Metrics and KPIs
Client Case Studies
Competitive Landscape
Corporate Finance and Valuation
Product and Service Analysis
Customer and Market Segmentation
Organizational Structure and Change
Industry Overview
Regulatory and Compliance
Risk Assessment and Management
Investment Analysis
Organizational Structure and Change
Human Resources and Talent Management
Financial Performance
Market Analysis and Trends
Sales and Business Development
Human Resources and Talent Management
Clear all
Thank you! Your submission has been received!
Oops! Something went wrong while submitting the form.
Tag
View slide
Text with bullet points and icons, detailing the impact on consumer goods with a blue and white color scheme.
Technology and Digital Transformation
Consumer Goods
Evaluates the influence of bioengineering on consumer goods industries, with examples of new technologies.
Bioengineering, Consumer Goods, Market Impact, Technologies
false
Technology and Digital Transformation
Consumer Goods consumer-goods
Header Horizontal
McKinsey
View slide
Four quadrants with icons and text descriptions, dark blue background with light blue details.
Technology and Digital Transformation
Healthcare & Pharmaceuticals
Explains bioengineering trends and their implications in healthcare and technology sectors.
Bioengineering, Healthcare, Technology, Education, Trends
false
Technology and Digital Transformation
Healthcare & Pharmaceuticals healthcare-and-pharmaceuticals
Pillar
McKinsey
View slide
A descriptive list with icons. Blue and white color scheme, with a clear layout.
Technology and Digital Transformation
Healthcare & Pharmaceuticals
Discusses the influence of bioengineering across different industries.
Bioengineering, Industry Influence, Comparative Analysis
false
Technology and Digital Transformation
Healthcare & Pharmaceuticals healthcare-and-pharmaceuticals
Header Vertical
McKinsey
View slide
List format with icons, descriptive text, and benefits. Blue and white color scheme.
Product and Service Analysis
Healthcare & Pharmaceuticals
Details recent technological advances in bioengineering and their practical applications.
Bioengineering, Technology, Advancements, Healthcare
false
Product and Service Analysis
Healthcare & Pharmaceuticals healthcare-and-pharmaceuticals
Header Vertical
McKinsey
View slide
Three-column layout with icons representing energy sources and trading. Includes a line graph showing power supply and demand, and a Bitcoin price trend.
Technology and Digital Transformation
Technology & Software
Discusses the role of Bitcoin mining in energy management, acting as a balancing economic battery by leveraging excess energy.
Bitcoin, Blockchain, Energy, Trading, Economic
false
Technology and Digital Transformation
Technology & Software technology-and-software
Mixed Chart
McKinsey
View slide
Detailed presentation with column charts showing Bitcoin metrics over years, including price projections and mining outputs.
Technology and Digital Transformation
Financial Services
Analyzes the future economic impact of Bitcoin mining, illustrating projected growth in value and reduction in new coins mined.
Bitcoin, Mining, Growth, Projection, Economy
false
Technology and Digital Transformation
Financial Services financial-services
Multiple Chart
McKinsey
View slide
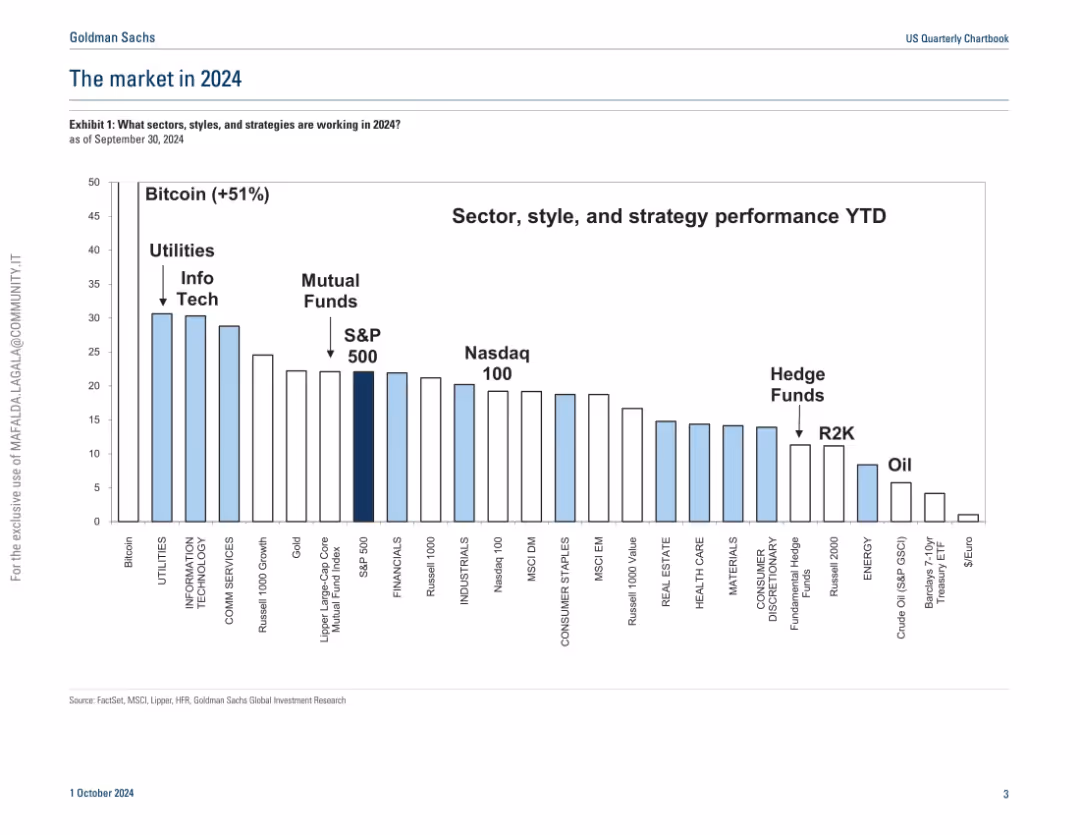
Vertical bar chart in light blue and white; ranks asset classes and strategies by performance year-to-date.
Market Analysis and Trends
Financial Services
A comparative bar chart ranks the YTD performance of various asset classes and investment strategies. Bitcoin leads with +51%, followed by utilities and tech sectors. The S&P 500 and mutual funds fall in the middle, with oil and treasury ETFs underperforming. The chart helps contextualize market winners and laggards.
Bitcoin, YTD performance, utilities, tech, S&P 500, mutual funds, Nasdaq, R2K
false
Market Analysis and Trends
Financial Services financial-services
Single Chart
Goldman Sachs
View slide
The slide displays column charts showing the gender distribution of Black employees across various professional levels within the venture capital industry. Textual notes on survey data are also provided.
Human Resources and Talent Management
Professional Services
This slide examines the gender distribution of Black employees within the venture capital industry, comparing data from 2018, 2020, and 2022, and highlighting trends and disparities.
Black employees, Gender distribution, Diversity, VC industry, Professional levels
false
Human Resources and Talent Management
Professional Services professional-services
Multiple Chart
Deloitte
View slide
Three-part text layout detailing blockchain applications in payments, loyalty rewards, and Metaverse engagement.
Technology and Digital Transformation
Technology & Software
Explores blockchain's role in transforming consumer engagement through payment solutions, rewards, and virtual experiences.
Blockchain, Consumer, Metaverse, Payments, Rewards
false
Technology and Digital Transformation
Technology & Software technology-and-software
Pillar
McKinsey
View slide
Four sections each with an icon and text: Native tokens, Value transfer, Transaction fees, Token allocation. Icons represent crypto tokens, Bitcoin, coins, magnifier.
Industry Overview
Financial Services
Explains different aspects of digital assets on a blockchain, like native tokens, value transfer, transaction fees, and token allocation. Used in discussions on blockchain technology basics.
Blockchain, Crypto, Tokens, Bitcoin, Transaction, Fees, Allocation, Digital Assets
false
Industry Overview
Financial Services financial-services
Pillar
McKinsey
View slide
Gartner Hype Cycle diagram for blockchain applications in 2021, showing different stages from innovation trigger to plateau of productivity.
Technology and Digital Transformation
Technology & Software
This slide presents the Gartner Hype Cycle for blockchain applications, illustrating the different stages of technology maturity. It predicts that blockchain will significantly decentralize markets and make trade more efficient, highlighting the expected timeline for various blockchain applications to reach mainstream adoption.
Blockchain, Hype Cycle, Decentralization
false
Technology and Digital Transformation
Technology & Software technology-and-software
Mixed Chart
Roland Berger
View slide
Pie chart showing the share of blockchain startups by country and a column chart projecting blockchain business value for different use cases from 2021 to 2030.
Technology and Digital Transformation
Technology & Software
The slide highlights the diverse applications of blockchain technology beyond cryptocurrencies, showcasing its use in various sectors. It includes data on the distribution of blockchain startups globally and projects the significant increase in business value derived from blockchain by 2030.
Blockchain, Startups, Business Value, Use Cases
false
Technology and Digital Transformation
Technology & Software technology-and-software
Multiple Chart
Roland Berger
View slide
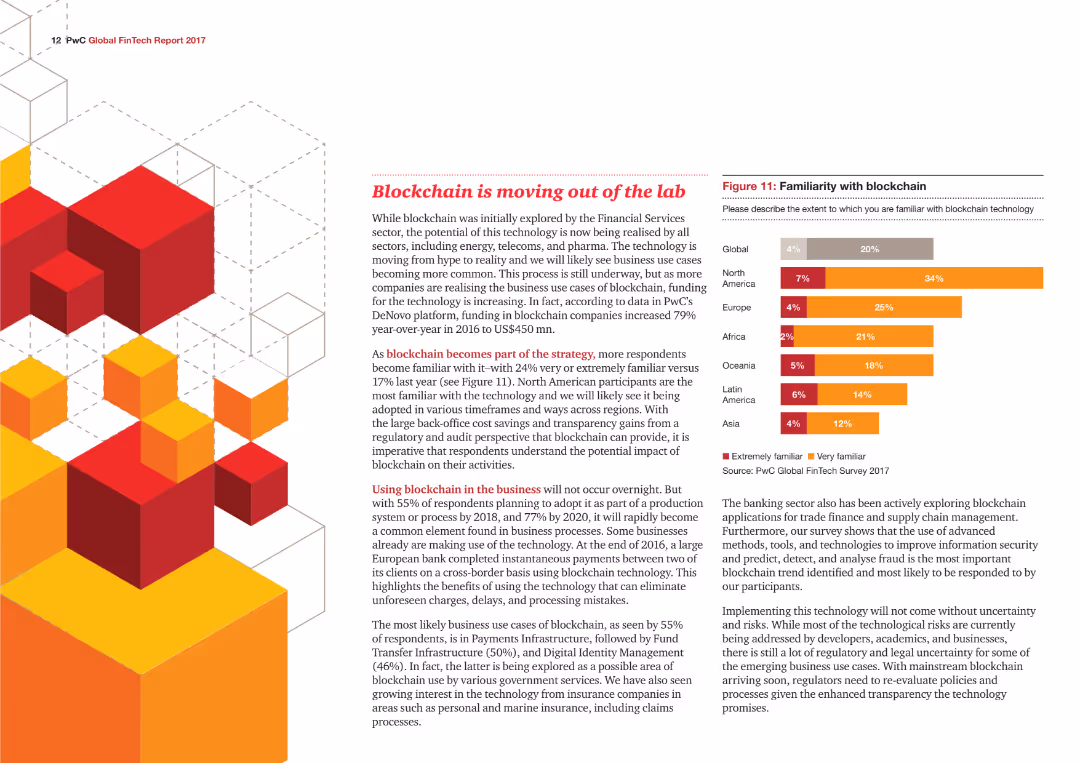
The slide contains a column chart depicting familiarity with blockchain technology across different regions, accompanied by detailed text about blockchain trends and business impact.
Technology and Digital Transformation
Financial Services
The slide discusses the increasing adoption and potential of blockchain technology in various sectors, highlighting regional familiarity and business use cases.
Blockchain, Technology, Adoption, Business, Regions
false
Technology and Digital Transformation
Financial Services financial-services
Mixed Chart
PwC/Strategy&
View slide
A column chart showing VC investments in blockchain over the years, with a focus panel on significant financial entities and their investment details.
Investment Analysis
Financial Services
Analyzes trends in venture capital investments in blockchain technology, highlighting major players and financial commitments over time. Useful for investment analysis and discussions on market trends.
Blockchain, Venture Capital, Investments, Trends, Financial Infrastructure, Entities
false
Investment Analysis
Financial Services financial-services
Multiple Chart
McKinsey
View slide
Features a text block on the left and a horizontal bar chart on the right comparing the deployment of blockchain in advertising strategies between those prioritizing regulatory environments and others.
Regulatory and Compliance
Financial Services
The slide discusses the adoption of blockchain technology in advertising to address regulatory environments, with a horizontal bar chart illustrating the difference in deployment rates between companies prioritizing regulation and others.
Blockchain, advertising, regulatory, deployment, comparison
false
Regulatory and Compliance
Financial Services financial-services
Mixed Chart
Deloitte
View slide
The slide contrasts centrally controlled marketplaces with public blockchains using two side-by-side diagrams. The left diagram shows a centralized model, while the right illustrates a decentralized blockchain model. Text explanations are included.
Market Analysis and Trends
Financial Services
This slide compares centralized digital marketplaces with decentralized public blockchains, highlighting the advantages of transparency and fairness in blockchain-based systems over traditional centralized intermediaries.
Blockchain, centralization, decentralization, transparency, fairness
false
Market Analysis and Trends
Financial Services financial-services
Header Horizontal
EY
View slide
The slide compares the economic effects of traditional market dominance with zero marginal cost and open access through blockchains. Diagrams and text highlight how blockchains enable real competition versus market dominance.
Technology and Digital Transformation
Technology & Software
This slide discusses how blockchains can transform the global competitive landscape by reducing marginal costs, fostering network effects, and enabling open access, contrasting it with traditional vendor lock-in and market dominance scenarios.
Blockchain, economy, competition, market dominance, open access
false
Technology and Digital Transformation
Technology & Software technology-and-software
Mixed Chart
EY
View slide
Three segmented boxes describing different blockchain ecosystems: DCEP RMB payment system, private domestic blockchains, and global trade connectivity. Each segment includes key players and functionalities.
Technology and Digital Transformation
Technology & Software
Outlines three major blockchain ecosystems in China: DCEP payment system for digital transactions, private domestic blockchains for B2B transactions, and global trade connectivity.
Blockchain, ecosystems, China, DCEP, RMB payment system, private blockchains, global trade, connectivity, B2B transactions, digital payments
false
Technology and Digital Transformation
Technology & Software technology-and-software
Table
EY
View slide
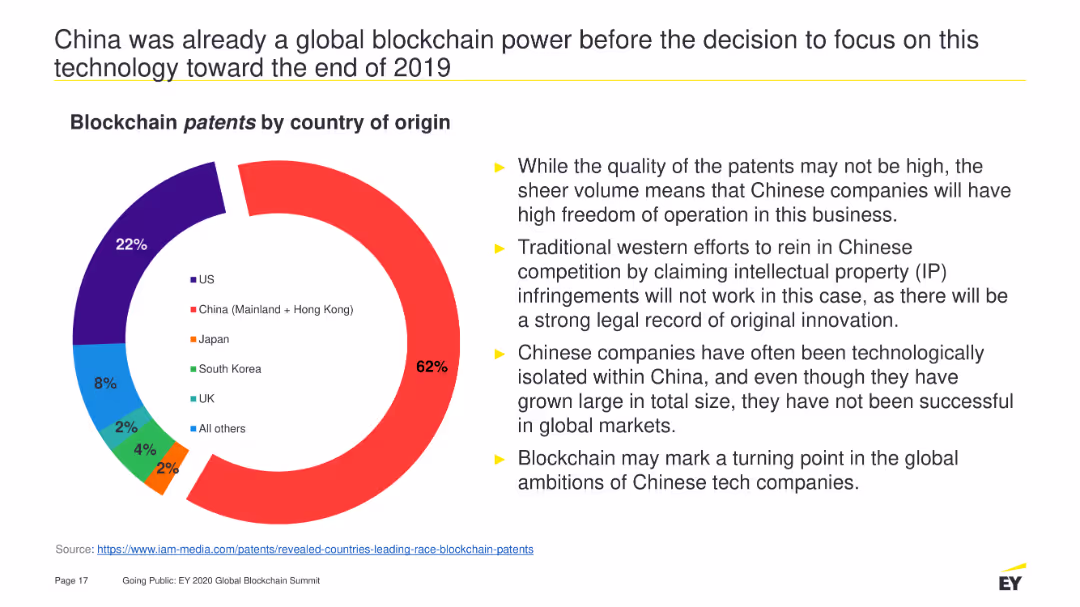
A pie chart depicting the distribution of blockchain patents by country of origin. It is visually dominated by China's portion (62%), followed by the US (22%), Japan (8%), and other countries with smaller percentages. The slide also contains bullet points summarizing the implications.
Market Analysis and Trends
Technology & Software
Highlights China's dominance in blockchain patents, explaining the high volume of patents and their potential impact on global market dynamics and competition strategies.
Blockchain, patents, China, technology, global market, intellectual property, innovation, competition, freedom of operation
false
Market Analysis and Trends
Technology & Software technology-and-software
Mixed Chart
EY
View slide
The slide features a central diagram depicting the roles of buyers and sellers in network procurement, connected through blockchain smart contracts. Various roles such as network leaders, owned subsidiaries, and authorized buyers/sellers are highlighted.
Technology and Digital Transformation
Technology & Software
The slide explains the complex roles within buyer and seller networks in network procurement, emphasizing how smart contracts enforce discounts and track volume. It highlights the importance of blockchain in managing these interactions efficiently.
Blockchain, smart contracts, procurement, network roles, digital transformation
false
Technology and Digital Transformation
Technology & Software technology-and-software
Diagram
EY
View slide
The slide has a column chart and text. The chart depicts familiarity with blockchain technology among respondents.
Technology and Digital Transformation
Financial Services
The slide explores blockchain technology, its potential impact, and the level of familiarity among industry participants.
Blockchain, technology, trends, familiarity, financial services
false
Technology and Digital Transformation
Financial Services financial-services
Mixed Chart
PwC/Strategy&
View slide
Text-heavy slide focusing on the 'Blue World' scenario, accompanied by a large circular graphic to the right showing percentages from a survey.
Risk Assessment and Management
Professional Services
Describes the competitive and performance-driven nature of 'The Blue World' work environment, including challenges and attractions. Geared towards risk assessment and management in corporate settings.
Blue World, competition, capitalism, rewards, performance, data-driven, business security, job security, technology
false
Risk Assessment and Management
Professional Services professional-services
Mixed Chart
PwC/Strategy&
View slide
Two charts: one shows the Bank of England policy rate expectations with a recession marker, and the other shows UK credit conditions with lending standards tightening for corporates and households.
Regulatory and Compliance
Financial Services
This slide details the policy rate expectations of the Bank of England and the credit conditions in the UK. It highlights the tightening of lending standards and market expectations. Used for policy analysis and economic forecasting.
BoE, policy rate, credit, lending, recession
false
Regulatory and Compliance
Financial Services financial-services
Multiple Chart
JP Morgan
View slide
Similar layout to slide 9345, with a table showing board risk priorities from 2013 to 2022 and a bar chart of top board risk priorities for the next 12 months.
Risk Assessment and Management
Financial Services
The slide highlights the alignment and divergence between CROs and board members on risk priorities, with a focus on credit and geopolitical risks.
Board Risk, Priorities, Credit Risk, Geopolitical Risk, Analysis
false
Risk Assessment and Management
Financial Services financial-services
Mixed Chart
EY
View slide
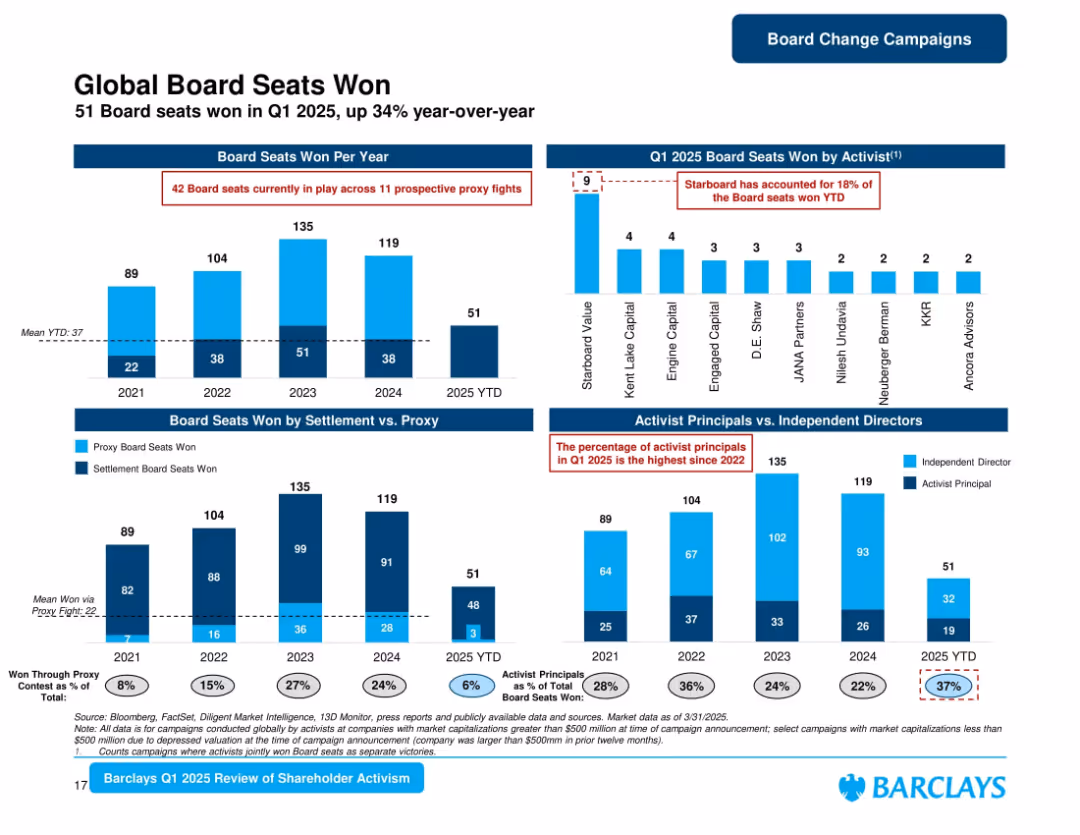
Bar charts split into annual and YTD views, proxy vs. settlement wins, and principal types. Logos and stats for top activists.
Organizational Structure and Change
Financial Services
Analyzes board seats won through shareholder activism, with a 34% increase in 2025 YTD. Starboard Value leads YTD wins. Includes detailed breakdowns of seats by win method and activist type (principal vs. independent director).
Board Seats, Proxy, Activists, Shareholder, Settlements, YTD, 2025, Governance
false
Organizational Structure and Change
Financial Services financial-services
Multiple Chart
Barclays
View slide
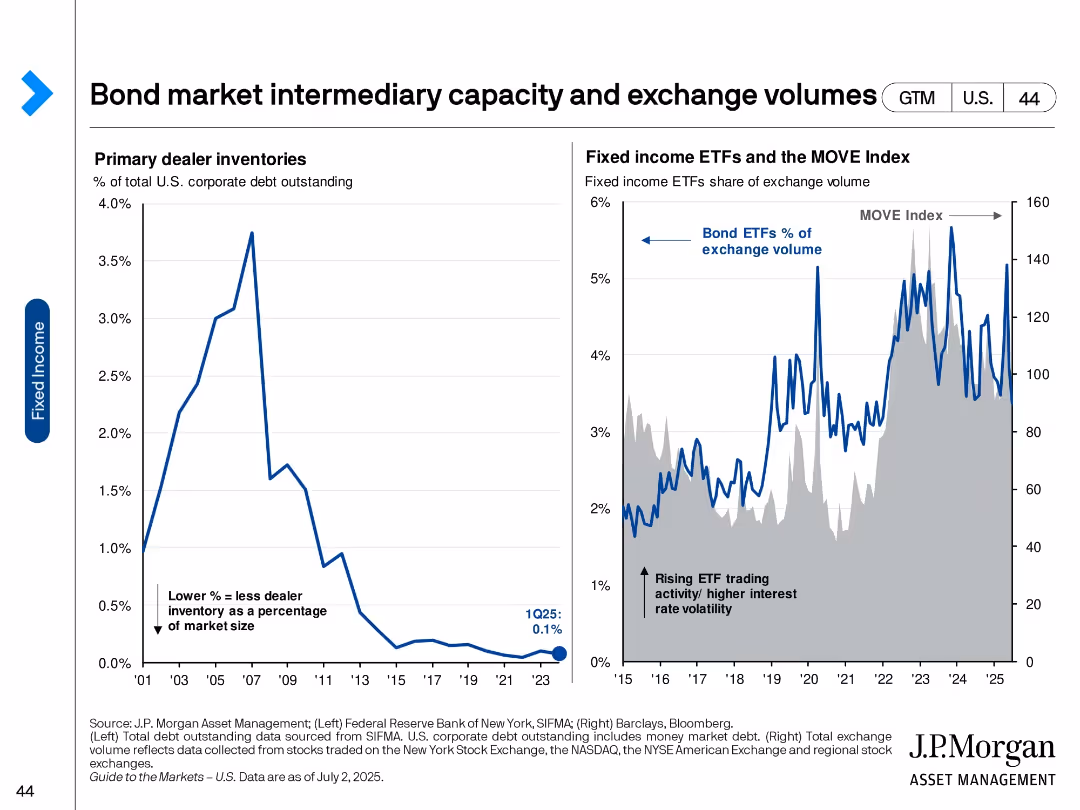
Two-panel slide with line charts on dealer inventories and bond ETF trading volume.
Market Analysis and Trends
Financial Services
Examines the decline in primary dealer bond inventories and the rise of ETF trading in fixed income markets. Suggests a shift in market structure and increased volatility as ETFs become more prominent trading vehicles.
Bond ETFs, market liquidity, dealer inventory, trading volume, volatility, MOVE index, fixed income, market structure
false
Market Analysis and Trends
Financial Services financial-services
Multiple Chart
JP Morgan
View slide
Graph comparing global equities and U.S. Treasury returns with annotations on U.S. recessions. Dense with financial data and historical trends.
Investment Analysis
Financial Services
Analyzes historical trends in U.S. government bond yields and their implications for future financial recoveries, addressing investment risks and opportunities.
Bond Yields, Financial Recovery, Investment Risks, US Treasury, Market Trends, Return Correlation
false
Investment Analysis
Financial Services financial-services
Single Chart
Citigroup
View slide
Two column charts comparing 10-year bond yields of developed and emerging markets.
Financial Performance
Financial Services
This slide presents a comparison of sovereign bond yields across developed and emerging markets, showing recent and year-ago yields for context.
Bond Yields, Sovereign Bonds, Developed Markets, Emerging Markets, Financial Performance
false
Financial Performance
Financial Services financial-services
Multiple Chart
Morgan Stanley
View slide
A table with yields, returns, maturities, and correlations of various bond types, alongside a bar chart of return impact from interest rate changes.
Financial Performance
Financial Services
Evaluates the performance of different bonds and potential returns under changing interest rate scenarios.
Bond returns, yields, performance, interest rates, U.S. Treasuries, correlation, impact, analysis, strong
false
Financial Performance
Financial Services financial-services
Mixed Chart
JP Morgan
View slide
Bar chart showing recent average Z-spread and change relative to average for various sectors with commentary on the right.
Risk Assessment and Management
Financial Services
Highlights the perceived credit risk in the financial, real estate, and energy sectors due to recent US bank failures.
Bond spreads, financial sectors, risk, credit, US
false
Risk Assessment and Management
Financial Services financial-services
Mixed Chart
Accenture
Previous
Loading...
Hold On!
We are searching in our database
If nothing, comes up, please try different filters!
Column Chart
Heatmap
Chevron
Org Chart
Infographic
Callouts
Timeline
List
Graphic
Picture
Process Flow
Diagram
Paragraph
Map
Table
Framework
Subtitle
Takeaway Box
Icon
Other Chart
Radar Chart
Waterfall Chart
Mekko Chart
Pie Chart
Scatter Plot
Line Chart
Bar chart
Bullet points
Create a FREE account to continue browsing
Receive Instant Access to 1,000+ slides from companies like McKinsey, Google, and Goldman Sachs
First Name
Last Name
Email
Password
I agree to all
Terms & Privacy Policy
Thank you! Your submission has been received!
Oops! Something went wrong while submitting the form.
Have an account?
Sign in
Upgrade to PRO to Save slides
Advanced Search and Filters
Access to 15,000+ slides
Access to Category Pages
Save/Bookmark Slides
PowerPoint Template Library
Pick a Plan
MONTHLY
$12/month
Billed every month, Cancel anytime.
YEARLY
$9/year
Billed $108 annually, Cancel anytime.
Checkout for $12/month
Checkout for $108/yr
Secured by Stripe | AES-256 bit encryption