My Account
My Slides
Search by Category
Templates
View All Templates
Download Template Slides
Leave Feedback
Login
Logout
Get Started
Browse all Slides
Browse all Slides
Create a FREE Account
Instant access to 1,000+ real slides from top companies like McKinsey, BCG, Goldman Sachs, Google and many more!
First Name
Last Name
Email
Password
I agree to all
Terms & Privacy Policy
Thank you! Your submission has been received!
Oops! Something went wrong while submitting the form.
Have an account?
Sign in
Spark Your Next Big Idea with New Presentation Templates
VIEW ALL Templates
Welcome,
Welcome
PRO
Show Featured Only
Checkbox 8
Companies
Mckinsey
Bain
BCG
EY
Deloitte
Accenture
PwC/Strategy&
JP Morgan
Goldman Sachs
Morgan Stanley
Citigroup
Deutsche Bank
Barclays
LEK
KPMG
Kearney
Oliver Wyman
Booz Allen Hamilton
Gartner
IPSOS
Nielsen
Slide type
Text Only
Linear Flow
Vertical Flow
Single Chart
Header Horizontal
Mixed Chart
Header Vertical
Pillar
Multiple Chart
Graphic
Agenda
Title
Table
Framework
Industry
Technology & Software
Artificial Intelligence
Financial Services
Retail & E-commerce
Consumer Goods
Industrial & Manufacturing
Transportation & Logistics
Telecommunications
Real Estate & Construction
Hospitality & Tourism
Professional Services
Education & Training
Media & Entertainment
Agriculture & Food Production
Healthcare & Pharmaceuticals
Environmental Services & Sustainability
Government & Public Sector
Use Case
Mergers and Acquisitions
Performance Metrics and KPIs
Client Case Studies
Competitive Landscape
Corporate Finance and Valuation
Product and Service Analysis
Customer and Market Segmentation
Organizational Structure and Change
Industry Overview
Regulatory and Compliance
Risk Assessment and Management
Investment Analysis
Organizational Structure and Change
Human Resources and Talent Management
Financial Performance
Market Analysis and Trends
Sales and Business Development
Human Resources and Talent Management
Clear all
Thank you! Your submission has been received!
Oops! Something went wrong while submitting the form.
Tag
View slide
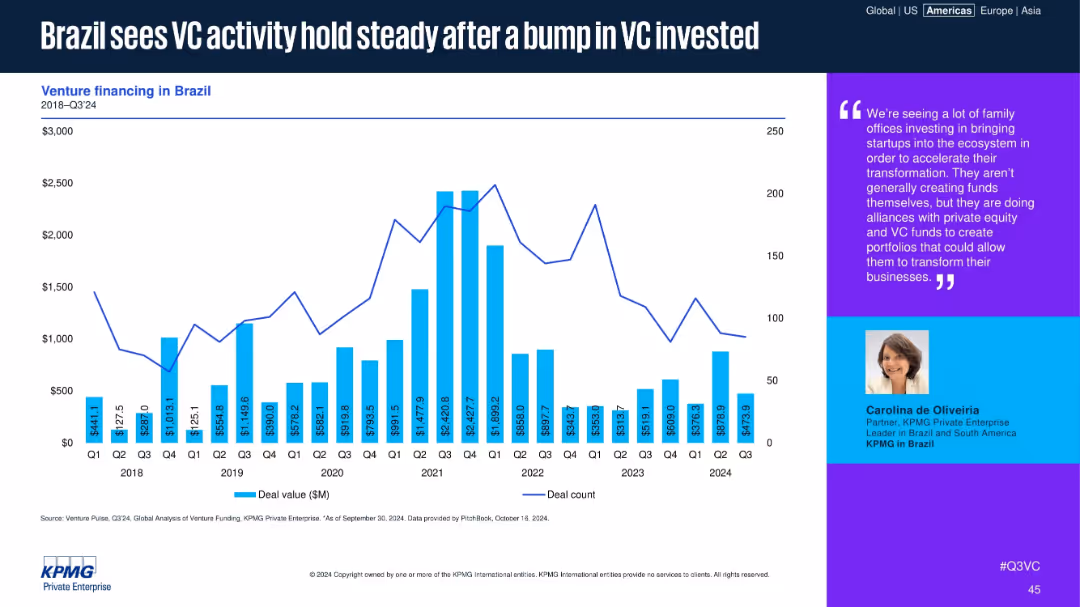
Bar and line chart for Brazil’s VC deal values and counts, with commentary from a regional KPMG partner.
Market Analysis and Trends
Financial Services
Brazil’s VC market has stabilized after a notable funding increase in 2021. While deal counts have dipped, moderate funding levels continue. Commentary highlights family office involvement and alliances with VC and PE funds to support digital transformation.
Brazil, VC activity, LATAM, family offices, KPMG, digital transformation, deal count, venture funding, steady
false
Market Analysis and Trends
Financial Services financial-services
Mixed Chart
KPMG
View slide
Slide features a bar chart displaying VC as a percentage of GDP and total VC amount in USD for Brazil, USA, Israel, China
Market Analysis and Trends
Financial Services
Compares venture capital investment as a percentage of GDP and in absolute terms across four countries, highlighting Brazil's position relative to more developed economies
Brazil, VC, GDP, investment, comparison
false
Market Analysis and Trends
Financial Services financial-services
Single Chart
McKinsey
View slide
This slide has four main charts: a line chart showing consumer and industrial confidence, a bar chart for credit growth by corporates and households, and a line chart depicting the unemployment rate.
Market Analysis and Trends
Financial Services
The slide analyzes Brazil's consumer and business dynamics, focusing on confidence levels, credit growth, and unemployment trends.
Brazil, consumer dynamics, business confidence, credit growth, unemployment
false
Market Analysis and Trends
Financial Services financial-services
Multiple Chart
JP Morgan
View slide
Features column charts showing the growth of the credit market in Brazil and a breakdown of transaction channels over several years.
Market Analysis and Trends
Financial Services
Analyzes the growth of Brazil's credit market post-pandemic, focusing on the increase in digital payments and credit distribution across different channels.
Brazil, credit market, digital payments, market growth, financial analysis
false
Market Analysis and Trends
Financial Services financial-services
Multiple Chart
Barclays
View slide
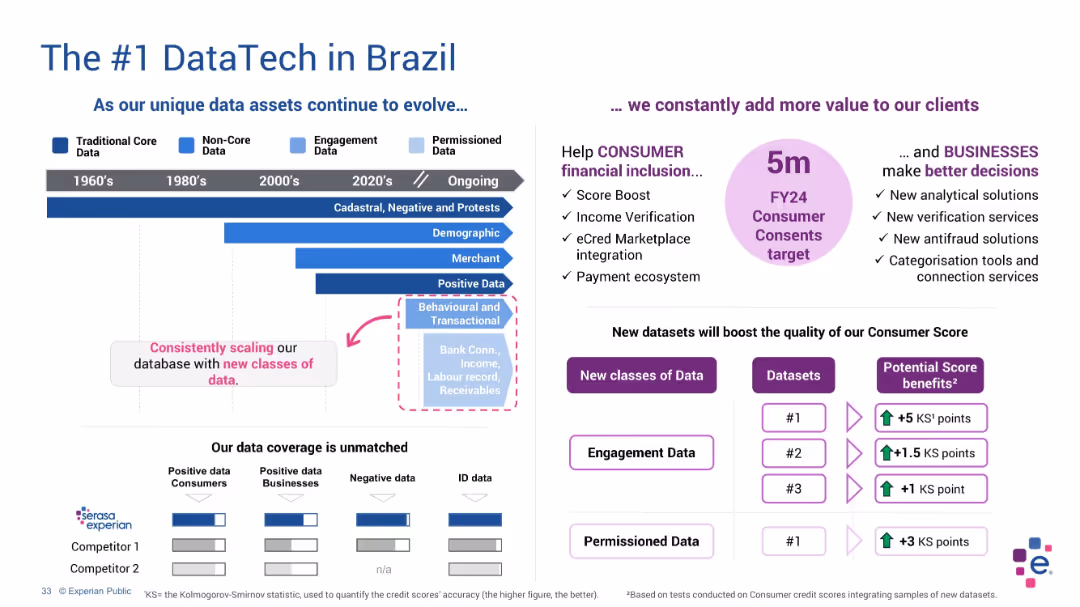
Horizontal timeline with evolving data types on the left, text highlights and comparison chart on right
Product and Service Analysis
Technology & Software
This slide emphasizes Experian’s evolution in Brazil from core to permissioned data. It details ongoing expansion in data classes and use cases such as fraud detection and credit scoring, with a comparison of competitors’ data capabilities.
Brazil, data evolution, Experian, ID data, permissioned data, analytics
false
Product and Service Analysis
Technology & Software technology-and-software
Mixed Chart
Barclays
View slide
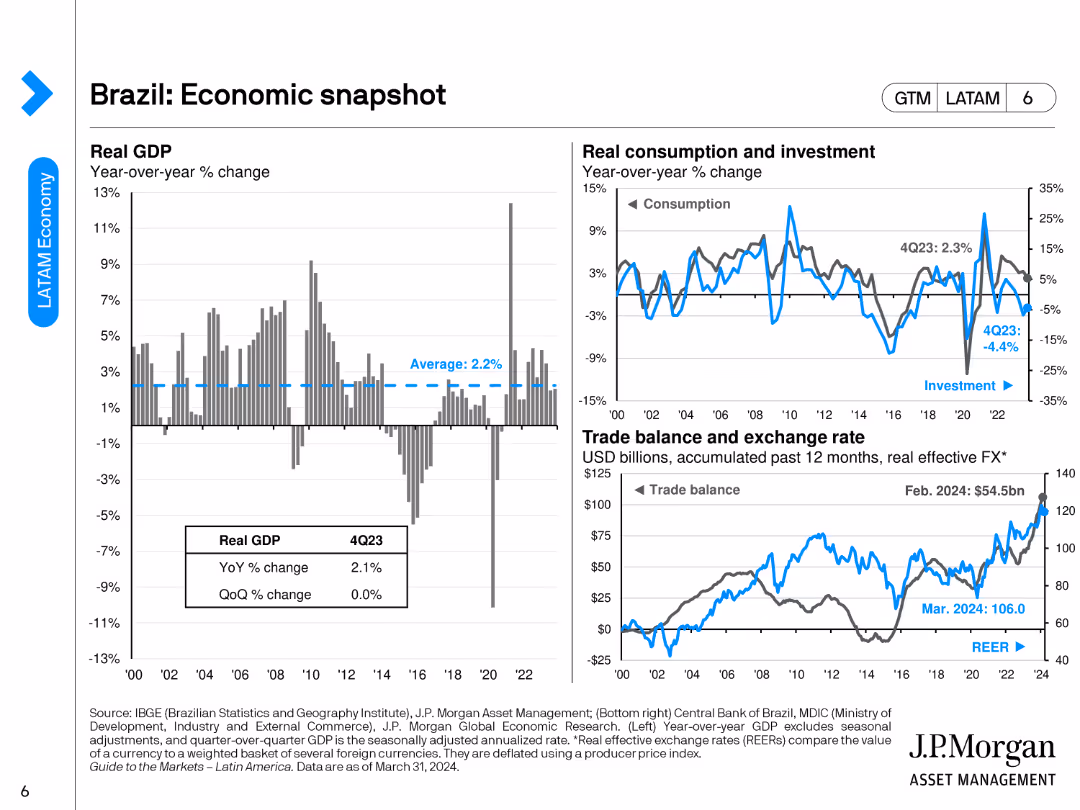
The slide includes three main charts: a bar chart for real GDP year-over-year change, a line chart for consumption and investment, and a combined line/bar chart for trade balance and exchange rate.
Market Analysis and Trends
Financial Services
The slide provides an economic overview of Brazil, detailing GDP changes, consumption, investment trends, and trade balance with exchange rate metrics.
Brazil, economic snapshot, GDP, trade balance, investment
false
Market Analysis and Trends
Financial Services financial-services
Multiple Chart
JP Morgan
View slide
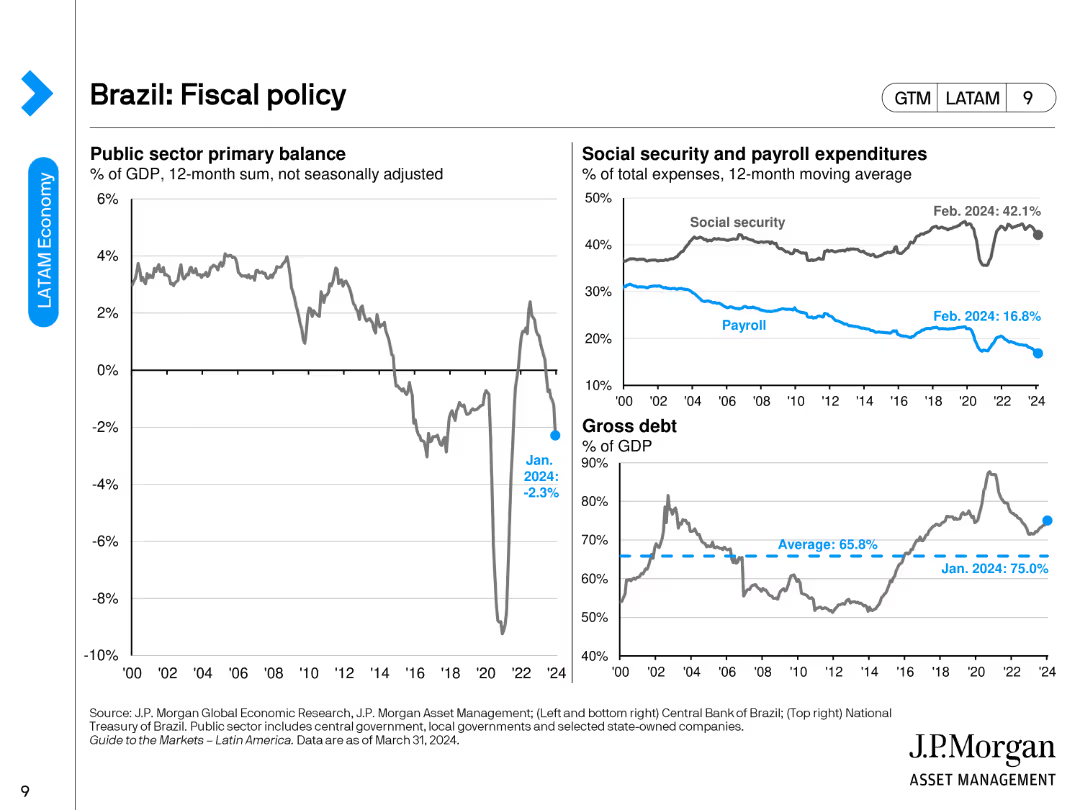
The slide features a line chart showing the public sector primary balance, a combined line/bar chart for social security and payroll expenditures, and a line chart depicting gross debt as a percentage of GDP.
Regulatory and Compliance
Financial Services
The slide presents Brazil's fiscal policy overview, including public sector balance, social security, payroll expenditures, and gross debt metrics.
Brazil, fiscal policy, public sector balance, social security, gross debt
false
Regulatory and Compliance
Financial Services financial-services
Multiple Chart
JP Morgan
View slide
The slide contains two line graphs. The left graph plots the Consumer Price Index (CPI) and exchange rate (BRL per USD) over time, marked from 2007 to 2023 with a % change y-o-y. The right graph shows the Bovespa index over the same timespan, indexed to January 2007 = 100. The graphs are color-coded, with annotations and a title at the top.
Market Analysis and Trends
Financial Services
This slide presents economic data for Brazil, comparing inflation and exchange rates with stock market performance. The juxtaposition of CPI and exchange rate trends alongside the Bovespa index indicates a nuanced narrative of economic conditions, suggesting for detailed market analysis.
Brazil, inflation, exchange rate, Bovespa index, economic analysis, CPI, market performance, trend, financial chart, currency valuation
false
Market Analysis and Trends
Financial Services financial-services
Multiple Chart
McKinsey
View slide
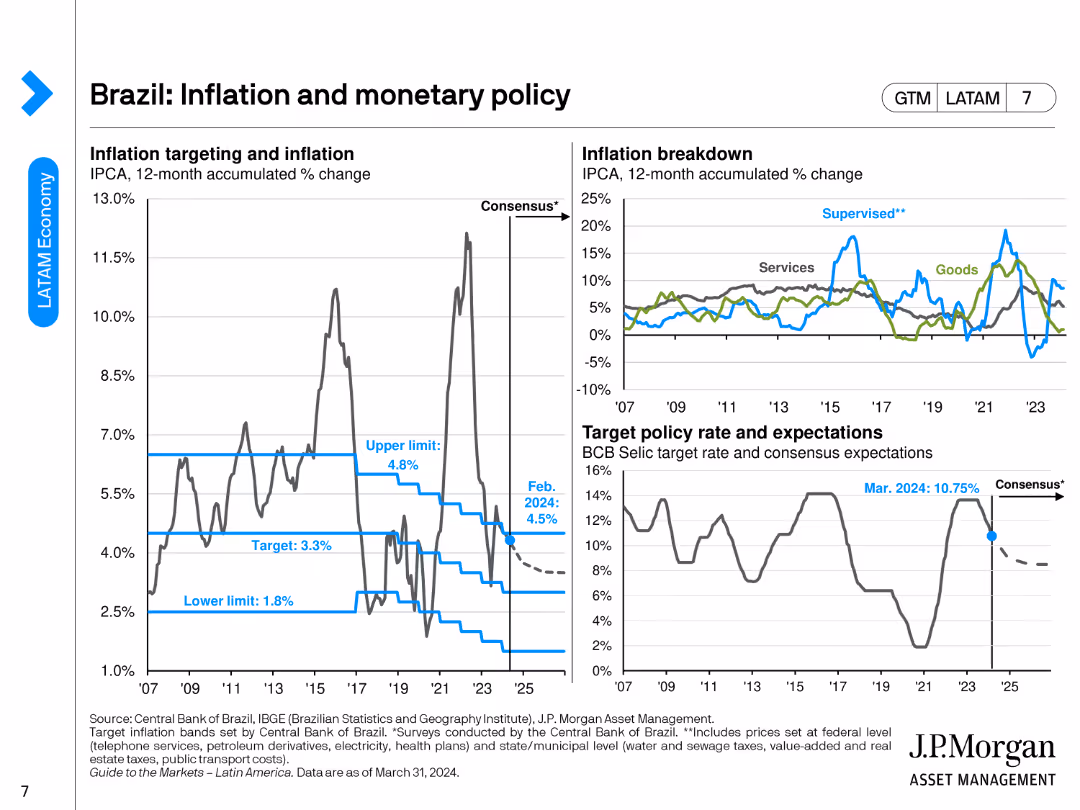
The slide features a line chart for inflation targeting and accumulated change, another line chart breaking down inflation into goods and services, and a line chart showing target policy rate and expectations.
Market Analysis and Trends
Financial Services
The slide discusses Brazil's inflation trends, monetary policy targets, and the breakdown of inflation between goods and services.
Brazil, inflation, monetary policy, target rate, economic trends
false
Market Analysis and Trends
Financial Services financial-services
Multiple Chart
JP Morgan
View slide
Features a world map and portrait of a woman, highlighting Brazil's role as a continental hub attracting global tech companies
Market Analysis and Trends
Technology & Software
Focuses on Brazil's emerging status as a tech hub, mapping major global tech players and their activities within the region
Brazil, tech hub, global, market, innovation
false
Market Analysis and Trends
Technology & Software technology-and-software
Graphic
McKinsey
View slide
Depicts a map with numerical data highlighting the number of unicorns in Brazil compared to other countries
Market Analysis and Trends
Technology & Software
Compares Brazil's capacity to foster high-value startups (unicorns) with other leading countries, emphasizing its growing influence in the global market
Brazil, unicorns, global, comparison, startups
false
Market Analysis and Trends
Technology & Software technology-and-software
Mixed Chart
McKinsey
View slide
This slide features a singular blue line chart tracking the price of Brent crude oil from 2016 to 2023. The layout is clean, with distinct markers for each quarter, and the title prominently displayed at the top.
Market Analysis and Trends
Energy & Utilities
Analyzing the price fluctuations of Brent crude oil, this slide shows a line chart that tracks quarterly data over several years. It can be used to understand trends in the energy sector, make financial predictions, or develop strategies for purchasing and futures contracts in industries like transportation and manufacturing.
Brent crude, oil price, trend analysis, line chart
false
Market Analysis and Trends
Energy & Utilities energy-and-utilities
Single Chart
Morgan Stanley
View slide
This slide features a line chart showing the historical Brent prices and future estimates with a sunset backdrop of oil tankers at sea. The visual complexity is moderate, with clear graph lines and color contrasts for readability.
Market Analysis and Trends
Energy & Utilities
The slide discusses the short-term increase in Brent futures due to COVID-19 vaccination programs and OPEC+ actions. It highlights the ongoing scrutiny on vaccine distribution, mobility patterns, and OPEC+ actions affecting oil demand.
Brent futures, OPEC+, COVID-19, oil demand, vaccine
false
Market Analysis and Trends
Energy & Utilities energy-and-utilities
Mixed Chart
EY
View slide
The slide includes a line chart showing Brent futures prices from December 2019 to December 2024. It uses yellow lines for historical and future projections, with a background image of an oil rig. Text explains the trends and implications.
Market Analysis and Trends
Energy & Utilities
The slide projects Brent crude oil prices based on global vaccination programs, mobility, and OPEC+ supply discipline. It discusses factors like COVID-19 variants and decarbonization affecting medium- to long-term oil demand and pricing.
Brent futures, oil prices, OPEC+, COVID-19, decarbonization
false
Market Analysis and Trends
Energy & Utilities energy-and-utilities
Mixed Chart
EY
View slide
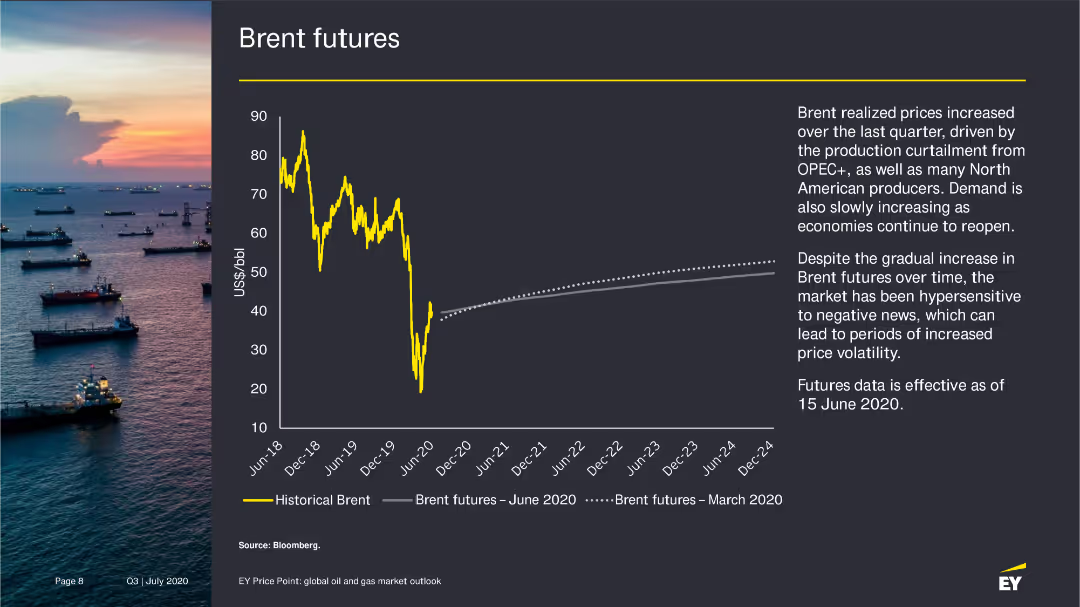
The slide presents a line chart showing historical Brent prices and Brent futures as of June 2020, with an accompanying narrative on the factors influencing these trends.
Market Analysis and Trends
Energy & Utilities
Analyzes the increase in Brent futures prices due to production cuts and rising demand, with projections for future price trends.
Brent futures, oil prices, market trends, 2020
false
Market Analysis and Trends
Energy & Utilities energy-and-utilities
Mixed Chart
EY
View slide
The slide uses two side-by-side graphs: one for Brent price forecasts and the other for WTI. Each graph compares bank/broker and consultant price estimates, using different shades of yellow for distinction. Text details the forecast ranges.
Market Analysis and Trends
Energy & Utilities
This slide provides forecasts for Brent and WTI oil prices, comparing the estimates of banks, brokers, and consultants. It discusses the factors influencing these estimates and the projected average prices for 2026.
Brent, WTI, oil price forecasts, bank/broker, consultants
false
Market Analysis and Trends
Energy & Utilities energy-and-utilities
Multiple Chart
EY
View slide
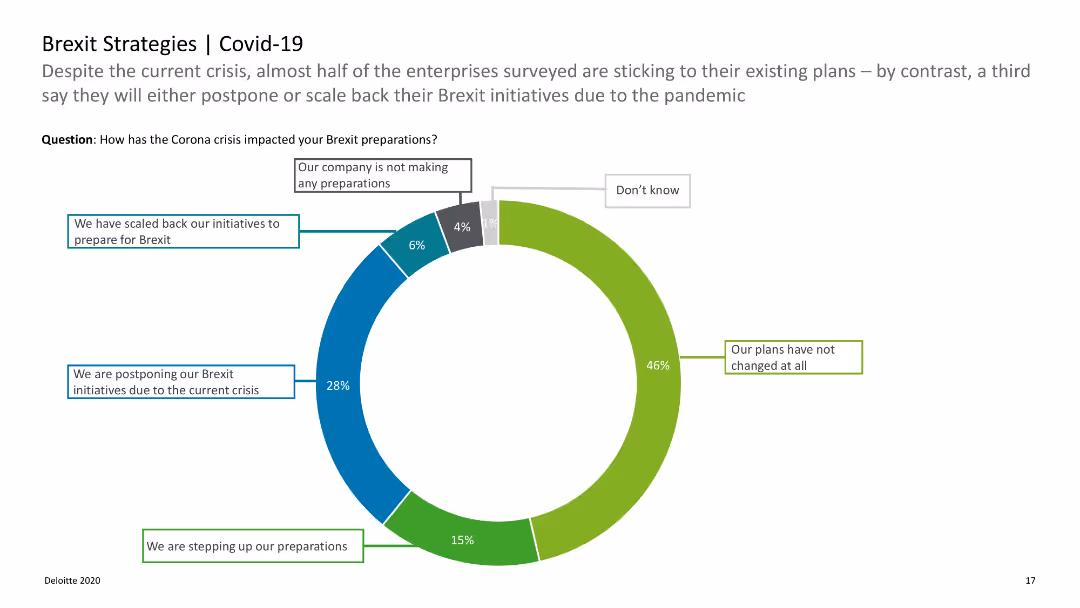
The slide shows a donut chart illustrating the impact of COVID-19 on Brexit preparations with labeled segments.
Strategic Planning
Professional Services
Explores how the COVID-19 crisis has influenced companies' Brexit strategies, including scaling back or postponing initiatives.
Brexit, COVID-19, strategies, impact, preparations
false
Strategic Planning
Professional Services professional-services
Single Chart
Deloitte
View slide
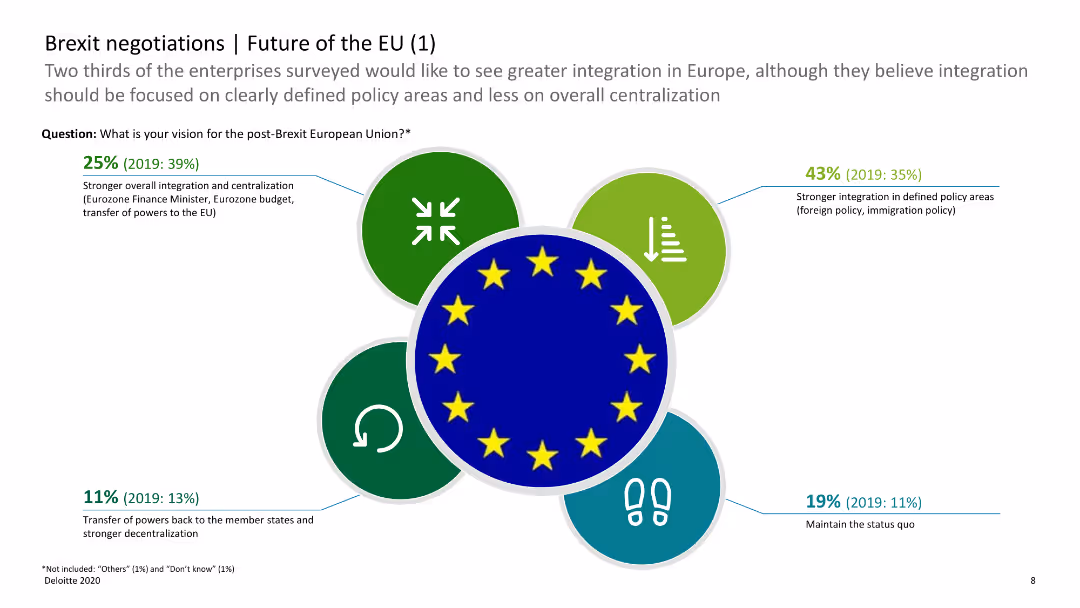
The slide has icons and horizontal bar charts showing opinions on the future of the EU post-Brexit, with categories such as integration and decentralization.
Regulatory and Compliance
Government & Public Sector
This slide shows survey results on the future of the EU, indicating preferences for integration versus decentralization post-Brexit. It helps understand future EU policy directions.
Brexit, EU future, integration, decentralization, survey
false
Regulatory and Compliance
Government & Public Sector government-and-public-sector
Diagram
Deloitte
View slide
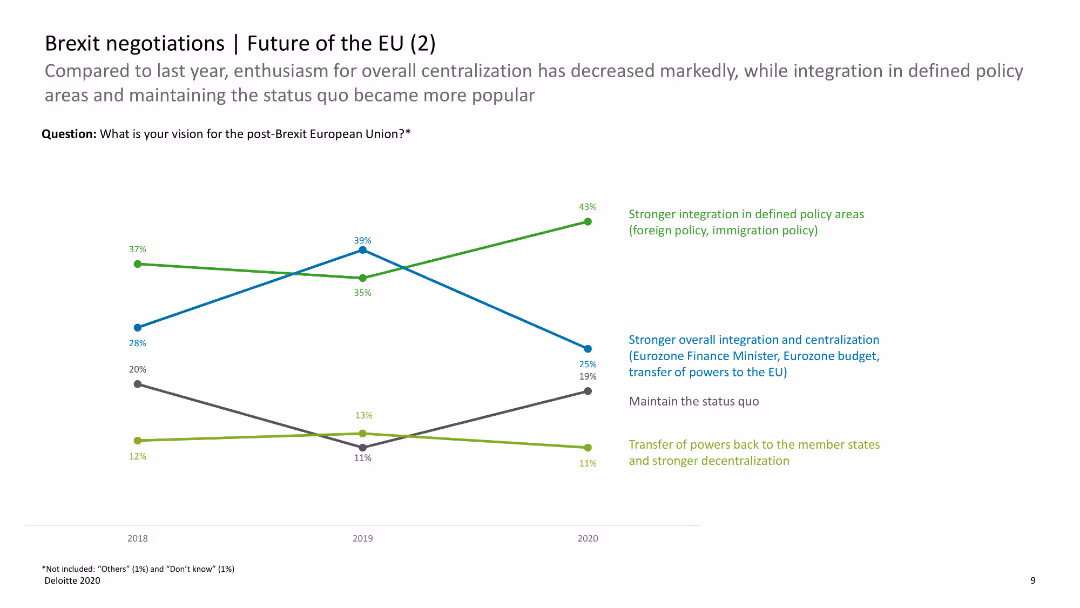
The slide includes a line chart comparing changes in opinions on the future of the EU over time, with data points for integration and decentralization preferences.
Regulatory and Compliance
Government & Public Sector
This slide compares survey data over time, showing trends in preferences for EU integration versus decentralization. It provides insights into changing opinions on EU policies post-Brexit.
Brexit, EU future, trends, integration, decentralization
false
Regulatory and Compliance
Government & Public Sector government-and-public-sector
Mixed Chart
Deloitte
View slide
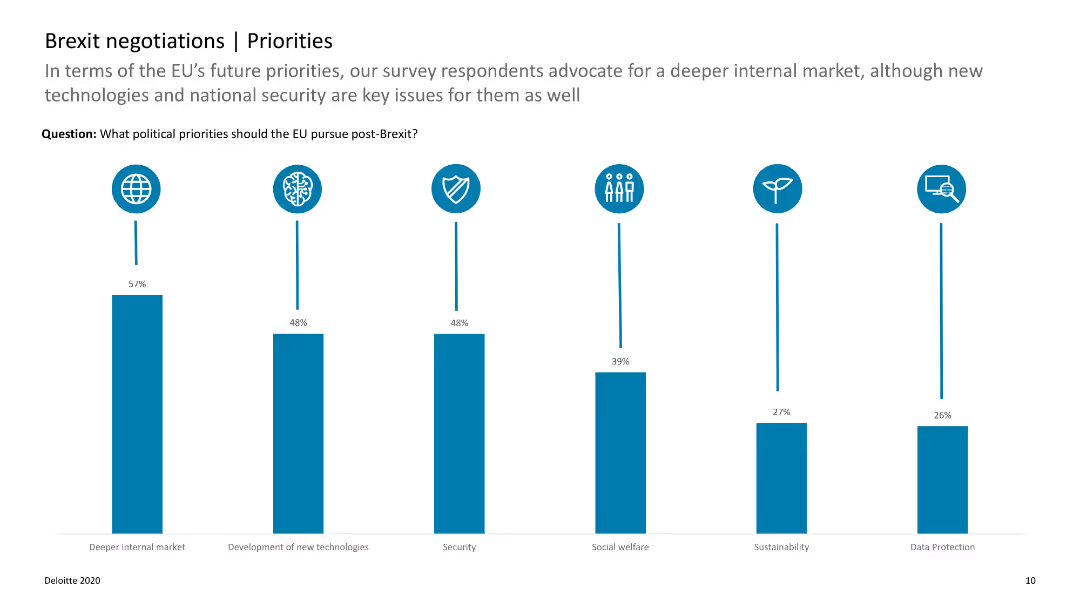
The slide features a column chart with data on the top political priorities for the EU post-Brexit, such as internal market and new technologies.
Strategic Planning
Government & Public Sector
This slide highlights the key political priorities for the EU after Brexit, showing the importance of internal market and technology development. It helps in understanding EU strategic focuses.
Brexit, EU priorities, political priorities, internal market, technology
false
Strategic Planning
Government & Public Sector government-and-public-sector
Single Chart
Deloitte
View slide
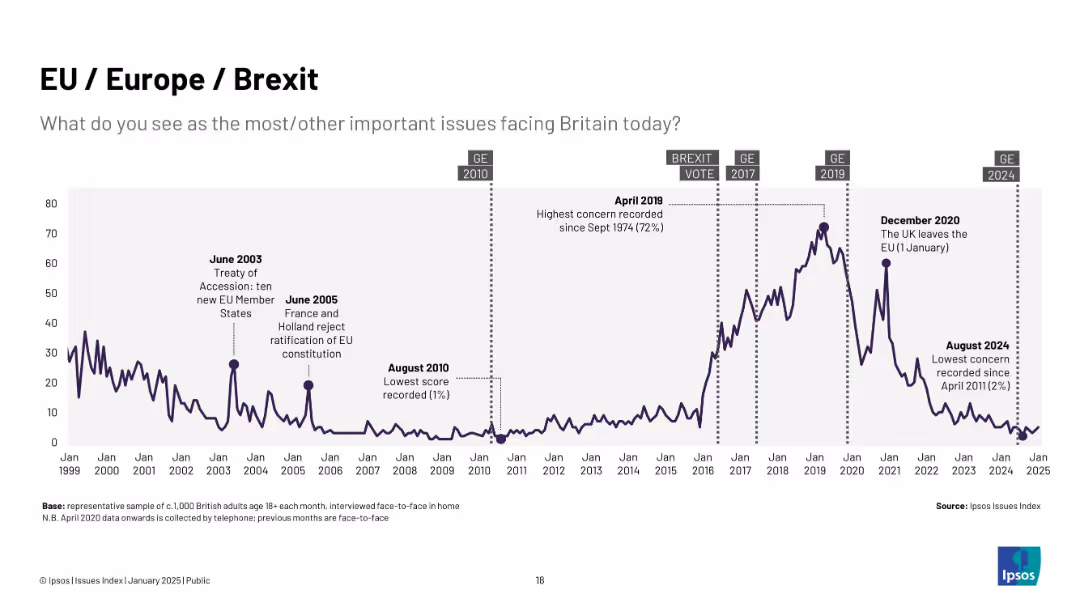
Long-term graph (1999–2025) showing rise in concern pre- and post-Brexit vote, peaking in April 2019 (72%); dark line with labeled political events.
Regulatory and Compliance
Government & Public Sector
Illustrates public concern with EU/Brexit-related issues, which spiked dramatically around the Brexit referendum and then declined to record lows by 2024.
Brexit, EU, UK politics, Europe, referendum, Ipsos, regulatory issues, concern levels
false
Regulatory and Compliance
Government & Public Sector government-and-public-sector
Single Chart
IPSOS
View slide
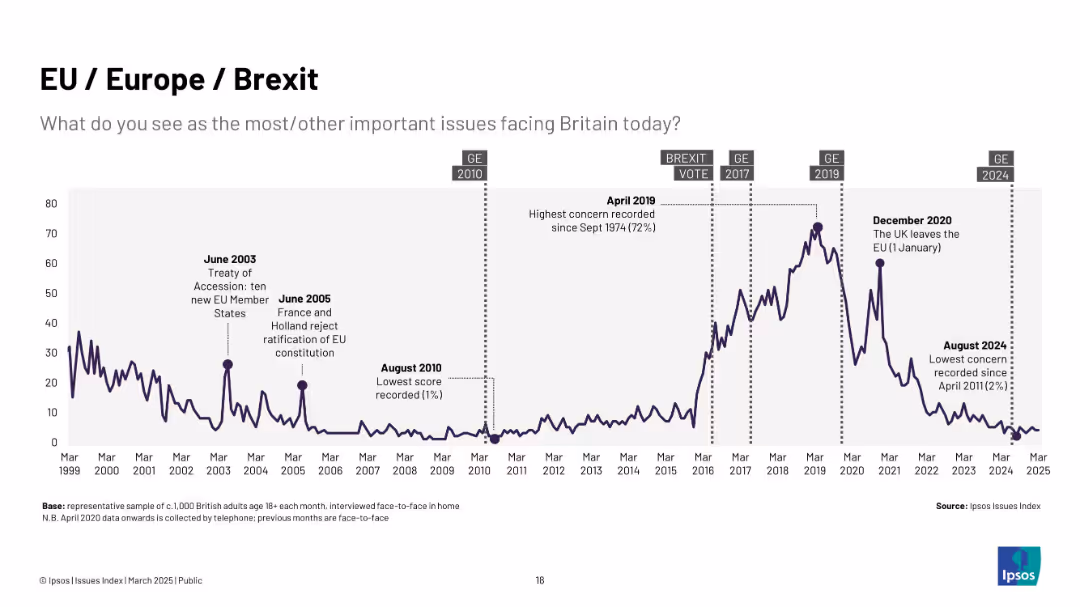
Purple line graph from 1999 to 2025; Brexit-related events are annotated; vertical dashed lines for GEs.
Market Analysis and Trends
Government & Public Sector
Reflects public concern about the EU and Brexit, with a sharp rise leading to the 2016 referendum and a peak in 2019. Post-Brexit, concern drops significantly.
Brexit, EU, referendum, UK politics, public opinion, Ipsos, sovereignty, elections, Europe
false
Market Analysis and Trends
Government & Public Sector government-and-public-sector
Single Chart
IPSOS
View slide
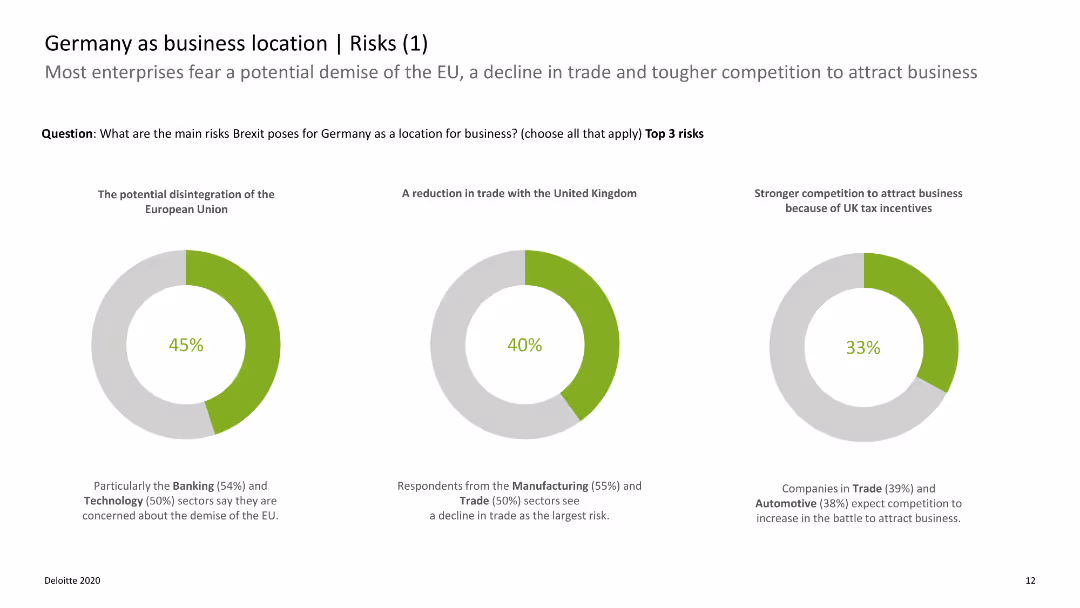
The slide includes donut charts showing the main risks of Brexit for Germany as a business location, with categories like EU disintegration and trade reduction.
Risk Assessment and Management
Government & Public Sector
This slide presents survey data on the perceived risks of Brexit for Germany, highlighting concerns about EU disintegration and trade impacts. It aids in risk assessment for businesses in Germany.
Brexit, Germany, business risks, EU disintegration, trade impacts
false
Risk Assessment and Management
Government & Public Sector government-and-public-sector
Multiple Chart
Deloitte
View slide
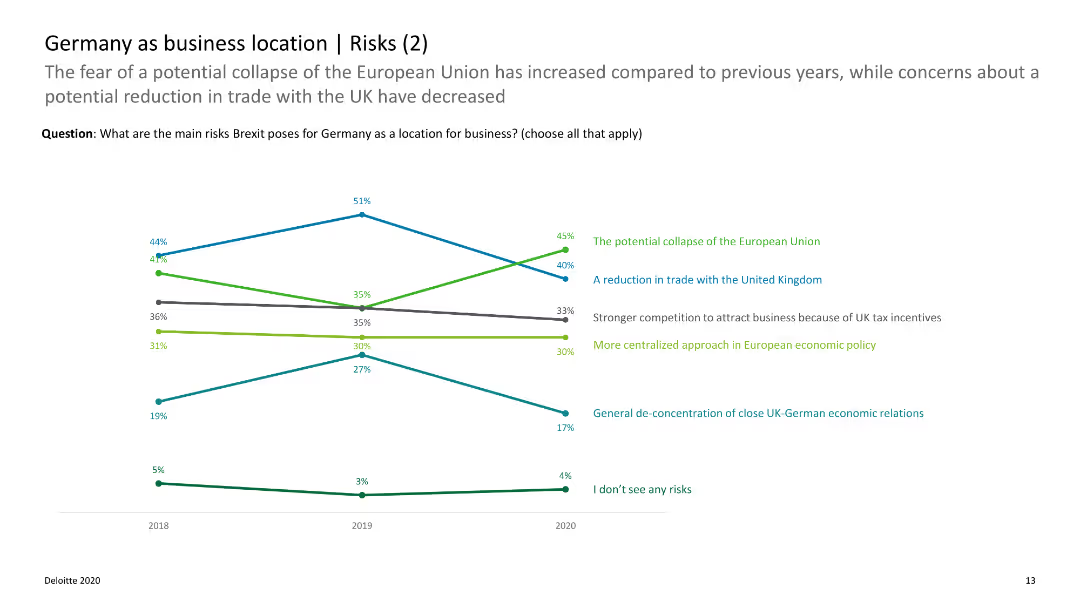
The slide features a line chart showing trends in the perceived risks of Brexit for Germany over time, with data on EU disintegration and trade concerns.
Risk Assessment and Management
Government & Public Sector
This slide shows how perceptions of Brexit risks for Germany have changed over time, focusing on issues like EU disintegration and trade. It helps in tracking risk perception trends.
Brexit, Germany, risk trends, EU disintegration, trade concerns
false
Risk Assessment and Management
Government & Public Sector government-and-public-sector
Single Chart
Deloitte
View slide
Comparative column charts evaluating the impact of Brexit under different scenarios with business leader insights.
Investment Analysis
Government & Public Sector
Evaluates the potential impacts of different Brexit scenarios on French business operations and investments.
Brexit, business impact, France, UK, investment levels, company activity
false
Investment Analysis
Government & Public Sector government-and-public-sector
Multiple Chart
Bain
View slide
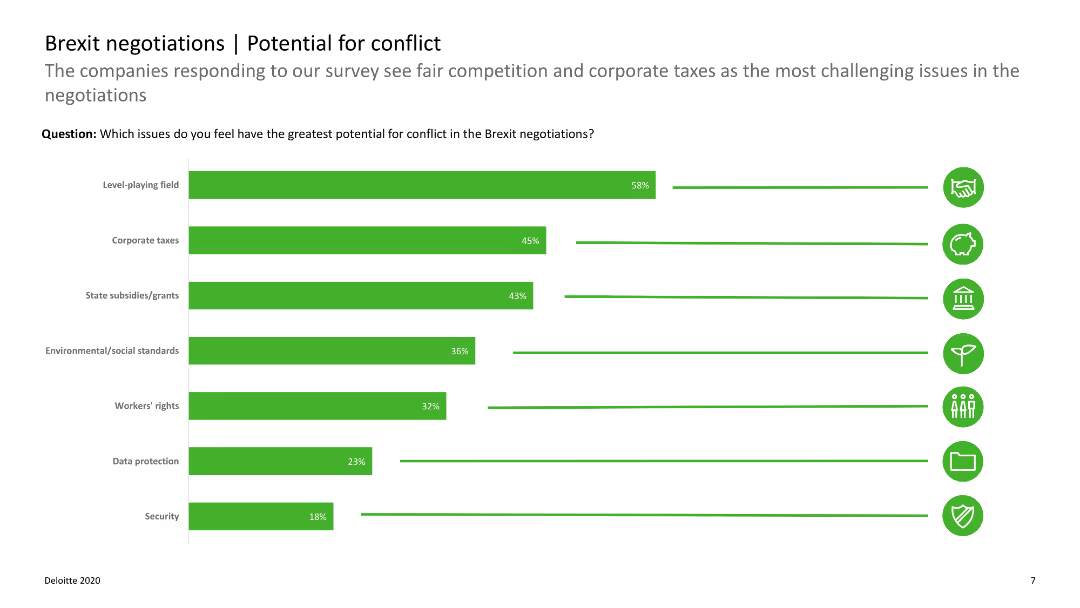
The slide includes horizontal bar charts showing potential conflict areas in Brexit negotiations, such as corporate taxes and state subsidies.
Regulatory and Compliance
Government & Public Sector
The slide outlines areas of potential conflict in Brexit negotiations, emphasizing issues like corporate taxes and fair competition. It aids in identifying key negotiation concerns.
Brexit, conflict, negotiations, corporate taxes, state subsidies
false
Regulatory and Compliance
Government & Public Sector government-and-public-sector
Single Chart
Deloitte
View slide
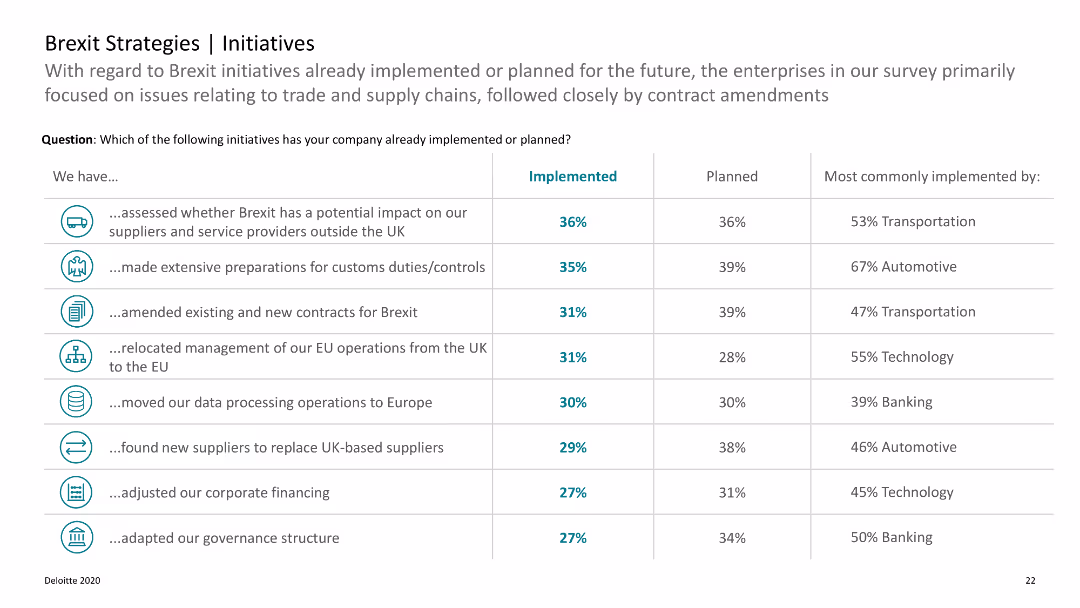
A table listing Brexit initiatives already implemented or planned, with implementation percentages and sectors.
Strategic Planning
Professional Services
Lists various Brexit-related initiatives undertaken by companies, focusing on trade, supply chains, and contract amendments.
Brexit, initiatives, planning, companies, trade
false
Strategic Planning
Professional Services professional-services
Table
Deloitte
View slide
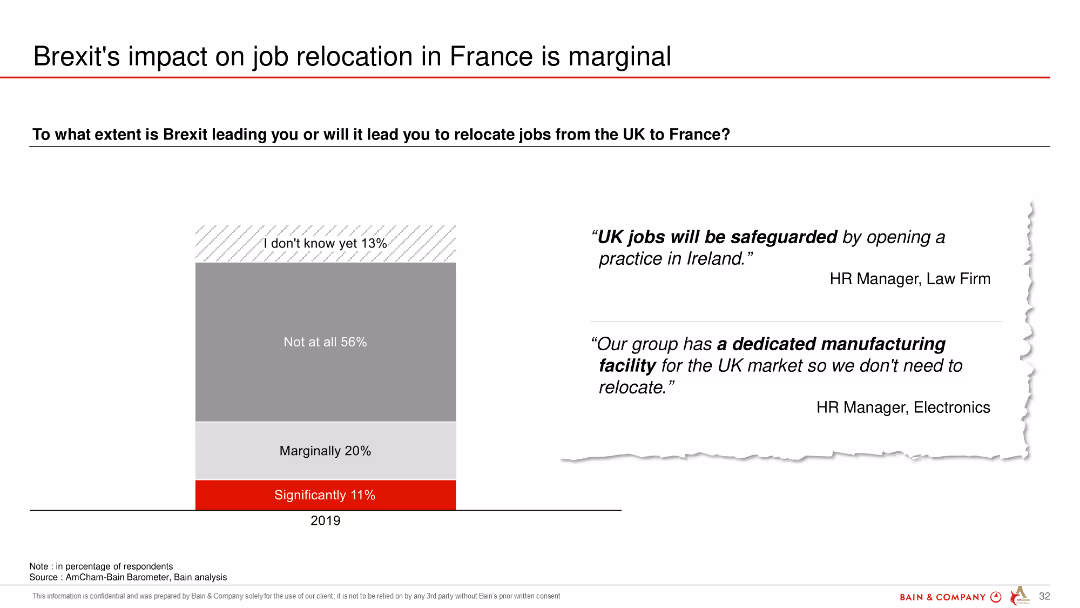
The slide features a column chart showing the extent to which Brexit is expected to lead to job relocations from the UK to France, with a majority indicating no significant impact.
Regulatory and Compliance
Government & Public Sector
The slide illustrates that most respondents do not expect Brexit to lead to significant job relocations from the UK to France, with marginal to no impact.
Brexit, job relocation, UK, France, impact, survey, expectations
false
Regulatory and Compliance
Government & Public Sector government-and-public-sector
Mixed Chart
Bain
View slide
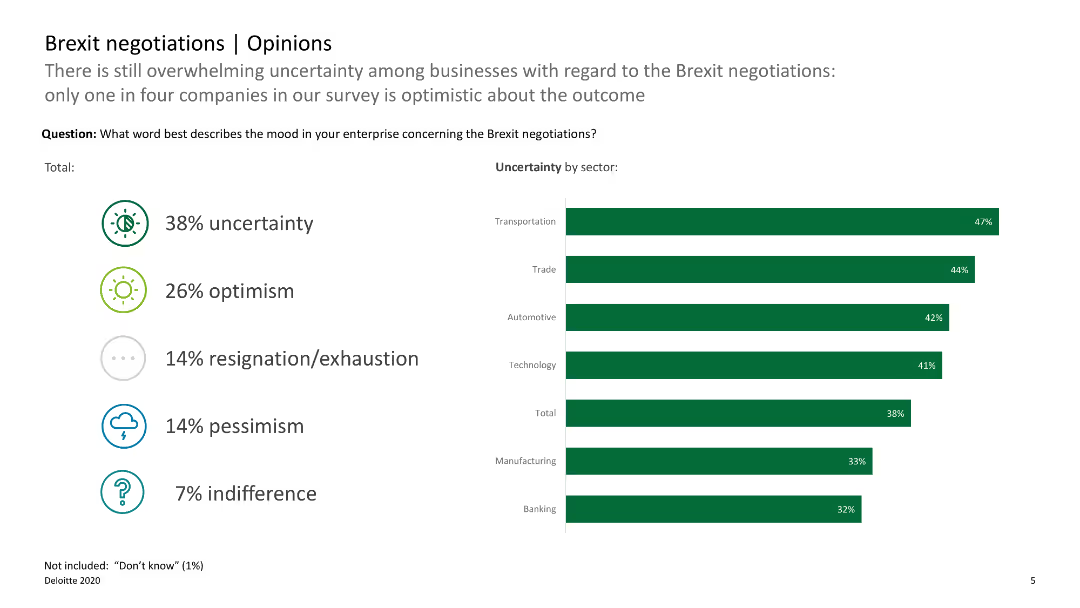
The slide uses icons and horizontal bar charts to show different opinions on Brexit negotiations, with categories such as uncertainty, optimism, and pessimism.
Regulatory and Compliance
Government & Public Sector
This slide presents survey data on business opinions regarding Brexit negotiations, highlighting uncertainty and optimism levels. It is useful for gauging business sentiment.
Brexit, opinions, survey, business sentiment, negotiations
false
Regulatory and Compliance
Government & Public Sector government-and-public-sector
Single Chart
Deloitte
View slide
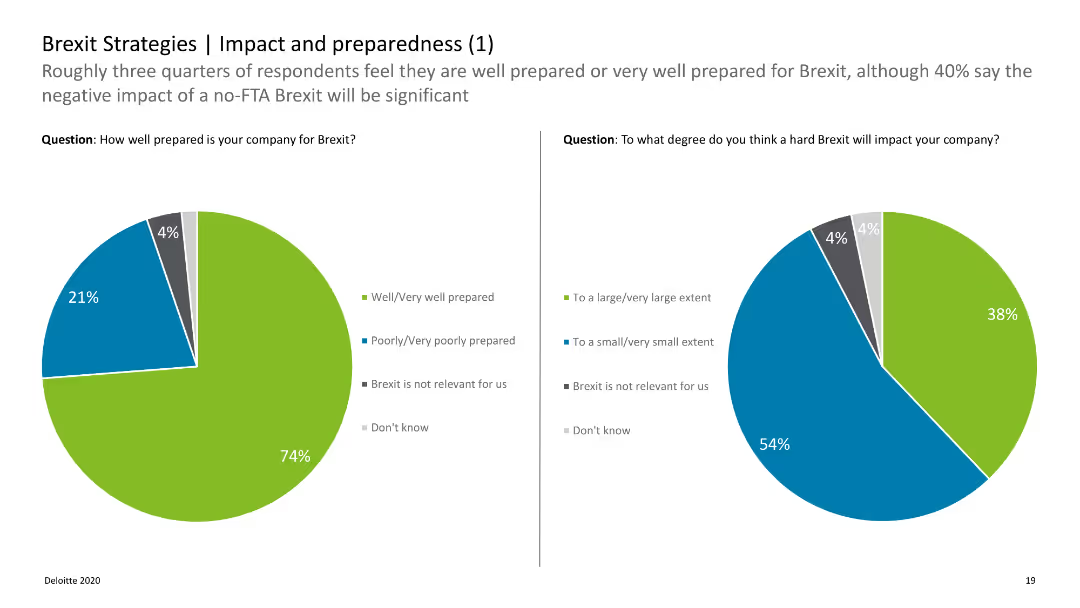
The slide has two pie charts showing preparedness levels and the expected impact of a hard Brexit.
Strategic Planning
Professional Services
Discusses how well companies feel prepared for Brexit and the anticipated impact, with a majority feeling well-prepared.
Brexit, preparedness, impact, companies, survey
false
Strategic Planning
Professional Services professional-services
Multiple Chart
Deloitte
Previous
Loading...
Hold On!
We are searching in our database
If nothing, comes up, please try different filters!
Column Chart
Heatmap
Chevron
Org Chart
Infographic
Callouts
Timeline
List
Graphic
Picture
Process Flow
Diagram
Paragraph
Map
Table
Framework
Subtitle
Takeaway Box
Icon
Other Chart
Radar Chart
Waterfall Chart
Mekko Chart
Pie Chart
Scatter Plot
Line Chart
Bar chart
Bullet points
Create a FREE account to continue browsing
Receive Instant Access to 1,000+ slides from companies like McKinsey, Google, and Goldman Sachs
First Name
Last Name
Email
Password
I agree to all
Terms & Privacy Policy
Thank you! Your submission has been received!
Oops! Something went wrong while submitting the form.
Have an account?
Sign in
Upgrade to PRO to Save slides
Advanced Search and Filters
Access to 15,000+ slides
Access to Category Pages
Save/Bookmark Slides
PowerPoint Template Library
Pick a Plan
MONTHLY
$12/month
Billed every month, Cancel anytime.
YEARLY
$9/year
Billed $108 annually, Cancel anytime.
Checkout for $12/month
Checkout for $108/yr
Secured by Stripe | AES-256 bit encryption