My Account
My Slides
Search by Category
Templates
View All Templates
Download Template Slides
Leave Feedback
Login
Logout
Get Started
Browse all Slides
Browse all Slides
Create a FREE Account
Instant access to 1,000+ real slides from top companies like McKinsey, BCG, Goldman Sachs, Google and many more!
First Name
Last Name
Email
Password
I agree to all
Terms & Privacy Policy
Thank you! Your submission has been received!
Oops! Something went wrong while submitting the form.
Have an account?
Sign in
Spark Your Next Big Idea with New Presentation Templates
VIEW ALL Templates
Welcome,
Welcome
PRO
Show Featured Only
Checkbox 8
Companies
Mckinsey
Bain
BCG
EY
Deloitte
Accenture
PwC/Strategy&
JP Morgan
Goldman Sachs
Morgan Stanley
Citigroup
Deutsche Bank
Barclays
LEK
KPMG
Kearney
Oliver Wyman
Booz Allen Hamilton
Gartner
IPSOS
Nielsen
Slide type
Text Only
Linear Flow
Vertical Flow
Single Chart
Header Horizontal
Mixed Chart
Header Vertical
Pillar
Multiple Chart
Graphic
Agenda
Title
Table
Framework
Industry
Technology & Software
Artificial Intelligence
Financial Services
Retail & E-commerce
Consumer Goods
Industrial & Manufacturing
Transportation & Logistics
Telecommunications
Real Estate & Construction
Hospitality & Tourism
Professional Services
Education & Training
Media & Entertainment
Agriculture & Food Production
Healthcare & Pharmaceuticals
Environmental Services & Sustainability
Government & Public Sector
Use Case
Mergers and Acquisitions
Performance Metrics and KPIs
Client Case Studies
Competitive Landscape
Corporate Finance and Valuation
Product and Service Analysis
Customer and Market Segmentation
Organizational Structure and Change
Industry Overview
Regulatory and Compliance
Risk Assessment and Management
Investment Analysis
Organizational Structure and Change
Human Resources and Talent Management
Financial Performance
Market Analysis and Trends
Sales and Business Development
Human Resources and Talent Management
Clear all
Thank you! Your submission has been received!
Oops! Something went wrong while submitting the form.
Tag
View slide
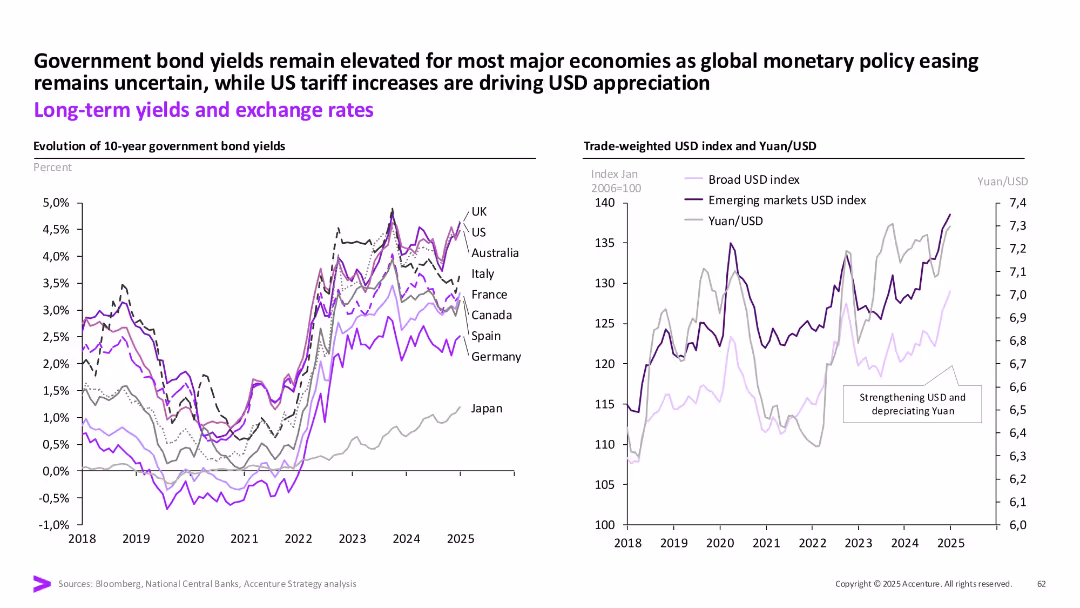
Two charts: government bond yields (left), USD and Yuan index (right); consistent color-coding and annotations.
Investment Analysis
Financial Services
This slide reviews long-term bond yield trends and USD exchange rates, noting elevated yields and a strengthening dollar driven by monetary policy and tariffs. Japan’s divergence is also shown.
Bond yields, USD, Yuan, interest rates, inflation, tariffs, global economy
false
Investment Analysis
Financial Services financial-services
Multiple Chart
Accenture
View slide
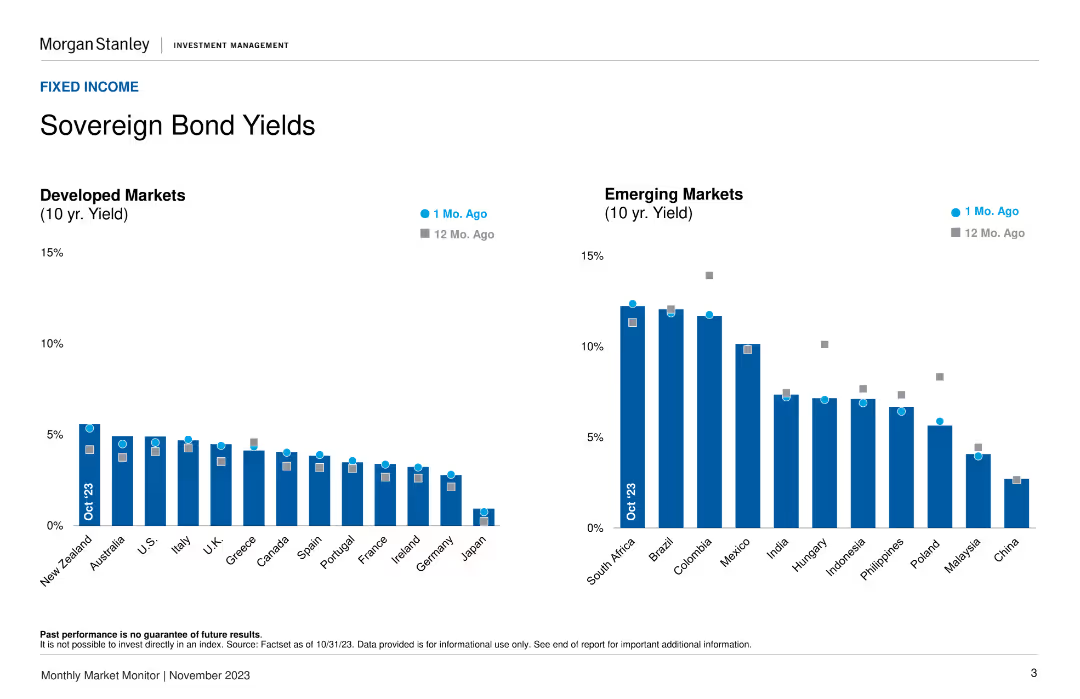
Two column charts showing 10-year bond yields for developed and emerging markets, comparing current rates to rates from 1 month and 12 months ago.
Market Analysis and Trends
Financial Services
Provides 10-year sovereign bond yields for developed and emerging markets, helping analyze trends in bond yields and their implications.
Bond yields, developed markets, trends
false
Market Analysis and Trends
Financial Services financial-services
Multiple Chart
Morgan Stanley
View slide
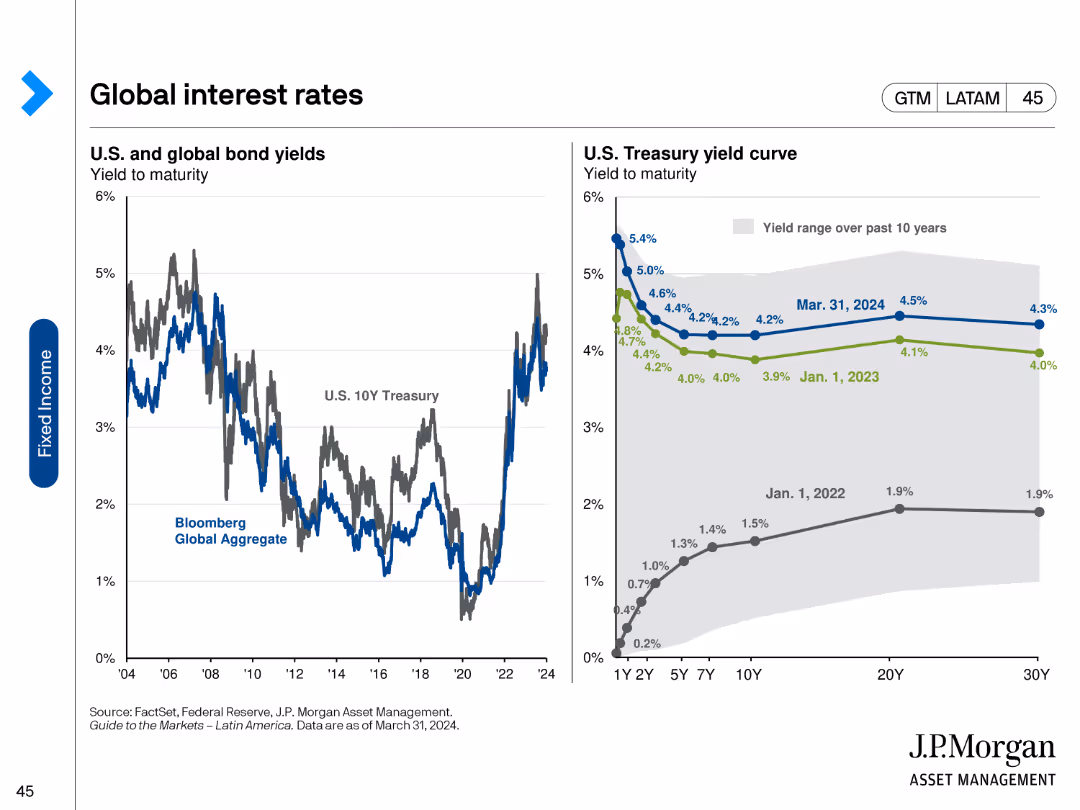
The slide includes two line charts: one showing U.S. and global bond yields over time, and the other displaying the U.S. Treasury yield curve at different points in time. The charts use distinct colors for different time periods and bond types.
Market Analysis and Trends
Financial Services
It compares the yield to maturity for U.S. and global bonds and shows changes in the U.S. Treasury yield curve over the past few years. This helps analyze trends in interest rates and predict future movements.
Bond yields, yield curve, U.S. Treasury, interest rates, global bonds
false
Market Analysis and Trends
Financial Services financial-services
Multiple Chart
JP Morgan
View slide
The slide contains two line charts: 'Average Spread (bps)' and 'Annual Default Rate' with a legend and data table. The charts show trends over time from 2014 to 2024, with varying line styles for different corporate bonds. The layout is clean with clear axis labels and a comparison table.
Market Analysis and Trends
Financial Services
This slide analyzes corporate bond market trends by depicting the average spread in basis points and the annual default rates over a decade. It compares high-yield and investment-grade corporate bonds, providing a quick visual summary of the market's performance, suitable for financial analysts or investors looking at historical trends and current market conditions.
Bonds, Default Rate, Spread, Corporate, Financial Market
false
Market Analysis and Trends
Financial Services financial-services
Multiple Chart
Morgan Stanley
View slide
This slide features a four-step circular process diagram at the left and a three-part list on the right. The background is white, with the header and footer in dark blue. A page number is at the bottom right.
Financial Performance
Financial Services
The slide outlines a comprehensive framework for bond processes, including opportunity identification, investment tagging, and internal review. It also describes the broader integration of project selection, asset tracking, and reporting within the company's sustainability framework. It's ideal for explaining the systematic approach to stakeholders or potential investors and highlighting the organization's transparency and accountability in sustainable finance.
Bonds, Finance, Sustainability, Reporting, Investment, Framework, Process, Guidelines, Auditing
false
Financial Performance
Financial Services financial-services
Linear Flow
Goldman Sachs
View slide
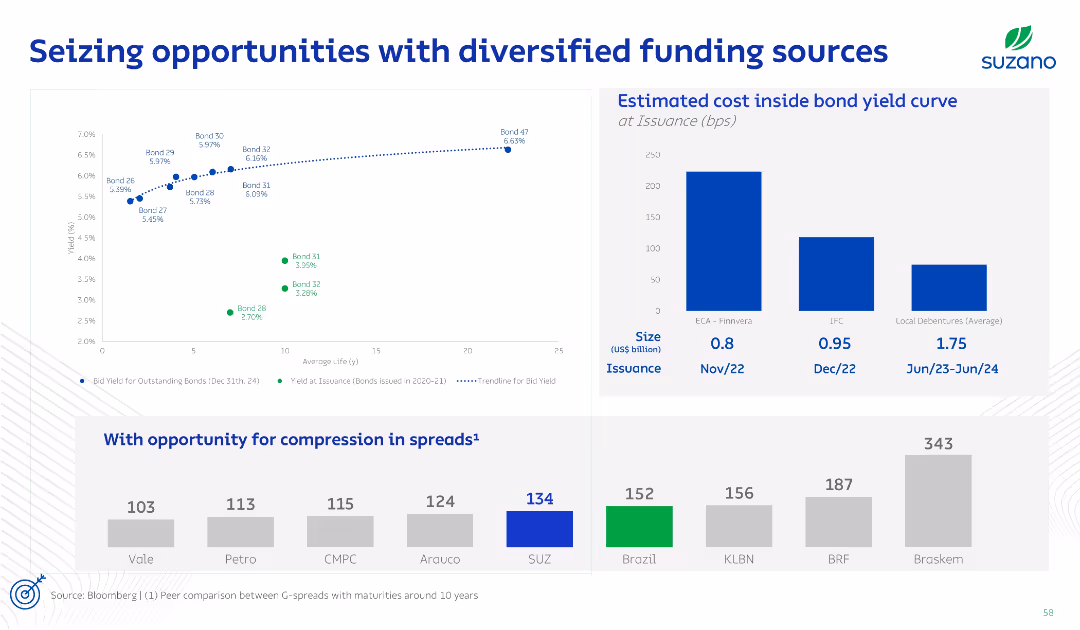
Graph and bar layout: yield vs maturity bond chart, cost comparison for funding instruments, and spread analysis with peer companies; text boxes used for annotations.
Investment Analysis
Consumer Goods
The slide focuses on Suzano’s bond issuance strategy and cost of funding, showing yields at issuance versus market benchmarks. It also explores potential for spread compression relative to peers, indicating room for cost efficiency.
Bonds, Yield Curve, Funding Cost, Spreads, Financing
false
Investment Analysis
Consumer Goods consumer-goods
Multiple Chart
Goldman Sachs
View slide
The slide includes a table and text discussing environmental health and safety metrics such as EMR, TRIR, DART, and severity rates, alongside a descriptive analysis.
Regulatory and Compliance
Environmental Services & Sustainability
This slide outlines Booz Allen's environmental health and safety (EHS) program, detailing metrics like EMR, TRIR, DART, and severity rates to highlight workplace safety improvements.
Booz Allen, EHS, safety metrics, EMR, TRIR, DART
false
Regulatory and Compliance
Environmental Services & Sustainability environmental-services-and-sustainability
Mixed Chart
Booz Allen Hamilton
View slide
The slide features a circular diagram representing Booz Allen's ESG governance structure, including roles of the Board of Directors, ESG Committee, ESG Council, and ESG Team.
Regulatory and Compliance
Professional Services
This slide explains Booz Allen's ESG governance, detailing the roles and responsibilities of the Board of Directors, ESG Committee, ESG Council, and ESG Team in managing ESG topics.
Booz Allen, ESG governance, ESG Committee, Board of Directors, compliance
false
Regulatory and Compliance
Professional Services professional-services
Diagram
Booz Allen Hamilton
View slide
The slide presents a detailed text description of Booz Allen's ESG strategy, highlighting internal and external drivers, impact pillars, and goals, with a focus on sustainability.
Strategic Planning
Professional Services
This slide describes Booz Allen's environmental, social, and governance (ESG) strategy, emphasizing their goals, internal and external drivers, and impact pillars for sustainable growth.
Booz Allen, ESG strategy, sustainability, impact pillars, internal drivers
false
Strategic Planning
Professional Services professional-services
Pillar
Booz Allen Hamilton
View slide
The slide includes several column charts displaying employee demographics by headcount, gender, age distribution, race, ethnicity, and other diversity metrics.
Human Resources and Talent Management
Professional Services
This slide provides a snapshot of Booz Allen's employee demographics, highlighting diversity in headcount, gender, age distribution, race, ethnicity, and other inclusion metrics for 2023.
Booz Allen, employee demographics, diversity, inclusion, 2023
false
Human Resources and Talent Management
Professional Services professional-services
Multiple Chart
Booz Allen Hamilton
View slide
The slide features a column chart showing FY23 greenhouse gas emissions by category and a text description of the company's efforts to reduce carbon footprint and enhance sustainability.
Regulatory and Compliance
Environmental Services & Sustainability
This slide presents data on Booz Allen's FY23 greenhouse gas emissions, categorized by scope, and discusses initiatives to reduce the company's carbon footprint and enhance sustainability.
Booz Allen, greenhouse gas emissions, sustainability, FY23, carbon footprint
false
Regulatory and Compliance
Environmental Services & Sustainability environmental-services-and-sustainability
Multiple Chart
Booz Allen Hamilton
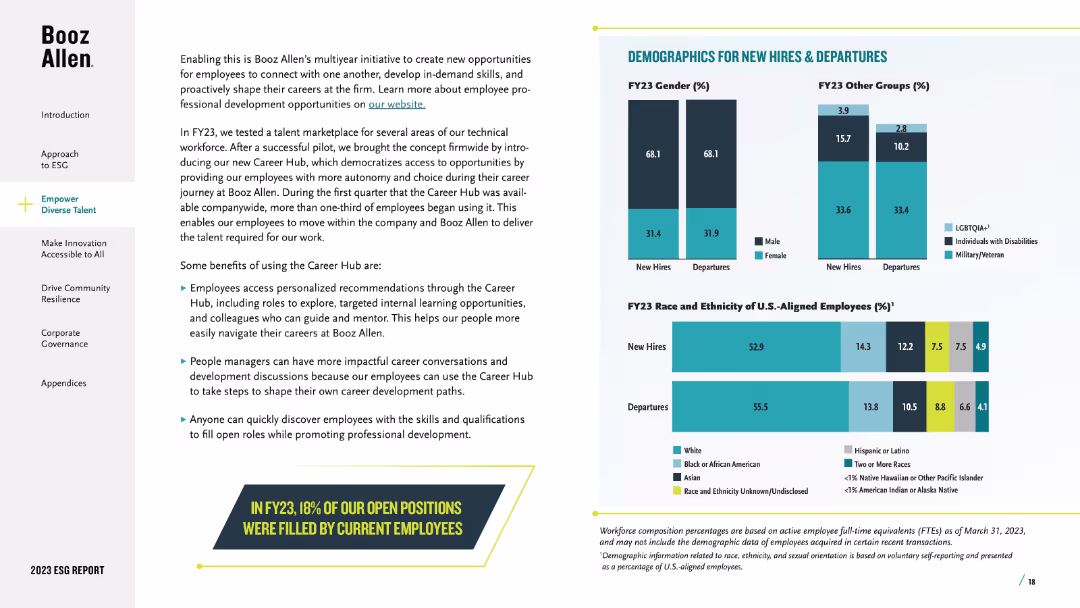
View slide
The slide showcases column charts comparing the demographics of new hires and departures by gender, race, ethnicity, and other diversity categories for fiscal year 2023.
Human Resources and Talent Management
Professional Services
This slide analyzes the demographics of new hires and departures at Booz Allen in FY23, focusing on diversity in gender, race, and ethnicity to assess hiring and retention trends.
Booz Allen, new hires, departures, demographics, diversity
false
Human Resources and Talent Management
Professional Services professional-services
Multiple Chart
Booz Allen Hamilton
View slide
The slide includes a line graph showing the average five-year fixed contract mortgage rate trends.
Market Analysis and Trends
Real Estate & Construction
It explains how lower borrowing costs have made housing more affordable, showing the decline in mortgage rates.
Borrowing costs, affordability, mortgage rates, housing, decline, trends, line graph, financial impact, analysis
false
Market Analysis and Trends
Real Estate & Construction real-estate-and-construction
Single Chart
IPSOS
View slide
Data visualizations include a pie chart and column charts with consistent color palette and icons.
Operational Efficiency
Financial Services
Data on customer acquisition channels, balance distribution, and banker productivity to showcase branch network importance.
Branch Network, Digital Engagement, Customer Service, Banker Productivity, Data Visualization, Strategic Asset
false
Operational Efficiency
Financial Services financial-services
Multiple Chart
JP Morgan
View slide
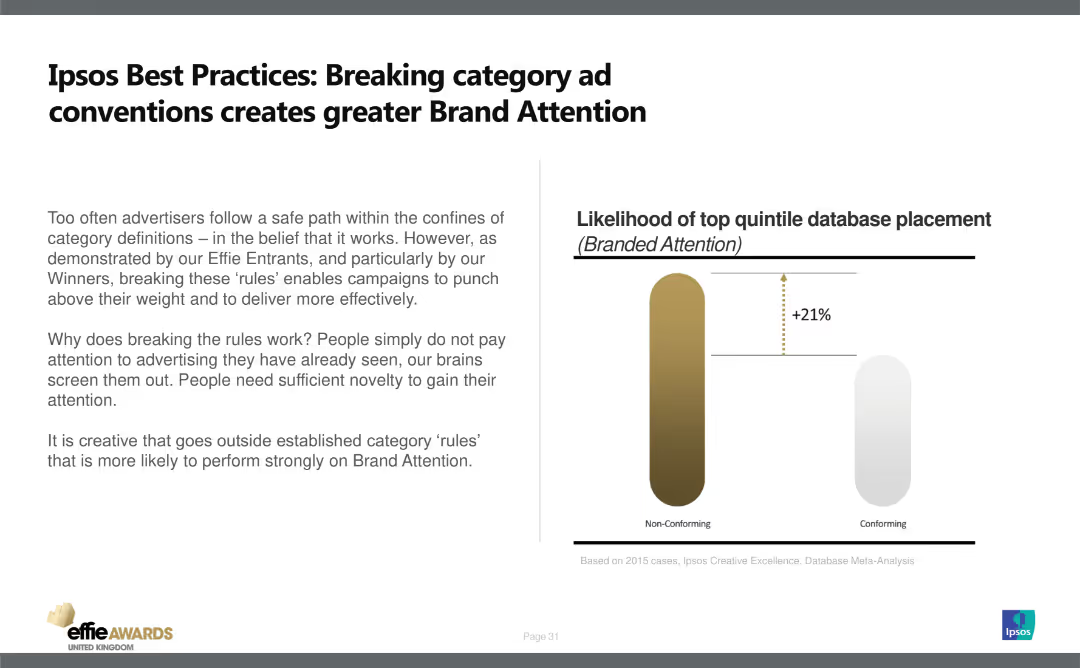
The slide has a title at the top, text on the left, and a column chart on the right. It features a simple design with minimal visual elements.
Strategic Planning
Media & Entertainment
Explains the importance of breaking category conventions in advertising to enhance brand attention. Uses data to show non-conforming ads have 21% higher likelihood of top quintile database placement.
Brand Attention, Advertising, Strategy, Conventions, Effectiveness
false
Strategic Planning
Media & Entertainment media-and-entertainment
Mixed Chart
IPSOS
View slide
Pie chart showing the turnover distribution among Unilever’s top brands: Knorr and Hellmann’s. Gray and green colors, simple labels.
Competitive Landscape
Consumer Goods
Details the concentration of Unilever's turnover within its top brands, highlighting the significance of Knorr and Hellmann's in its global strategy. Offers insights into brand management and market penetration.
Brand Management, Turnover Distribution, Knorr, Hellmann’s, Market Penetration
false
Competitive Landscape
Consumer Goods consumer-goods
Single Chart
Deutsche Bank
View slide
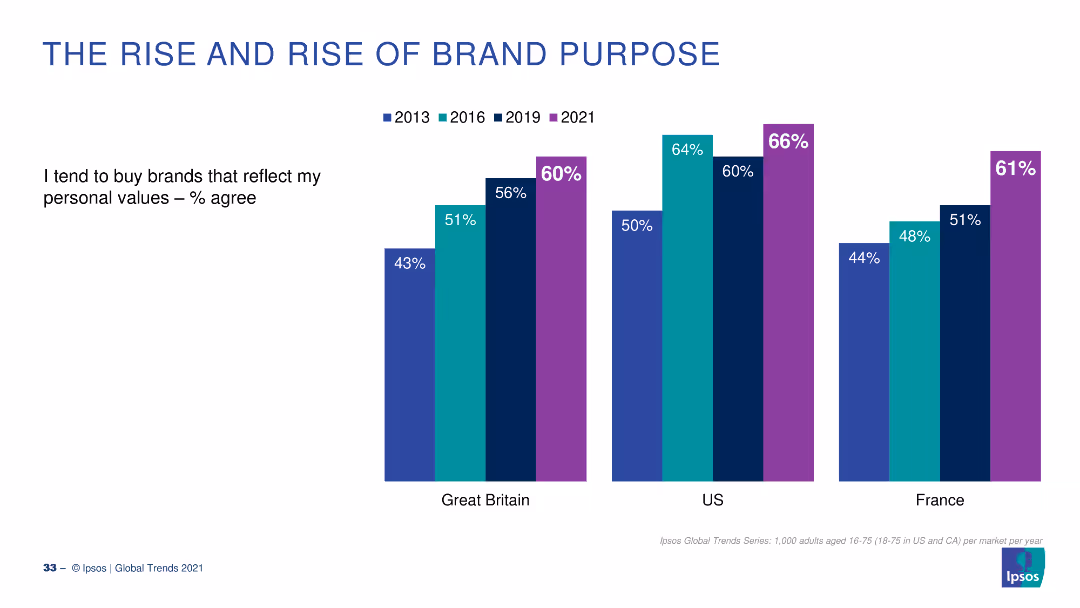
A column chart showing the percentage agreement from 2013 to 2021 that people buy brands reflecting their personal values, with data for the UK, US, and France.
Market Analysis and Trends
Consumer Goods
The slide depicts the increasing trend of consumers buying brands that reflect their personal values, comparing data from 2013 to 2021.
Brand Purpose, Consumer Behavior, Trends, Personal Values, Countries
false
Market Analysis and Trends
Consumer Goods consumer-goods
Multiple Chart
IPSOS
View slide
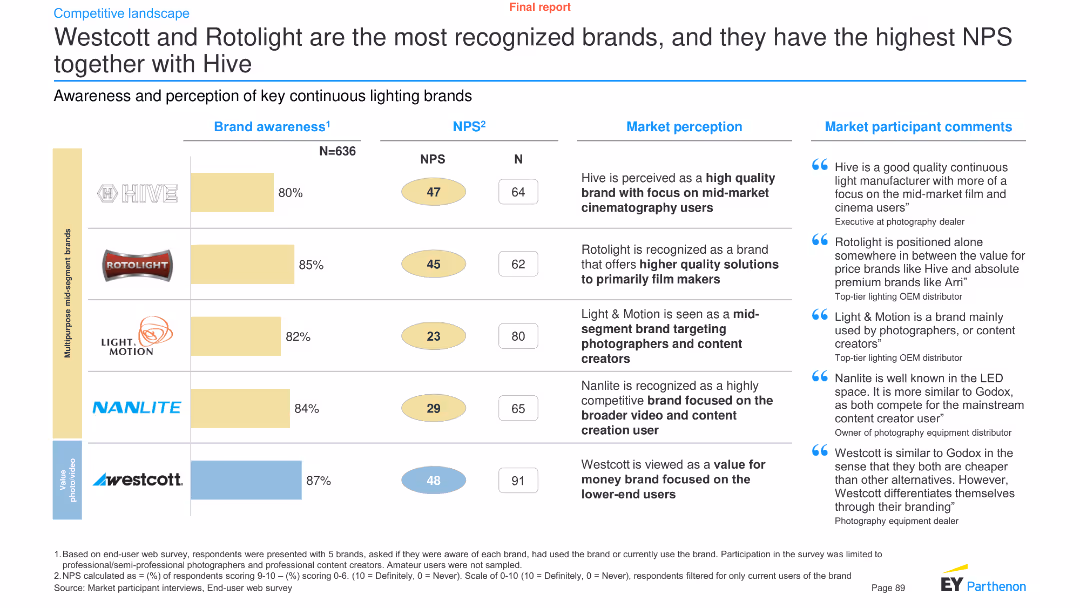
The slide presents brand awareness and NPS (Net Promoter Score) data for continuous lighting brands, using a combination of bar charts and text.
Customer and Market Segmentation
Consumer Goods
It evaluates the awareness and perception of continuous lighting brands like Hive, Rotolight, Light & Motion, Nanlite, and Westcott, along with participant comments.
Brand awareness, NPS, continuous lighting, Westcott, Rotolight, Hive, perception, consumer goods, market segmentation, analysis
false
Customer and Market Segmentation
Consumer Goods consumer-goods
Mixed Chart
EY
View slide
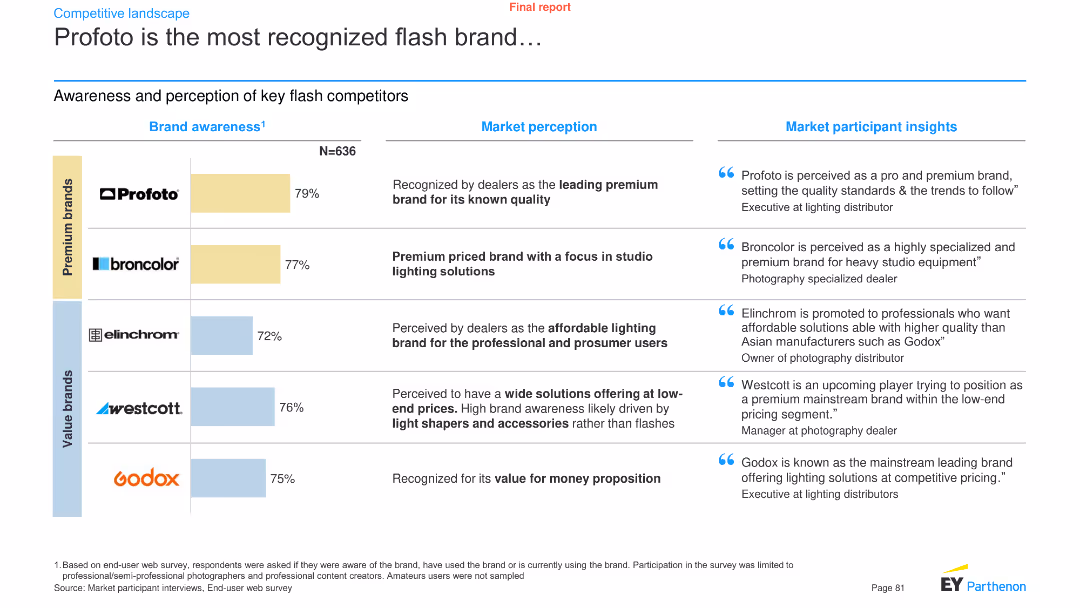
A combination of a bar chart and text boxes presents brand awareness data for key flash competitors, along with market perception and participant insights.
Pricing Strategies
Media & Entertainment
It showcases the brand awareness levels of key flash brands like Profoto, Broncolor, Elinchrom, Westcott, and Godox, with market perception and insights.
Brand awareness, flash brands, Profoto, market perception, participant insights, media, entertainment, analysis, trends
false
Pricing Strategies
Media & Entertainment media-and-entertainment
Mixed Chart
EY
View slide
Bar chart comparing factors influencing the choice of vehicle brand, differentiated by engine type (EV vs ICE). Multiple data points in a clean, professional layout.
Market Analysis and Trends
Transportation & Logistics
This slide examines the factors driving brand choice for new vehicles, with significant differences between EV and ICE buyers. It highlights the importance of price and product quality.
Brand choice, consumer preferences, EV vs ICE, market analysis, purchasing factors
false
Market Analysis and Trends
Transportation & Logistics transportation-and-logistics
Single Chart
Deloitte
View slide
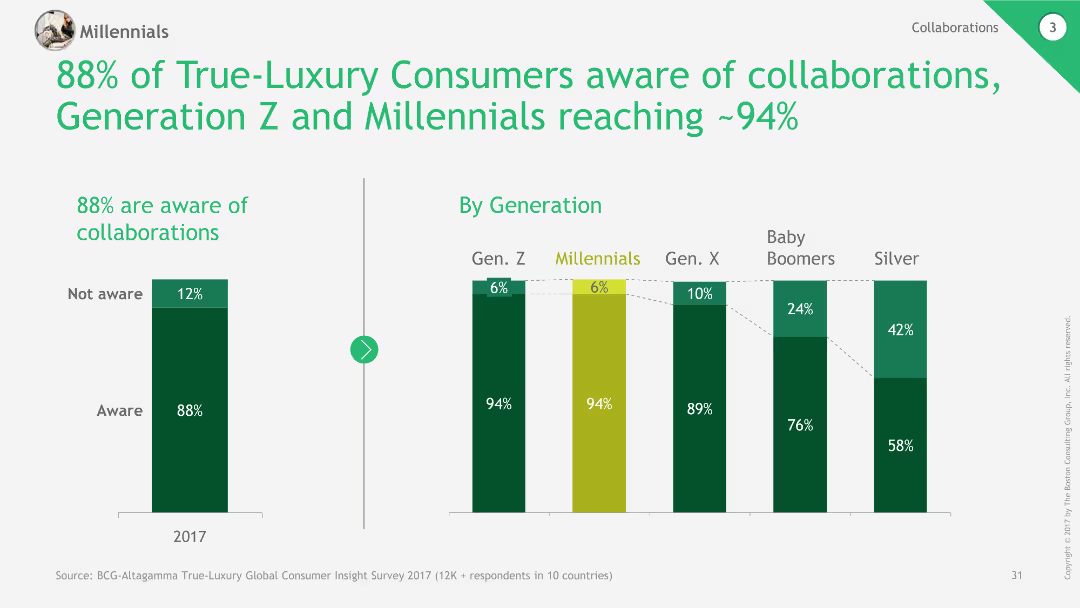
The slide contains column charts showing awareness of collaborations among different generations and overall awareness percentages.
Market Analysis and Trends
Retail & E-commerce
The slide highlights high awareness of brand collaborations among luxury consumers, particularly in Generation Z and Millennials.
Brand collaborations, Awareness, Luxury consumers, Generations, Market trends
false
Market Analysis and Trends
Retail & E-commerce retail-and-e-commerce
Multiple Chart
BCG
View slide
A bar chart showing reasons for switching vehicle brands, using varying shades of teal. The chart includes percentages and is straightforward in layout.
Market Analysis and Trends
Transportation & Logistics
This slide presents reasons why consumers consider switching vehicle brands, with the desire for something different being the most dominant factor. Useful for analyzing brand loyalty and consumer behavior in the automotive sector.
Brand loyalty, consumer behavior, market analysis, vehicle brands, switching reasons
false
Market Analysis and Trends
Transportation & Logistics transportation-and-logistics
Single Chart
Deloitte
View slide
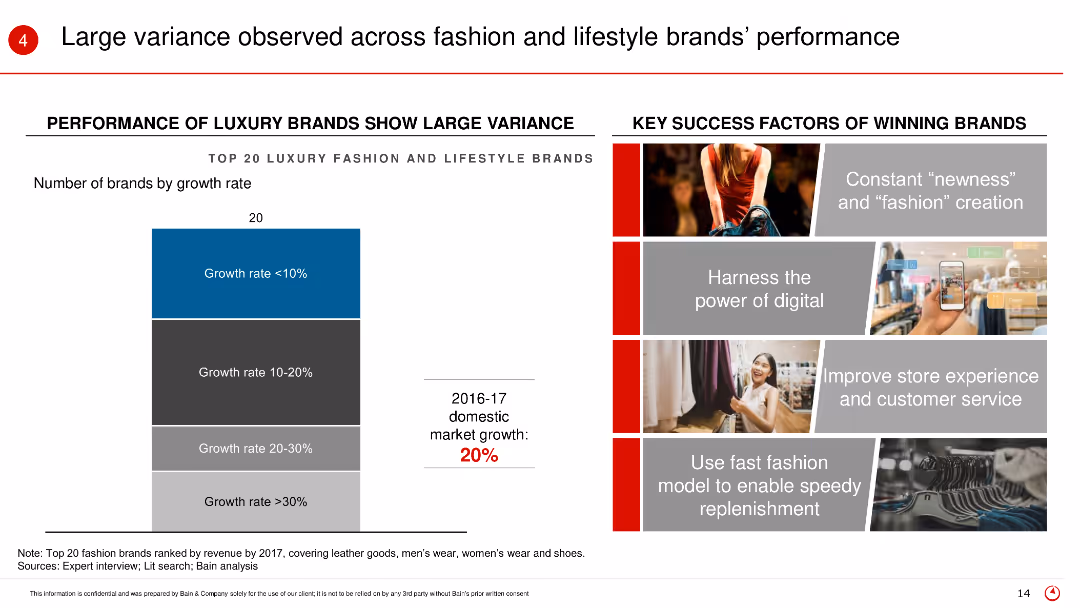
The slide includes a column chart showing the performance of top 20 luxury fashion and lifestyle brands by growth rate, accompanied by key success factors on the right.
Market Analysis and Trends
Retail & E-commerce
This slide analyzes the performance variance among top luxury brands, identifying key success factors such as digital power, customer service, and fast fashion models.
Brand performance, luxury brands, growth rate, key success factors, fashion brands
false
Market Analysis and Trends
Retail & E-commerce retail-and-e-commerce
Mixed Chart
Bain
View slide
Three circle diagrams and a column chart depict consumer preferences for domestic vs. foreign vehicle brands and the importance of local manufacturing. Clear, minimalistic design.
Market Analysis and Trends
Transportation & Logistics
This slide explores consumer attitudes towards domestic versus foreign vehicle brands and the importance they place on local manufacturing, showing a predominant indifference to brand origin if the vehicle meets their needs.
Brand preference, consumer behavior, domestic vs foreign, local manufacturing, vehicle purchase
false
Market Analysis and Trends
Transportation & Logistics transportation-and-logistics
Mixed Chart
Deloitte
View slide
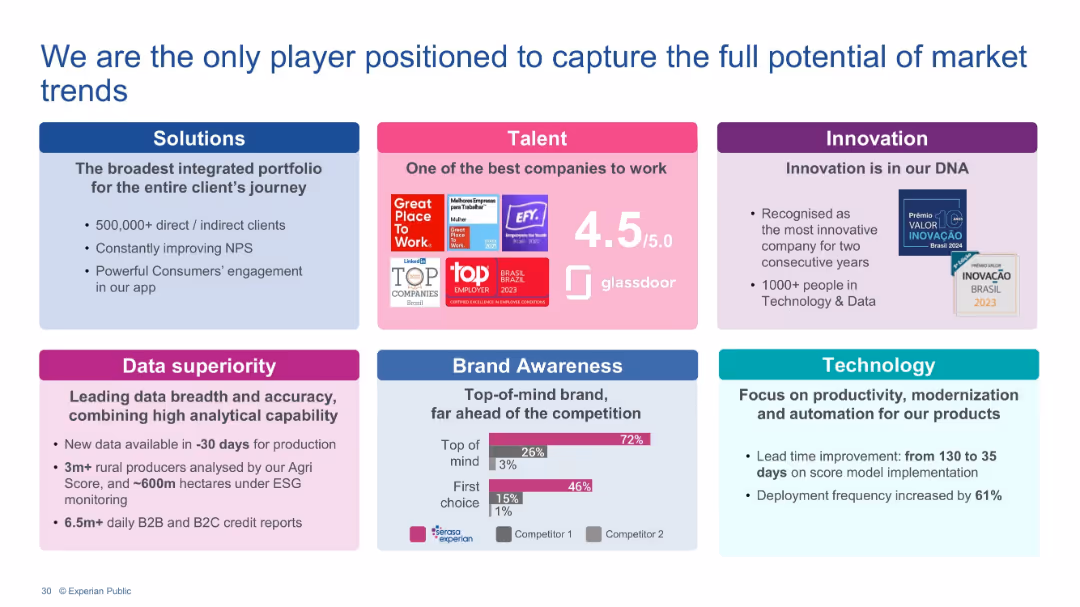
Grid layout with six colored boxes covering Solutions, Talent, Innovation, Data Superiority, Brand Awareness, and Technology. Each includes text, icons, and/or charts.
Strategic Planning
Technology & Software
This slide showcases Experian's strategic assets and competitive advantages including broad solutions portfolio, talented workforce, recognized innovation, data capabilities, strong brand awareness, and advanced technology practices. It builds the case for Experian’s unique ability to capture evolving market opportunities.
Brand strength, Talent, Innovation, Data accuracy, Technology, Market leadership, NPS, Client engagement
false
Strategic Planning
Technology & Software technology-and-software
Mixed Chart
Barclays
View slide
Column chart showing the increasing percentage of brands willing to engage with politically charged issues from February 2020 to September 2022. Insights discuss sector-specific willingness.
Customer and Market Segmentation
Professional Services
Highlights the growing trend of brands taking public stances on political issues, with data spanning over two years. It discusses sector-specific differences in brand engagement with political matters.
Branding, Politics, Engagement, Bar Chart, Trend Analysis, 2020-2022, Public Stance
false
Customer and Market Segmentation
Professional Services professional-services
Mixed Chart
Deloitte
View slide
Features images of VR, cars, and lifestyle, representing different aspects of a luxury brand's in-store experience tailored to customer interests.
Customer and Market Segmentation
Retail & E-commerce
Describes how luxury retail stores are transforming into epicenters of brand story-living, enhancing customer experience through personalized brand interactions.
Branding, Retail, Customer Experience
false
Customer and Market Segmentation
Retail & E-commerce retail-and-e-commerce
Framework
Bain
View slide
This slide contains two sections. The left side depicts the Consumer Price Index and exchange rate trends using dual line graphs, and the right side shows the Bovespa index performance with a single line graph. The layout is data-focused with a visual breakdown of each financial metric.
Financial Performance
Financial Services
This slide examines Brazil's economic metrics with a focus on inflation, currency exchange rates, and stock market performance. It provides investors and financial analysts with a visual representation of market conditions and currency value fluctuations, informing potential investment and market strategy decisions.
Brazil, Inflation, Exchange Rate, Bovespa, Market Analysis
false
Financial Performance
Financial Services financial-services
Multiple Chart
McKinsey
View slide
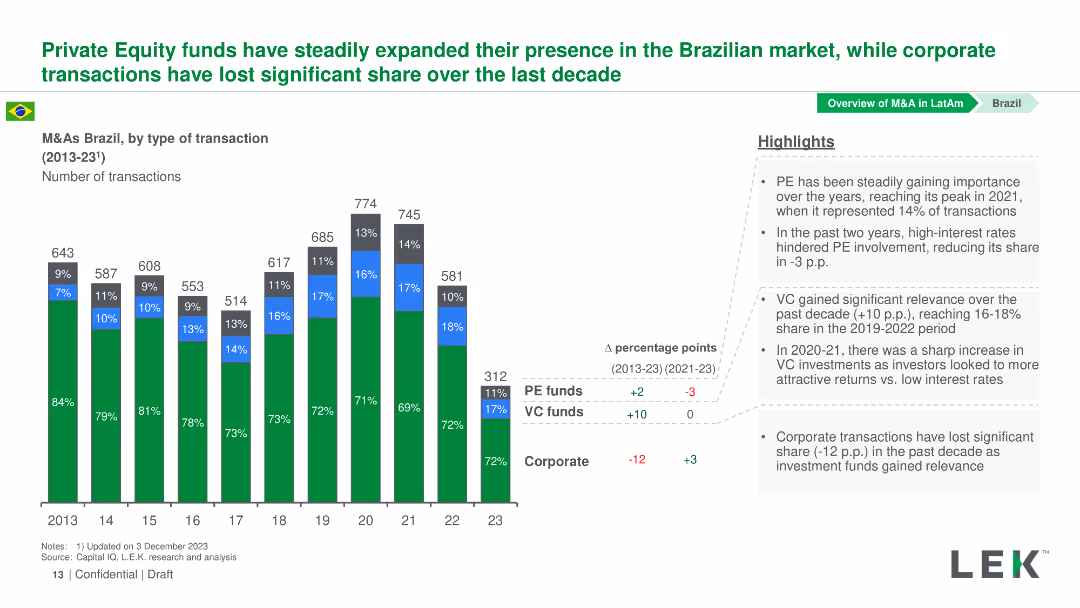
Column chart showing the number of transactions by type in Brazil from 2013-2023. The chart differentiates PE funds, VC funds, and Corporate transactions by color.
Market Analysis and Trends
Financial Services
This slide analyzes the trend of PE, VC, and Corporate transactions in Brazil from 2013-2023, highlighting the growth in PE and VC transactions over the years.
Brazil, M&A, Private Equity, Venture Capital, Corporate Transactions
false
Market Analysis and Trends
Financial Services financial-services
Mixed Chart
LEK
View slide
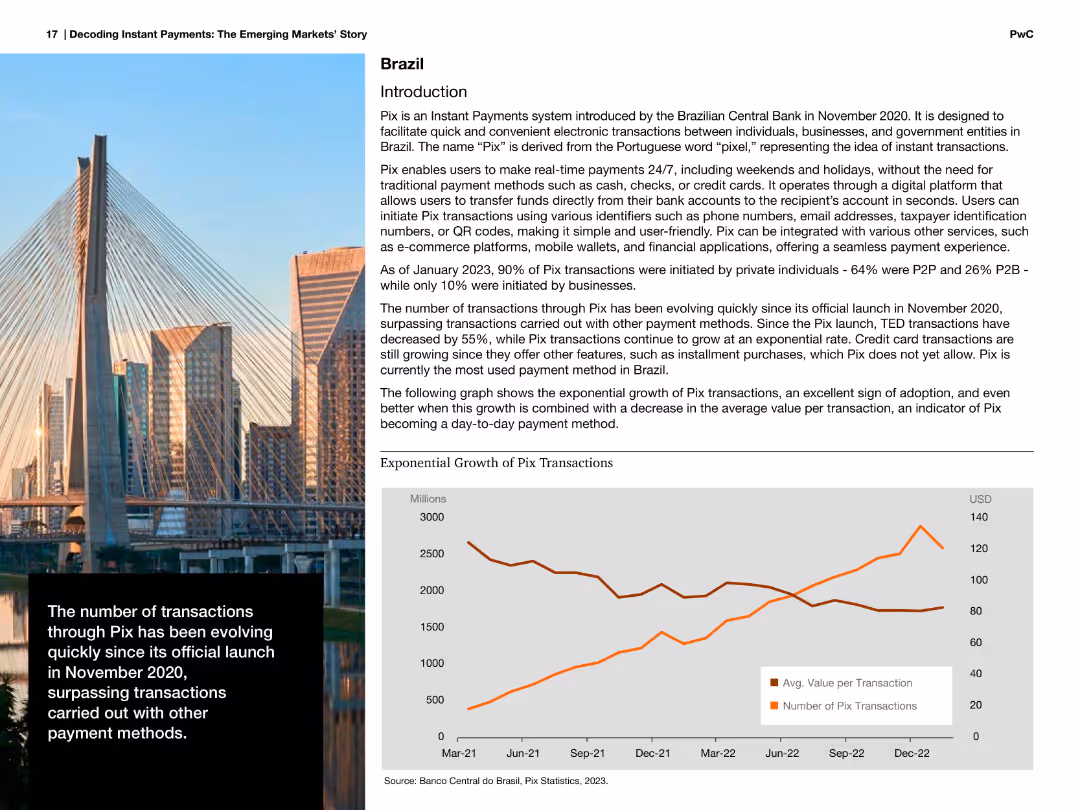
Image of a bridge with accompanying text about Pix, Brazil's instant payment system, and a line chart showing exponential growth of Pix transactions.
Market Analysis and Trends
Financial Services
Describes the exponential growth of Pix transactions in Brazil since its launch, highlighting its adoption and impact on other payment methods.
Brazil, Pix, payments, instant, growth, transactions, financial, services, exponential
false
Market Analysis and Trends
Financial Services financial-services
Mixed Chart
PwC/Strategy&
Previous
Loading...
Hold On!
We are searching in our database
If nothing, comes up, please try different filters!
Column Chart
Heatmap
Chevron
Org Chart
Infographic
Callouts
Timeline
List
Graphic
Picture
Process Flow
Diagram
Paragraph
Map
Table
Framework
Subtitle
Takeaway Box
Icon
Other Chart
Radar Chart
Waterfall Chart
Mekko Chart
Pie Chart
Scatter Plot
Line Chart
Bar chart
Bullet points
Create a FREE account to continue browsing
Receive Instant Access to 1,000+ slides from companies like McKinsey, Google, and Goldman Sachs
First Name
Last Name
Email
Password
I agree to all
Terms & Privacy Policy
Thank you! Your submission has been received!
Oops! Something went wrong while submitting the form.
Have an account?
Sign in
Upgrade to PRO to Save slides
Advanced Search and Filters
Access to 15,000+ slides
Access to Category Pages
Save/Bookmark Slides
PowerPoint Template Library
Pick a Plan
MONTHLY
$12/month
Billed every month, Cancel anytime.
YEARLY
$9/year
Billed $108 annually, Cancel anytime.
Checkout for $12/month
Checkout for $108/yr
Secured by Stripe | AES-256 bit encryption