My Account
My Slides
Search by Category
Templates
View All Templates
Download Template Slides
Leave Feedback
Login
Logout
Get Started
Browse all Slides
Browse all Slides
Create a FREE Account
Instant access to 1,000+ real slides from top companies like McKinsey, BCG, Goldman Sachs, Google and many more!
First Name
Last Name
Email
Password
I agree to all
Terms & Privacy Policy
Thank you! Your submission has been received!
Oops! Something went wrong while submitting the form.
Have an account?
Sign in
Spark Your Next Big Idea with New Presentation Templates
VIEW ALL Templates
Welcome,
Welcome
PRO
Show Featured Only
Checkbox 8
Companies
Mckinsey
Bain
BCG
EY
Deloitte
Accenture
PwC/Strategy&
JP Morgan
Goldman Sachs
Morgan Stanley
Citigroup
Deutsche Bank
Barclays
LEK
KPMG
Kearney
Oliver Wyman
Booz Allen Hamilton
Gartner
IPSOS
Nielsen
Slide type
Text Only
Linear Flow
Vertical Flow
Single Chart
Header Horizontal
Mixed Chart
Header Vertical
Pillar
Multiple Chart
Graphic
Agenda
Title
Table
Framework
Industry
Technology & Software
Artificial Intelligence
Financial Services
Retail & E-commerce
Consumer Goods
Industrial & Manufacturing
Transportation & Logistics
Telecommunications
Real Estate & Construction
Hospitality & Tourism
Professional Services
Education & Training
Media & Entertainment
Agriculture & Food Production
Healthcare & Pharmaceuticals
Environmental Services & Sustainability
Government & Public Sector
Use Case
Mergers and Acquisitions
Performance Metrics and KPIs
Client Case Studies
Competitive Landscape
Corporate Finance and Valuation
Product and Service Analysis
Customer and Market Segmentation
Organizational Structure and Change
Industry Overview
Regulatory and Compliance
Risk Assessment and Management
Investment Analysis
Organizational Structure and Change
Human Resources and Talent Management
Financial Performance
Market Analysis and Trends
Sales and Business Development
Human Resources and Talent Management
Clear all
Thank you! Your submission has been received!
Oops! Something went wrong while submitting the form.
Tag
View slide
The slide is split into two main sections, left featuring a list of elements in a global operating model, right showing the benefits with logos of partnerships. Blue and red are predominant colors.
Strategic Planning
Financial Services
Describes the dual structure of a business model delivering globally and managing locally, alongside benefits of global leverage, highlighting partnerships and value propositions.
Business Model, Global, Local, Partnerships, Leverage, Scale, Marketing, Client Service, Citigold
false
Strategic Planning
Financial Services financial-services
Header Horizontal
Citigroup
View slide
Comparative pie charts showing revenue mix of UBS versus North American and European GSIB averages, highlighting different business segments.
Strategic Planning
Financial Services
Compares UBS's business model and revenue mix with North American and European GSIB averages, emphasizing unique global asset gathering.
Business Model, Revenue Mix, UBS, GSIB, Comparison
false
Strategic Planning
Financial Services financial-services
Multiple Chart
UBS
View slide
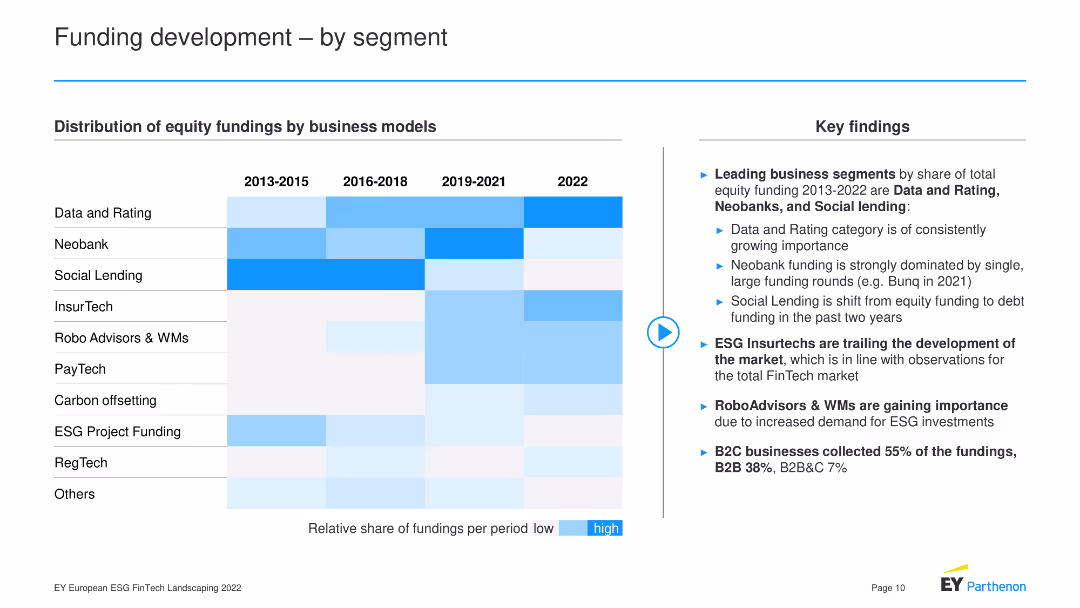
A heatmap chart displaying distribution of equity fundings by business models over different periods.
Market Analysis and Trends
Financial Services
The slide illustrates the distribution of equity fundings across various business models from 2013 to 2022, noting leading segments like Data and Rating, Neobank, and Social Lending, with insights into the growth trends and shifts in ESG investments, RoboAdvisors, and B2C business funding.
Business Models, Equity Funding, Segments, Trends
false
Market Analysis and Trends
Financial Services financial-services
Header Horizontal
EY
View slide
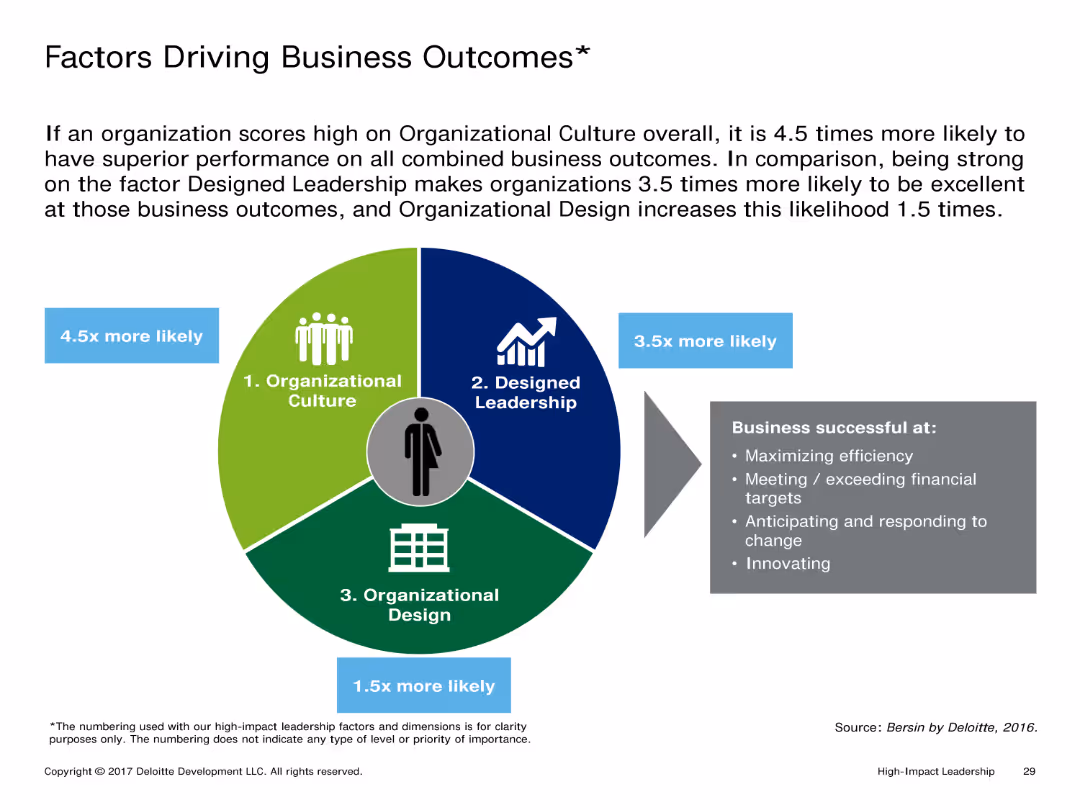
The slide includes a circular diagram divided into three segments representing Organizational Culture, Designed Leadership, and Organizational Design. Each segment lists factors that drive business outcomes.
Market Analysis and Trends
Professional Services
It presents the relationship between high scores in Organizational Culture, Designed Leadership, and Organizational Design, and superior business outcomes. The slide emphasizes the likelihood of business success based on these factors.
Business Outcomes, Organizational Culture, Leadership, Design, Performance
false
Market Analysis and Trends
Professional Services professional-services
Diagram
Deloitte
View slide
The slide presents a composite of bar charts and a list, comparing data between the years 2023 and 2024 in terms of business leaders' expectations for revenue, profits, and headcount. It also shows business planning priorities in a vertical list layout. The graphical elements are well organized, using color differentiation for each year.
Strategic Planning
Financial Services
This analytical slide illustrates the optimistic projections for 2024 by business leaders, with a focus on revenue, profits, headcount, and strategic planning. It provides valuable insights for companies preparing for the year ahead and serves as a tool for strategic business planning, indicating areas of expected growth and potential changes in operational focus.
Business Outlook, Revenue Growth, Profit Expectations, Strategic Planning, Operational Focus
false
Strategic Planning
Financial Services financial-services
Multiple Chart
JP Morgan
View slide
This slide has a minimal design with key achievements highlighted using blue boxes and descriptive text. It's separated into three sections, each showcasing different aspects of business strength and breadth, including graphics illustrating scale and multi-line business relationships.
Competitive Landscape
Financial Services
The slide highlights JPMorgan Chase & Co.'s strong position in various business domains, emphasizing its scale and offering breadth. It likely serves to assert the company's competitive advantage and market leadership to stakeholders or in competitive analysis briefings.
Business Positions, Scale, Offerings, Market Leadership, Competitive Advantage, JPMorgan Chase & Co., Stakeholders
false
Competitive Landscape
Financial Services financial-services
Header Horizontal
JP Morgan
View slide
The slide contains three key strategy blocks with associated actions, displayed in a columnar format. The content is supported by performance metrics, depicted in a clear and structured manner.
Strategic Planning
Financial Services
Outlining strategies for sustained business success, the slide discusses expanding the card member base, engaging through experiences, and creating deeper customer relationships, accompanied by goals and performance indicators.
Business Strategy, Card Members, Customer Engagement, Relationship Building, Performance Metrics
false
Strategic Planning
Financial Services financial-services
Table
JP Morgan
View slide
Consists of a column chart showcasing planned growth strategies and a pie chart detailing ownership transition plans, set against a clear, textual backdrop.
Strategic Planning
Technology & Software
Presents strategic initiatives and ownership transition plans as pivotal components of business strategy, highlighting the directional shifts businesses may undertake to foster growth.
Business Strategy, Growth, Transition, Planning
false
Strategic Planning
Technology & Software technology-and-software
Multiple Chart
JP Morgan
View slide
The slide utilizes a circular diagram and supporting text to depict the company's investment in relationships, people, and innovation.
Strategic Planning
Financial Services
Explores the strategic investment in business relationships, workforce development, and innovative processes for growth.
Business Strategy, Relationships, People, Execution, Innovation, Diagram, Investment, Growth
false
Strategic Planning
Financial Services financial-services
Framework
JP Morgan
View slide
The slide features a diagonal line dividing it into four segments, each labeled as Turnaround, Fund, Grow, Transform, with icons and brief descriptions.
Strategic Planning
Professional Services
The slide presents a strategic shift from a save-to-grow to a save-to-transform approach in business, emphasizing different strategic phases like Turnaround, Fund, Grow, and Transform with concise definitions and implications for business strategy.
Business Strategy, Transformation, Growth, Cost Management, Stability
false
Strategic Planning
Professional Services professional-services
Vertical Flow
Deloitte
View slide
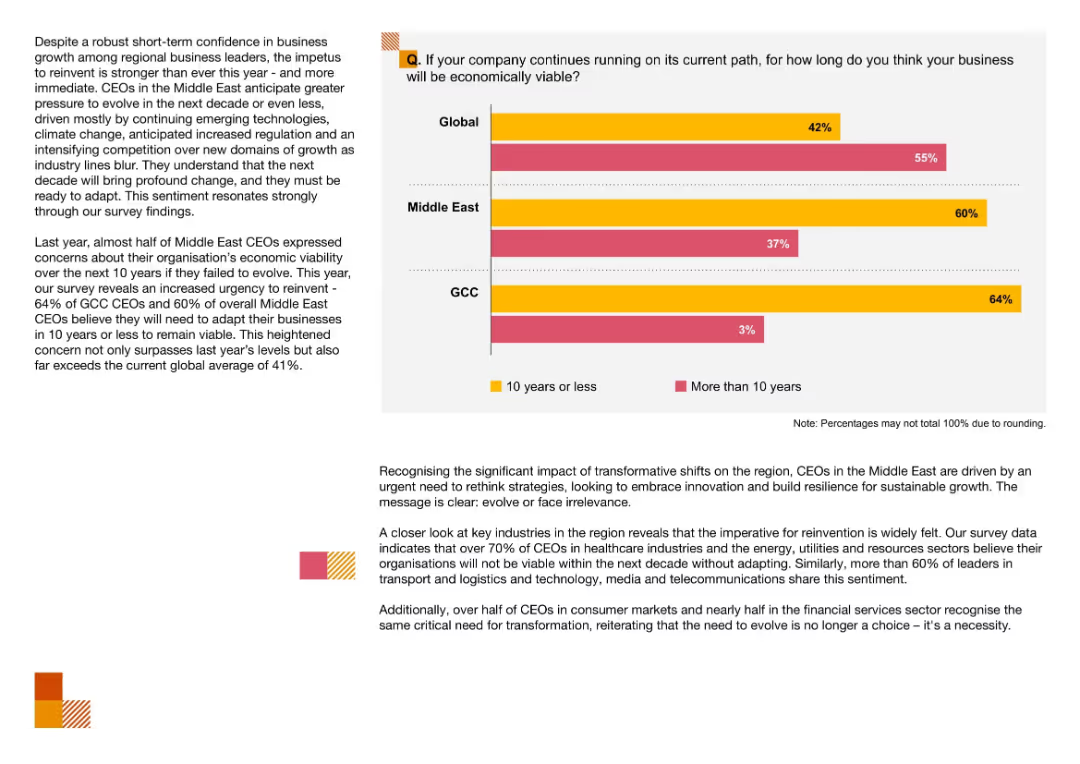
Horizontal bar chart for Global, Middle East, and GCC comparing viability for 10 years or less vs. more than 10 years; surrounded by analysis and trend interpretation
Strategic Planning
Financial Services
This slide highlights growing urgency among Middle East and GCC CEOs to evolve or risk economic irrelevance, with over 60% anticipating their business models must adapt within 10 years to remain viable.
Business Viability, Strategic Planning, Reinvention, Middle East, GCC, CEO Concerns, Economic Risk
false
Strategic Planning
Financial Services financial-services
Mixed Chart
PwC/Strategy&
View slide
The slide contains a series of column charts with detailed annotations and data highlights. It uses shades of blue and text callouts to emphasize key growth metrics.
Financial Performance
Financial Services
The slide evaluates the significant growth of Chase's business sector over time, focusing on client numbers and economic contributions, emphasizing the strong economics of customer relationships. It's intended for financial performance reviews and strategic planning.
Business growth, Chase, Client numbers, Economics, Performance review, Strategy, Financial contributions, Economic metrics
false
Financial Performance
Financial Services financial-services
Single Chart
JP Morgan
View slide
Before-and-after comparison with two columns contrasting past and current business models. Lists key aspects with numbers and uses blue color highlights.
Organizational Structure and Change
Financial Services
Explains the shift in Morgan Stanley's business model, highlighting increased scale, added channels, and expanded service models.
Business model, scale increase, service expansion, channels, Morgan Stanley, organizational change, evolution
false
Organizational Structure and Change
Financial Services financial-services
Table
Goldman Sachs
View slide
Slide features column charts depicting adjustments in operating profits across several business units. It includes green, red, and blue bars, some with growth indicators, and integrates real-world imagery of a building's balcony.
Financial Performance
Real Estate & Construction
Analyzes adjusted operating profit by business segment for Q1 2020 compared to Q1 2021, highlighting changes and trends in the real estate and construction industry.
Business premises, operating profit, real estate, financial analysis, construction
false
Financial Performance
Real Estate & Construction real-estate-and-construction
Single Chart
Goldman Sachs
View slide
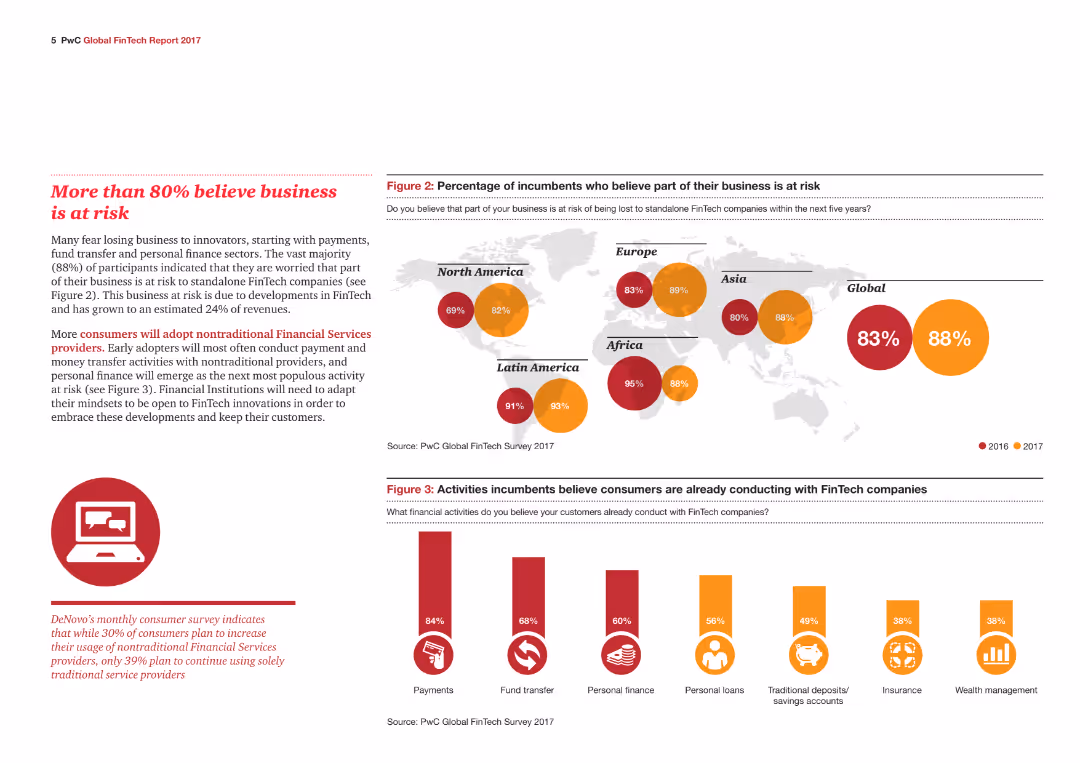
A world map highlighting regions' beliefs about business risks with percentages and a column chart showing incumbents' views on FinTech-related risks and activities.
Risk Assessment and Management
Financial Services
The slide highlights global concerns about business risks due to FinTech, supported by geographical data and incumbents' perceptions of risk.
Business risk, FinTech, Global, Incumbents, Perceptions, Activities, Concerns, Technology, Regions, Financial services
false
Risk Assessment and Management
Financial Services financial-services
Multiple Chart
PwC/Strategy&
View slide
Features a diagram showing three phases of business model transformation over time, labeled "Explore & Shape," "Attract & Win," and "Scale Fast & Keep Growing."
Strategic Planning
Environmental Services & Sustainability
This slide outlines a three-phase process for transitioning to a new business model focused on sustainability and circular economy principles. Useful for strategic planning sessions focusing on long-term business transformations towards sustainability.
Business transformation, Sustainability, Circular economy, Strategic planning, Phases, New business model, Growth, Scalability, Partnership development, Innovation
false
Strategic Planning
Environmental Services & Sustainability environmental-services-and-sustainability
Linear Flow
Accenture
View slide
Horizontal phase timeline with four sections marked by year ranges, showing evolution of Morgan Stanley's business. Each phase includes a brief descriptor and financial figures. Predominant use of blue and white color scheme.
Strategic Planning
Financial Services
Shows the strategic transformation of Morgan Stanley's wealth management over different phases marked by key milestones.
Business transformation, wealth management, strategic phases, Morgan Stanley, growth, technology integration
false
Strategic Planning
Financial Services financial-services
Linear Flow
Goldman Sachs
View slide
This slide features a pie chart and a bar chart. The pie chart displays preferences for business travel levels post-COVID-19. The bar chart shows preferences for business travel processes.
Market Analysis and Trends
Professional Services
Describes employee preferences for business travel after COVID-19, including types of travel desired and preferences for internal and external travel events.
Business travel, Post-pandemic, Preferences, Internal travel, External events, Employee survey
false
Market Analysis and Trends
Professional Services professional-services
Multiple Chart
EY
View slide
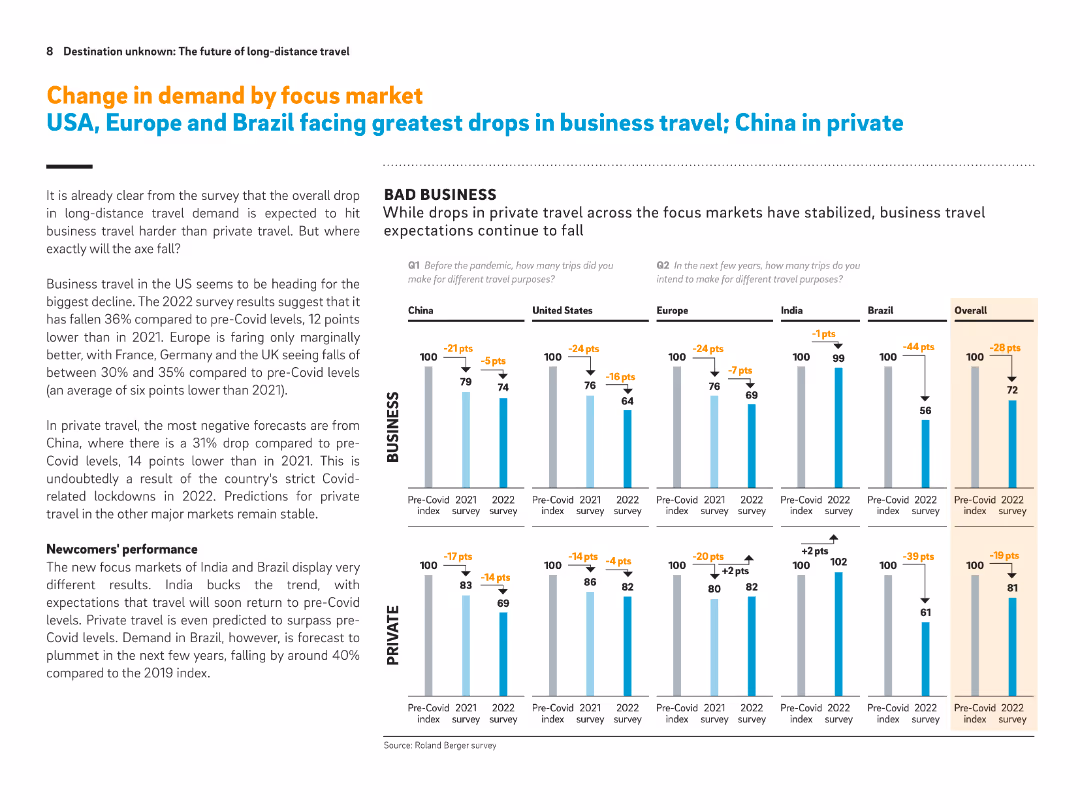
Multiple comparative bar charts for six regions (China, US, Europe, etc.). Focused on business vs. private travel drops.
Market Analysis and Trends
Transportation & Logistics
Business travel demand is falling across all markets, with the US and Brazil showing the steepest declines. Private travel is somewhat more stable, though China shows the largest drop in this category. India and Europe show resilience or improvement.
Business travel, private travel, regional differences, post-Covid demand, long-distance travel, China, Brazil, US, India
false
Market Analysis and Trends
Transportation & Logistics transportation-and-logistics
Multiple Chart
Roland Berger
View slide
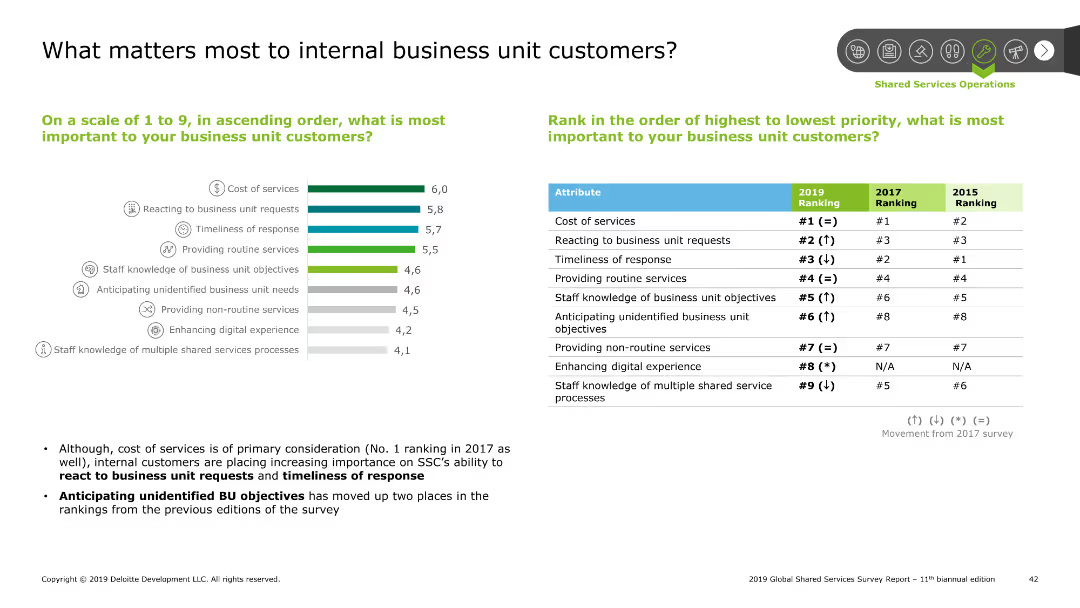
The slide features a combination of a column chart and a table. The column chart ranks importance factors for business unit customers, and the table shows rankings by year.
Customer and Market Segmentation
Professional Services
This slide identifies and ranks the factors most important to internal business unit customers, including cost of services and responsiveness, based on survey results.
Business unit customers, importance factors, ranking, survey
false
Customer and Market Segmentation
Professional Services professional-services
Mixed Chart
Deloitte
View slide
The slide features multiple visualizations, including a line graph for daily exceptions, a pie chart for open exceptions per department, and various data tables showing exceptions by category and aging analysis.
Operational Efficiency
Energy & Utilities
The slide provides insights into managing business exceptions, displaying data on daily exceptions, departmental exceptions, and aging analysis of open exceptions, helping in operational decision-making.
Business, Exceptions, Management, Analysis, Operational
false
Operational Efficiency
Energy & Utilities energy-and-utilities
Multiple Chart
EY
View slide
The slide includes icons on top of headers, describing major business and economic changes due to external factors.
Strategic Planning
Professional Services
Outlines various forces like metamorphosis of demand and altered workforce, impacting business strategies and operational resilience, with a focus on adapting to post-COVID realities.
Business, Strategy, COVID-19, Resilience, Adaptation
false
Strategic Planning
Professional Services professional-services
Pillar
McKinsey
View slide
The slide includes a line chart with a single dark blue line representing the price of Butadiene in Europe from 2016 to 2023. The design is straightforward with vertical gridlines and a clear indication of the time scale.
Market Analysis and Trends
Industrial & Manufacturing
Presenting the historical price data for Butadiene in Europe, this line chart is likely used to analyze the impact of raw material costs on production or to forecast future price movements. It could be particularly relevant to companies in the synthetic rubber or plastics manufacturing sectors.
Butadiene, price history, Europe, line chart
false
Market Analysis and Trends
Industrial & Manufacturing industrial-and-manufacturing
Single Chart
Morgan Stanley
View slide
A bubble chart similar to the previous slide but focused on 'Buy' versus 'Build' strategies. It compares the CARG and growth rates of various IT services, with bubbles sized by market impact.
Strategic Planning
Technology & Software
The slide compares the 'Buy' and 'Build' approaches in IT services, showing growth trends and CARG for different service categories, helping organizations decide on strategic investment directions.
Buy vs Build, IT Services, Growth Rates, Strategic Planning, Market Impact
false
Strategic Planning
Technology & Software technology-and-software
Single Chart
Gartner
View slide
A quadrant scatter plot categorizes technologies and services based on their market positioning before and after signing contracts. Dots represent companies; color indicates service or goods focus.
Risk Assessment and Management
Technology & Software
Evaluates the challenges in purchasing services versus goods, illustrating the technology landscape's division into pre and post-contract signing phases, focusing on areas like risk and contract management.
Buying, Services, Challenges, Technology, Market
false
Risk Assessment and Management
Technology & Software technology-and-software
Single Chart
Kearney
View slide
The slide presents a bar chart titled "Distribution of buyout funds closed by fundraising success, time and target achievement", comparing percentages from 2017 to 2022 with various shades of gray indicating the time taken to close funds and whether they met their targets.
Investment Analysis
Financial Services
Analyzes the real success rate of buyout funds closing relative to targets and timeframes, valuable for investors' expectations and market realities' assessment.
Buyout Funds, Fundraising Success, Targets, Timeframes, Investment, Market Reality
false
Investment Analysis
Financial Services financial-services
Single Chart
Bain
View slide
A bar chart with overlaid line graph titled "Global buyout fund capital contributions and distributions". It contrasts contributions and distributions from 2005 to Q3 22, with a red line indicating net cash flows. There's a notable shift towards negative net cash flows in the recent quarter.
Investment Analysis
Financial Services
Highlights the trends in capital contributions versus distributions to Limited Partners (LPs) in global buyout funds, key for analyzing fund performance, investor returns, and market health.
Buyout Funds, LPs, Capital Contributions, Distributions, Cash Flows, Fund Performance
false
Investment Analysis
Financial Services financial-services
Single Chart
Bain
View slide
This slide presents a bar chart titled "Global buyout-backed exit value", showing a downward trend in exits via IPOs, and Sponsor to Sponsor or Strategic channels. The years span from 2005 to 2022, with a significant drop marked in red for 2022 at "$565B".
Market Analysis and Trends
Financial Services
This slide portrays a sharp decrease in the value of buyout-backed exits, crucial for discussing the implications on return strategies and the broader exit environment within the private equity sector.
Buyout-Backed Exits, IPO, Decrease, Strategic Exits, Private Equity, Valuation, Trend Analysis
false
Market Analysis and Trends
Financial Services financial-services
Multiple Chart
Bain
View slide
The slide is a comparative design with charts and visual elements. It features a timeline with circular nodes representing different business goals and strategies, icons symbolizing actions, and two large numerical statistics with accompanying text labels.
Strategic Planning
Financial Services
Discusses the growth opportunities and strategies for client acquisition and relationship management in the C&I franchise of JPMorgan Chase & Co. Utilizes numerical data and a process flow timeline to present expansion plans and customer relationship deepening methods.
C&I franchise, growth, acquisition, clients, relationships, strategy, JPMorgan Chase
false
Strategic Planning
Financial Services financial-services
Linear Flow
JP Morgan
View slide
Features a pie chart depicting the C&I portfolio by industry and a line chart comparing the C&I net charge-off rate against the industry average, along with commentary on market conditions.
Risk Assessment and Management
Financial Services
Evaluates the C&I loan portfolio's risk discipline, focusing on diversified industry spread and underwriting quality, paired with market trend observations and net charge-off rates.
C&I, loan portfolio, risk management, JPMC, industry diversification, charge-off rates, market trends, underwriting quality
false
Risk Assessment and Management
Financial Services financial-services
Multiple Chart
JP Morgan
Previous
Loading...
Hold On!
We are searching in our database
If nothing, comes up, please try different filters!
Column Chart
Heatmap
Chevron
Org Chart
Infographic
Callouts
Timeline
List
Graphic
Picture
Process Flow
Diagram
Paragraph
Map
Table
Framework
Subtitle
Takeaway Box
Icon
Other Chart
Radar Chart
Waterfall Chart
Mekko Chart
Pie Chart
Scatter Plot
Line Chart
Bar chart
Bullet points
Create a FREE account to continue browsing
Receive Instant Access to 1,000+ slides from companies like McKinsey, Google, and Goldman Sachs
First Name
Last Name
Email
Password
I agree to all
Terms & Privacy Policy
Thank you! Your submission has been received!
Oops! Something went wrong while submitting the form.
Have an account?
Sign in
Upgrade to PRO to Save slides
Advanced Search and Filters
Access to 15,000+ slides
Access to Category Pages
Save/Bookmark Slides
PowerPoint Template Library
Pick a Plan
MONTHLY
$12/month
Billed every month, Cancel anytime.
YEARLY
$9/year
Billed $108 annually, Cancel anytime.
Checkout for $12/month
Checkout for $108/yr
Secured by Stripe | AES-256 bit encryption