My Account
My Slides
Search by Category
Templates
View All Templates
Download Template Slides
Leave Feedback
Login
Logout
Get Started
Browse all Slides
Browse all Slides
Create a FREE Account
Instant access to 1,000+ real slides from top companies like McKinsey, BCG, Goldman Sachs, Google and many more!
First Name
Last Name
Email
Password
I agree to all
Terms & Privacy Policy
Thank you! Your submission has been received!
Oops! Something went wrong while submitting the form.
Have an account?
Sign in
Spark Your Next Big Idea with New Presentation Templates
VIEW ALL Templates
Welcome,
Welcome
PRO
Show Featured Only
Checkbox 8
Companies
Mckinsey
Bain
BCG
EY
Deloitte
Accenture
PwC/Strategy&
JP Morgan
Goldman Sachs
Morgan Stanley
Citigroup
Deutsche Bank
Barclays
LEK
KPMG
Kearney
Oliver Wyman
Booz Allen Hamilton
Gartner
IPSOS
Nielsen
Slide type
Text Only
Linear Flow
Vertical Flow
Single Chart
Header Horizontal
Mixed Chart
Header Vertical
Pillar
Multiple Chart
Graphic
Agenda
Title
Table
Framework
Industry
Technology & Software
Artificial Intelligence
Financial Services
Retail & E-commerce
Consumer Goods
Industrial & Manufacturing
Transportation & Logistics
Telecommunications
Real Estate & Construction
Hospitality & Tourism
Professional Services
Education & Training
Media & Entertainment
Agriculture & Food Production
Healthcare & Pharmaceuticals
Environmental Services & Sustainability
Government & Public Sector
Use Case
Mergers and Acquisitions
Performance Metrics and KPIs
Client Case Studies
Competitive Landscape
Corporate Finance and Valuation
Product and Service Analysis
Customer and Market Segmentation
Organizational Structure and Change
Industry Overview
Regulatory and Compliance
Risk Assessment and Management
Investment Analysis
Organizational Structure and Change
Human Resources and Talent Management
Financial Performance
Market Analysis and Trends
Sales and Business Development
Human Resources and Talent Management
Clear all
Thank you! Your submission has been received!
Oops! Something went wrong while submitting the form.
Tag
View slide
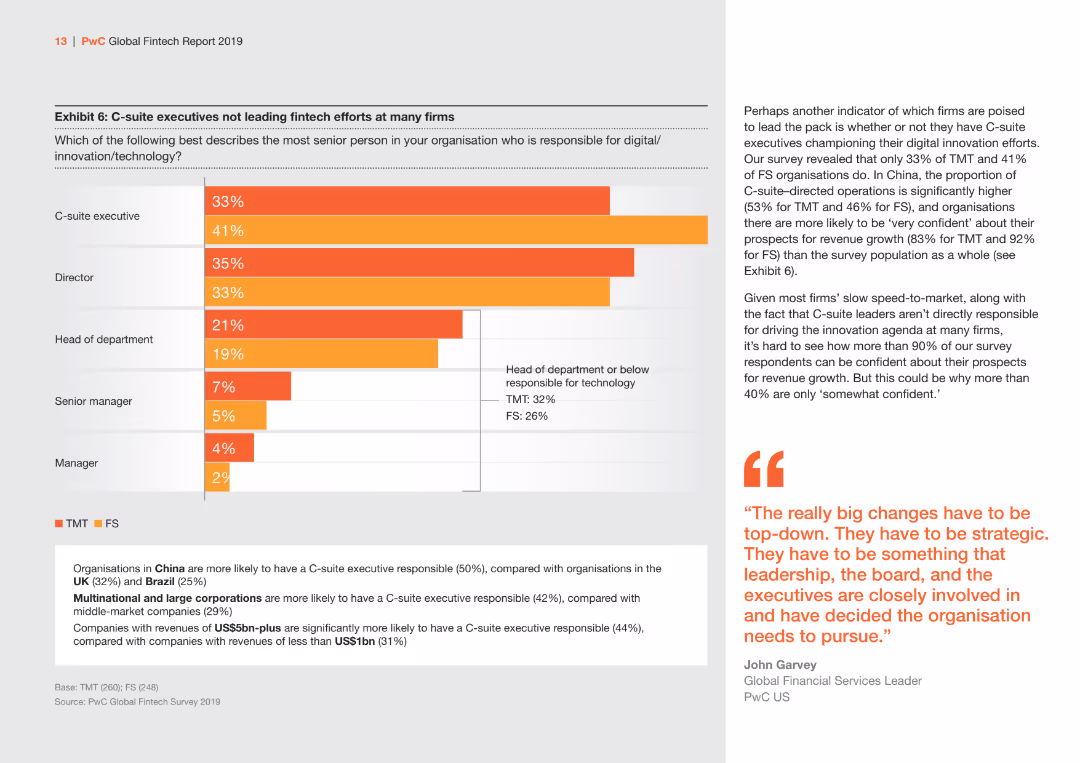
The slide features a bar chart displaying the distribution of responsibility for digital innovation/technology among different roles within organizations. Colors are orange and gray.
Strategic Planning
Financial Services
Highlights the distribution of responsibility for digital innovation/technology among C-suite executives, directors, and other roles, comparing TMT and FS sectors.
C-suite, digital innovation, TMT, FS, responsibility
false
Strategic Planning
Financial Services financial-services
Mixed Chart
PwC/Strategy&
View slide
Slide with comparative data in bar graph format, emphasizing regional differences in executive confidence and outlook for 2023, using green, red, and gray color scheme.
Market Analysis and Trends
Professional Services
Compares the optimism and confidence among C-suite leaders globally, highlighting regional variations and strategic concerns for 2023.
C-suite, optimism, strategy, 2023, global
false
Market Analysis and Trends
Professional Services professional-services
Multiple Chart
BCG
View slide
The slide has two pie charts illustrating the distribution of CA Directors reporting directly to the CEO versus those not on ExCo. It includes textual explanations and quotes in a two-column format with highlighted statements in blue.
Organizational Structure and Change
Professional Services
This slide explains the reporting structure of Corporate Affairs Directors, highlighting the role of Chief Officers and emphasizing the strategic importance of these positions within the company.
CA Directors, CEO reporting, Corporate Affairs, Governance, ExCo
false
Organizational Structure and Change
Professional Services professional-services
Multiple Chart
Deloitte
View slide
The slide includes line graphs comparing CAC vs CO2 emissions from electricity generation for FCEV and BEV under different scenarios.
Regulatory and Compliance
Energy & Utilities
The slide analyzes the carbon abatement cost and CO2 emissions for fuel cell electric vehicles and battery electric vehicles, considering the impact of grid emissions on savings.
CAC, CO2, FCEV, BEV, emissions, savings
false
Regulatory and Compliance
Energy & Utilities energy-and-utilities
Mixed Chart
Kearney
View slide
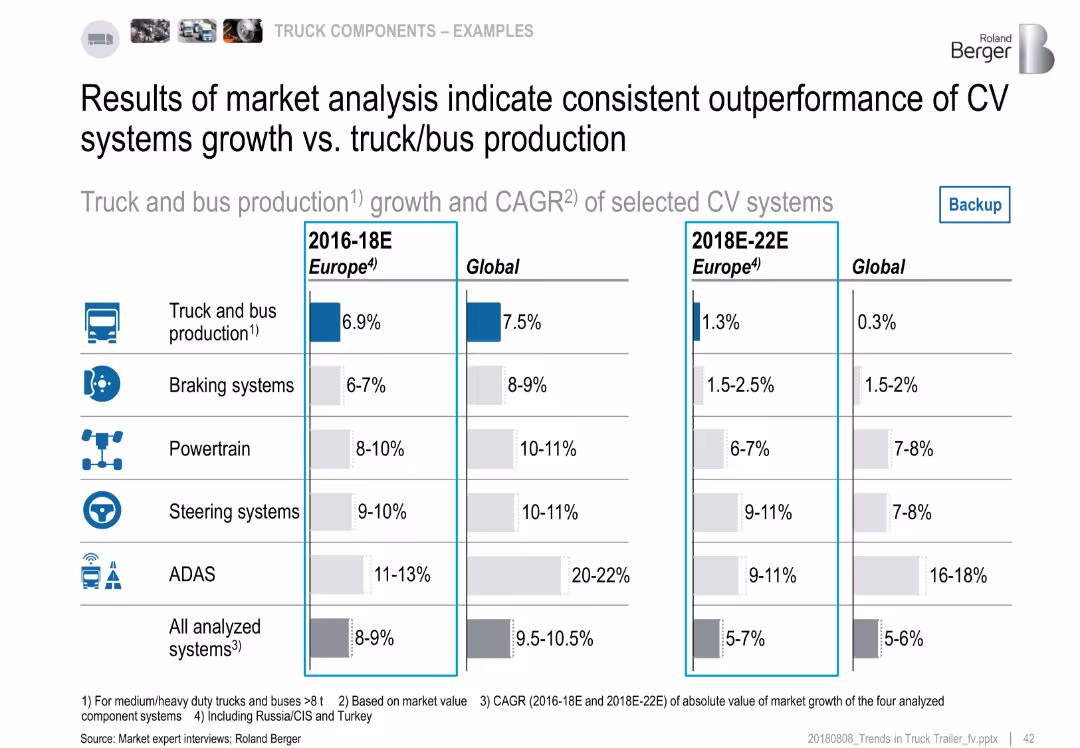
Split panel layout comparing CAGR (2016–18E and 2018E–22E) for Europe and Global in CV components and truck production
Market Analysis and Trends
Industrial & Manufacturing
This backup slide provides detailed CAGR estimates for two time periods, confirming that CV systems consistently outperform truck/bus production growth. ADAS shows the highest increase globally, while steering and powertrain components follow. The analysis is segmented by Europe and Global figures.
CAGR, CV growth, truck production, ADAS, Europe, global, forecasting
false
Market Analysis and Trends
Industrial & Manufacturing industrial-and-manufacturing
Multiple Chart
Roland Berger
View slide
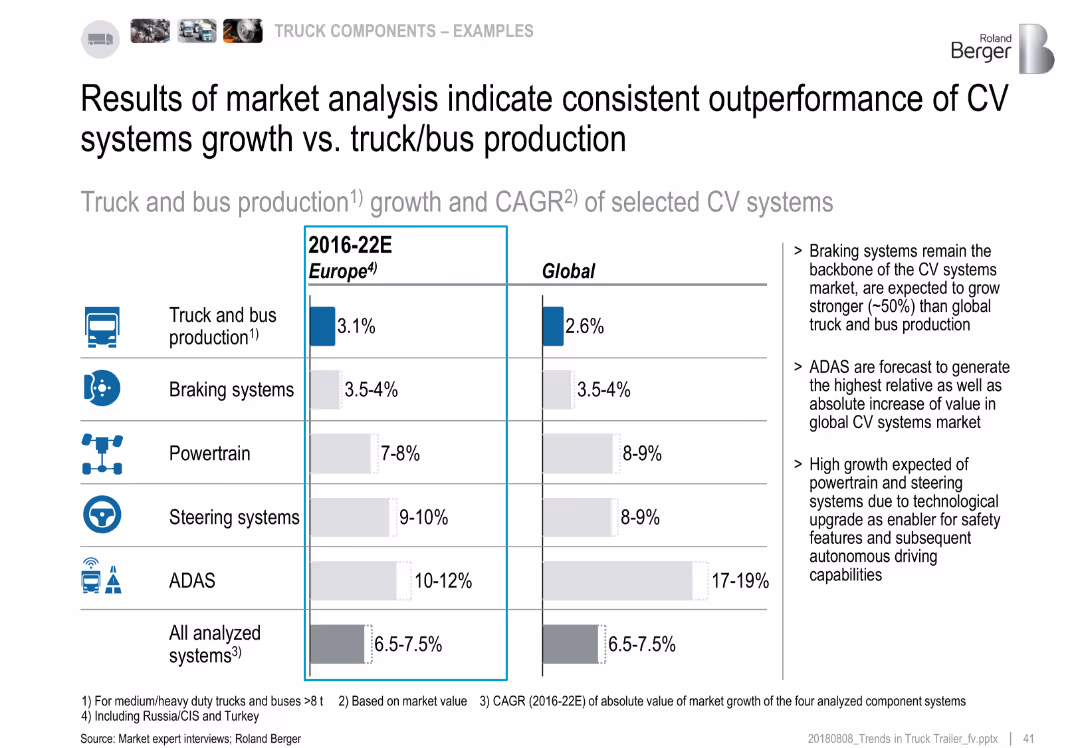
Comparative bar chart showing CAGR (2016–22E) for Europe and Global markets across truck production and CV systems
Market Analysis and Trends
Industrial & Manufacturing
The slide shows that CV system components (brakes, powertrain, steering, ADAS) are growing faster than truck and bus production globally and in Europe. ADAS leads in growth, followed by steering and powertrain. The insights point to technological innovation as a driver of value increase.
CAGR, CV systems, market growth, truck production, ADAS, Europe, global, steering
false
Market Analysis and Trends
Industrial & Manufacturing industrial-and-manufacturing
Multiple Chart
Roland Berger
View slide
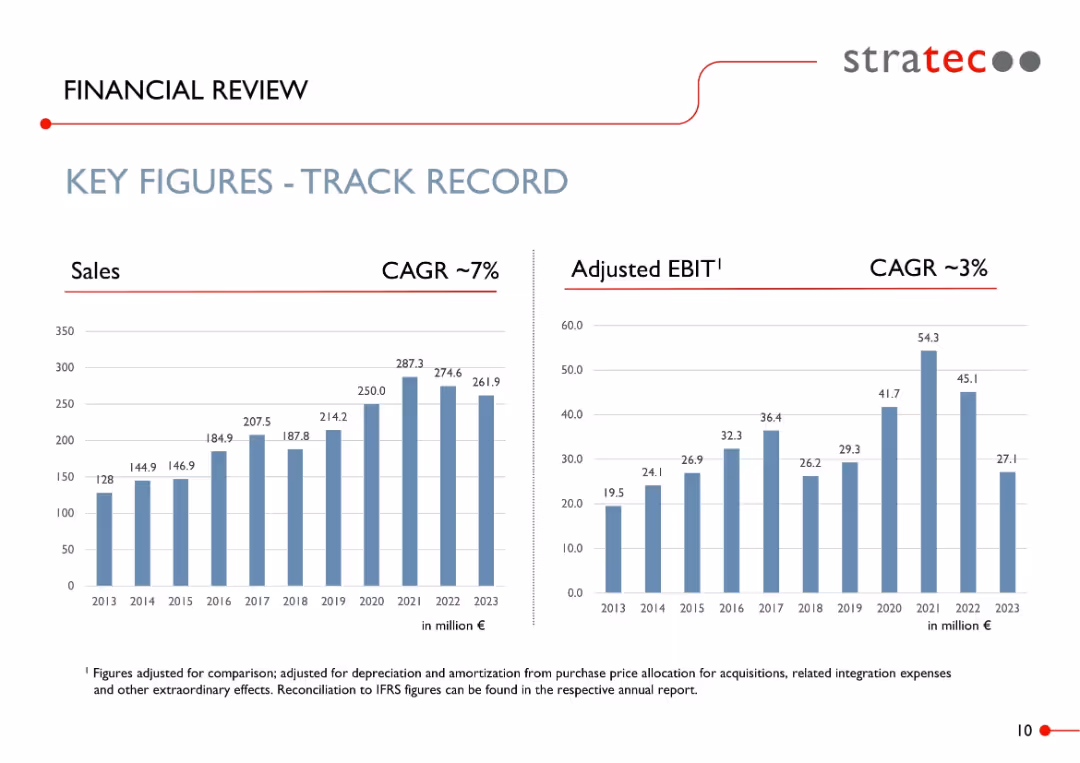
Two-panel bar chart layout: left for sales (CAGR ~7%), right for adjusted EBIT (CAGR ~3%); clean and minimalistic.
Financial Performance
Healthcare & Pharmaceuticals
Presents STRATEC’s historical performance from 2013–2023, showing steady growth in sales and a more modest increase in EBIT. CAGR highlights overall business expansion. Figures are adjusted for comparability and extraordinary effects.
CAGR, EBIT, sales growth, financial performance, diagnostics, STRATEC, revenue trend, adjusted figures
false
Financial Performance
Healthcare & Pharmaceuticals healthcare-and-pharmaceuticals
Multiple Chart
Goldman Sachs
View slide
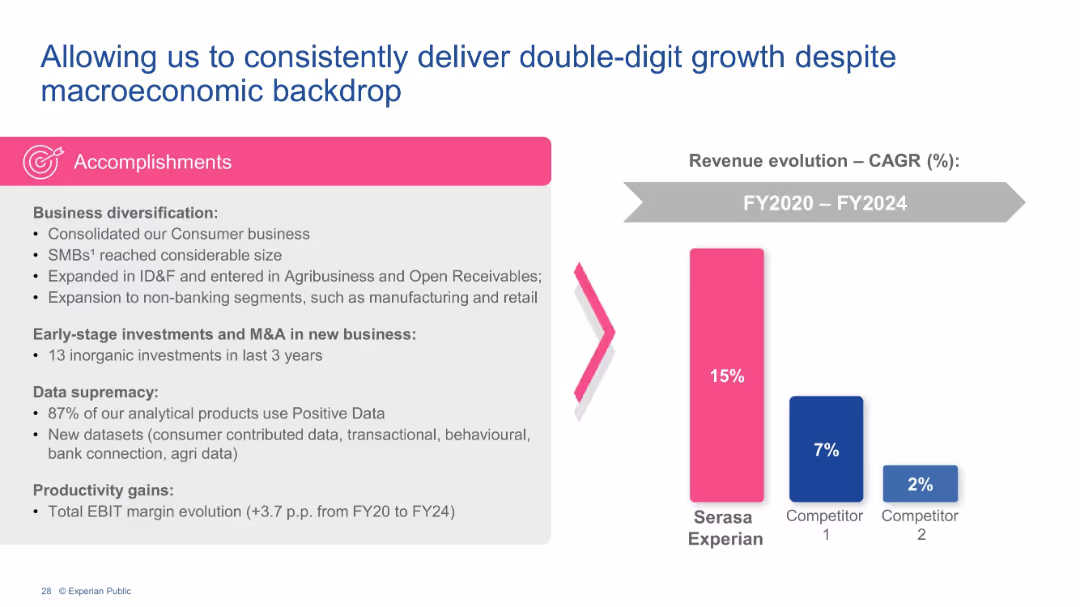
Two-column layout with business diversification text and a vertical bar chart comparing CAGR of Experian vs competitors.
Strategic Planning
Financial Services
Emphasizes Experian’s consistent double-digit revenue growth (15% CAGR FY20–FY24) versus competitors. Cites diversification, SMB growth, non-banking expansion, M&A, and use of Positive Data as key drivers.
CAGR, Experian, revenue growth, diversification, SMB, data analytics, M&A, macroeconomics
false
Strategic Planning
Financial Services financial-services
Mixed Chart
Barclays
View slide
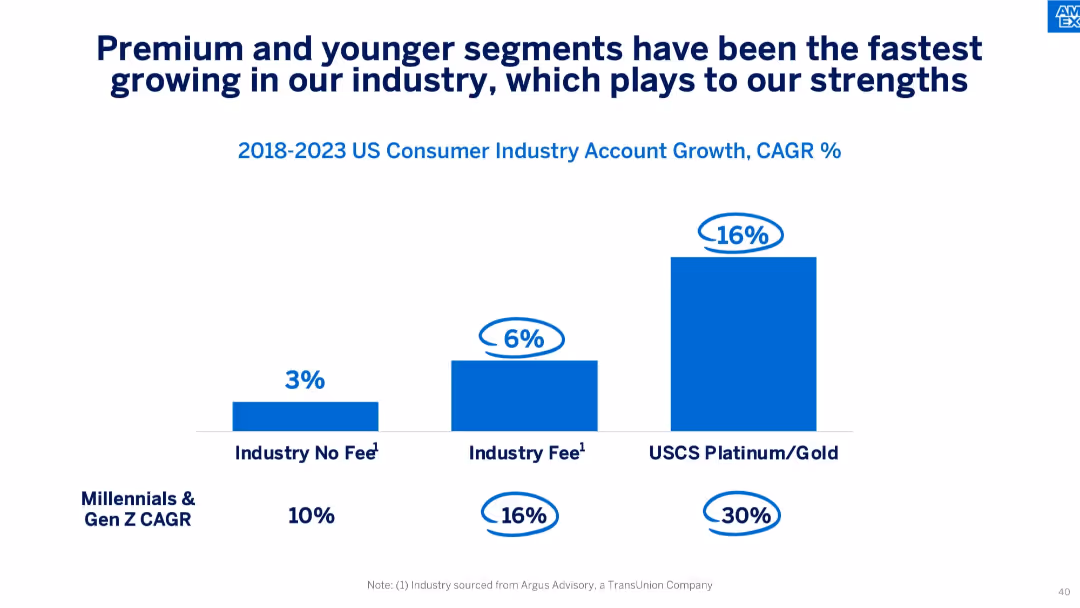
A clean slide with a large title at the top, a subtitle indicating data coverage, and a horizontal bar chart with three blue bars representing CAGR data for different segments. Emphasis is placed using circled growth percentages.
Market Analysis and Trends
Financial Services
This slide shows account growth from 2018 to 2023 across three consumer industry segments, highlighting faster growth in premium and younger segments like Millennials and Gen Z. It positions these trends as aligned with the company's strengths, especially in premium products.
CAGR, Millennials, Gen Z, Platinum/Gold, growth segments, premium, fee-based, account growth, US market, financial trends
false
Market Analysis and Trends
Financial Services financial-services
Single Chart
McKinsey
View slide
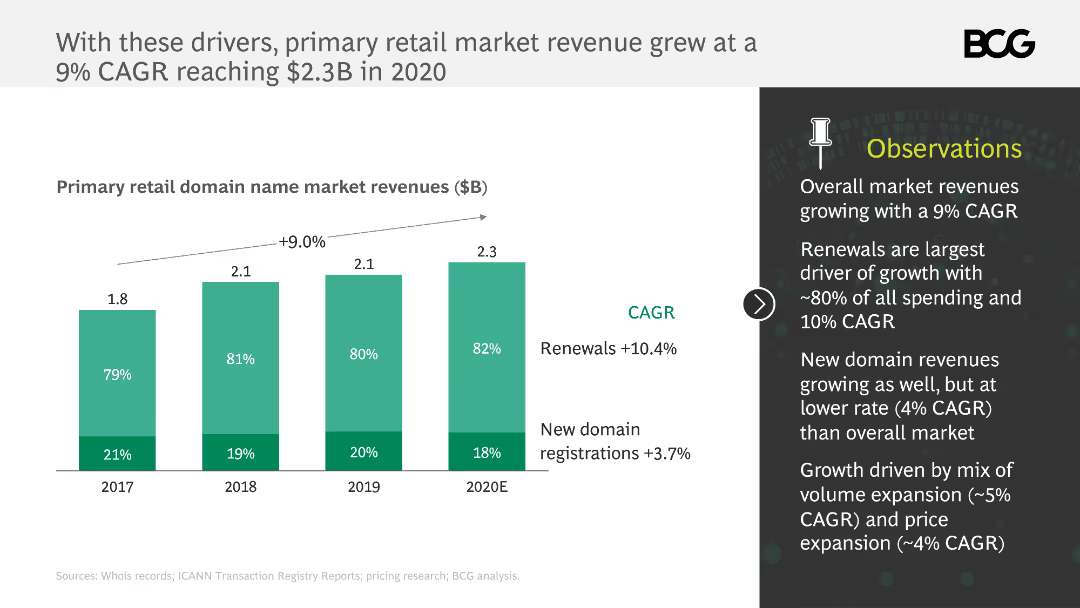
The slide contains a column chart depicting primary retail domain name market revenues from 2017 to 2020E, with a trend line showing a 9% CAGR. Observations are listed on the right.
Market Analysis and Trends
Retail & E-commerce
The slide highlights the growth in the primary retail market revenue, driven by renewals and new domain registrations. It explains the contribution of each factor to the overall market.
CAGR, domain, retail, revenue, renewals, growth, market
false
Market Analysis and Trends
Retail & E-commerce retail-and-e-commerce
Mixed Chart
BCG
View slide
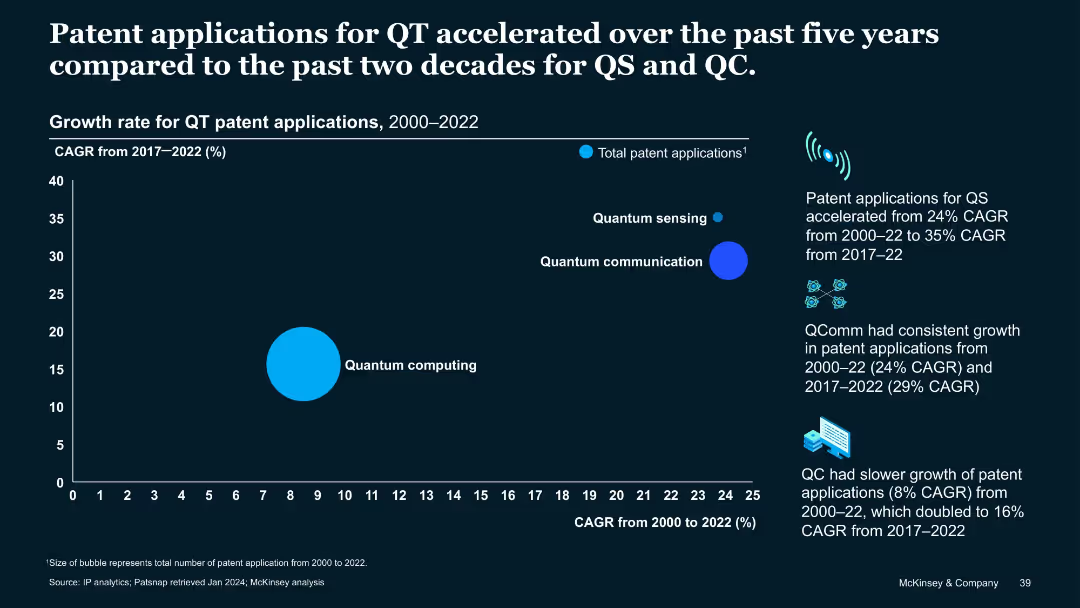
Bubble chart comparing CAGR of QT patent apps in QS, QC, QComm over 2000–2022 and 2017–2022 periods.
Performance Metrics and KPIs
Technology & Software
Visualizes how QT patent application growth accelerated from 2017–2022, especially in QS (35%) and QComm (29%). QC had slower historical growth but doubled in the last five years. Demonstrates growing momentum in quantum technology subfields.
CAGR, growth rate, quantum sensing, quantum communication, QC, patent growth, acceleration
false
Performance Metrics and KPIs
Technology & Software technology-and-software
Mixed Chart
McKinsey
View slide
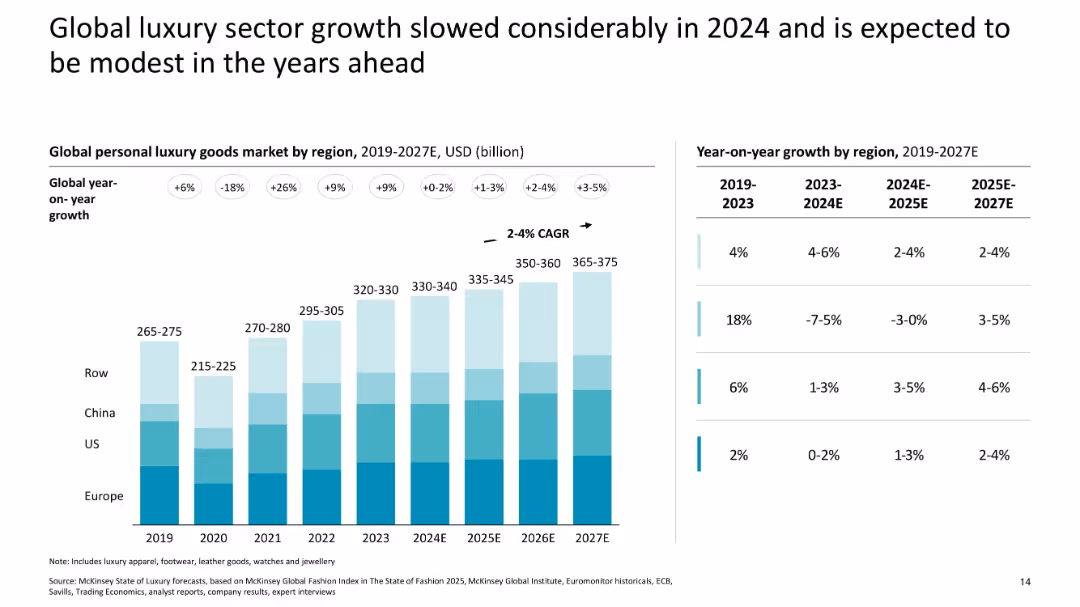
Stacked bar chart with YoY growth by region; table with forecasts
Market Analysis and Trends
Consumer Goods
This slide indicates a slowdown in global luxury growth for 2024 and modest projections through 2027, with significant regional variation, especially a dip and rebound in China.
CAGR, growth slowdown, forecast, China, US, Europe, market size, region
false
Market Analysis and Trends
Consumer Goods consumer-goods
Mixed Chart
McKinsey
View slide
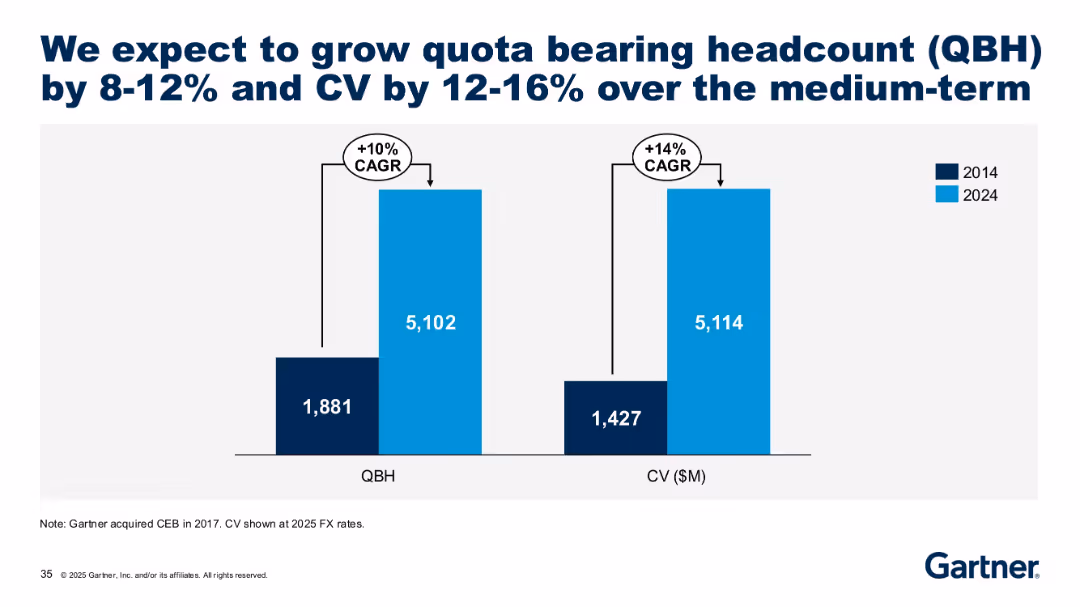
Two vertical bar charts comparing 2014 vs 2024 QBH and CV levels with CAGR bubbles.
Performance Metrics and KPIs
Professional Services
Gartner shows strong historical growth in quota-bearing headcount (QBH) and contract value (CV), with projected CAGRs of 10% and 14%, respectively, from 2014 to 2024. This indicates consistent expansion of its sales force and impact.
CAGR, headcount, CV growth, sales force, medium-term, 2024 projection, KPIs, performance, Gartner
false
Performance Metrics and KPIs
Professional Services professional-services
Single Chart
Gartner
View slide
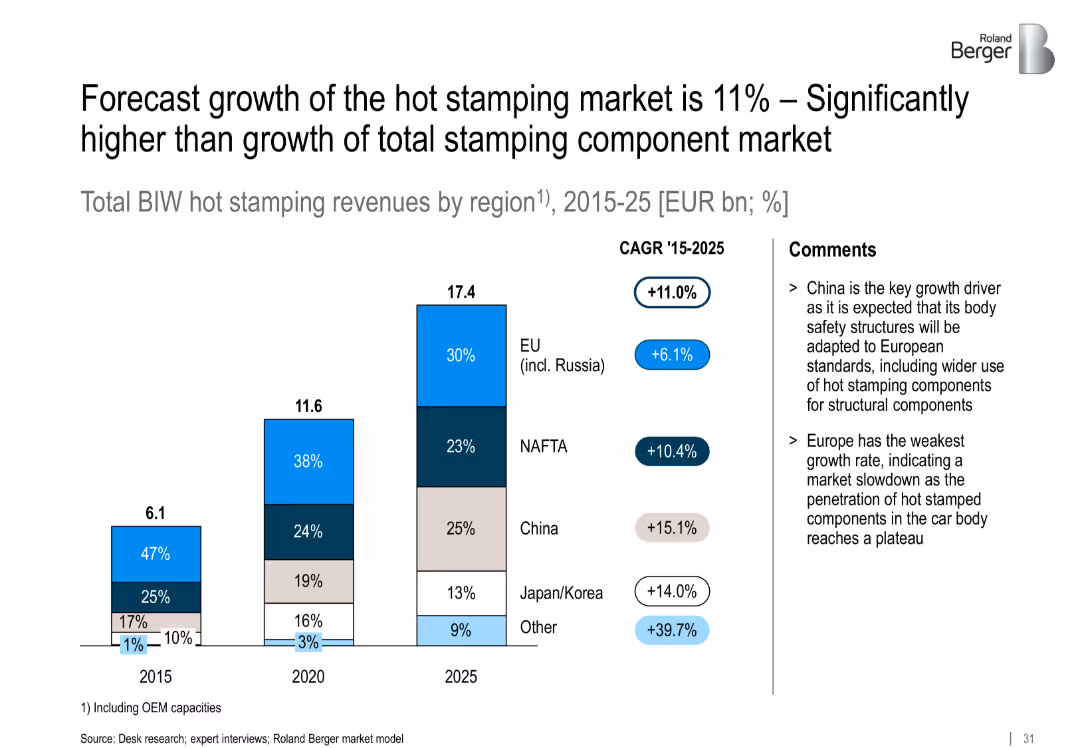
Stacked vertical bar charts (2015, 2020, 2025) comparing regional revenue contributions to hot stamping market. CAGR figures appear alongside a right-side comment box.
Market Analysis and Trends
Industrial & Manufacturing
This slide shows regional CAGR differences in hot stamping adoption. China and Other markets lead in growth, while Europe lags. Hot stamping is becoming essential in body safety designs globally.
CAGR, hot stamping, automotive regions, revenue growth, structural parts, OEM
false
Market Analysis and Trends
Industrial & Manufacturing industrial-and-manufacturing
Pillar
Roland Berger
View slide
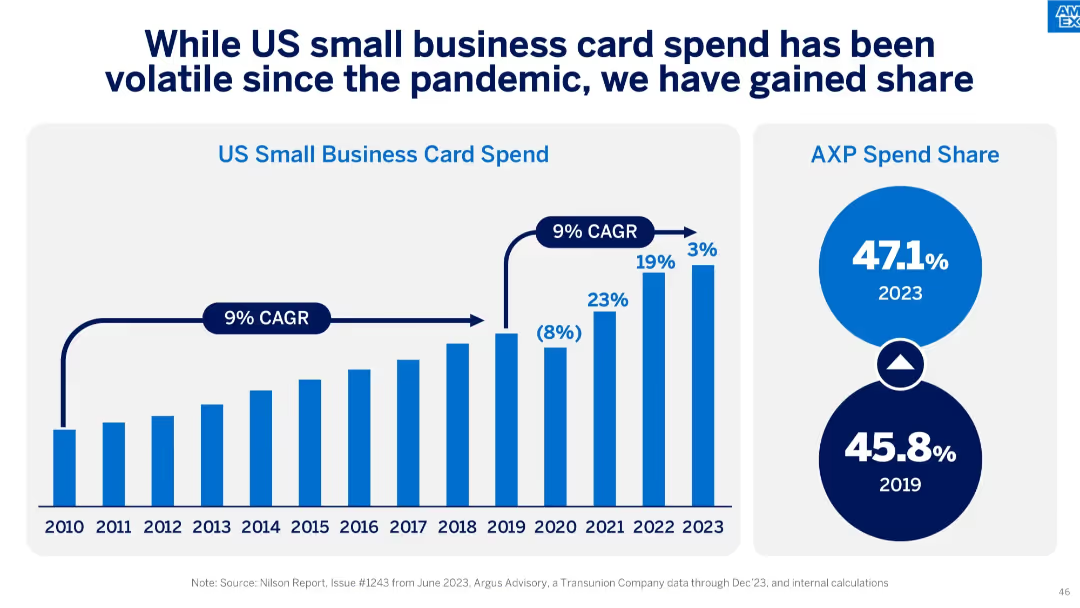
Left side features a vertical bar chart showing US small business card spend (2010–2023), while the right side includes two circular infographics showing AXP spend share for 2019 and 2023.
Financial Performance
Financial Services
The slide outlines the US small business card spending trend and highlights American Express’ increasing share, rising from 45.8% in 2019 to 47.1% in 2023, despite pandemic-related volatility.
CAGR, small business, card spend, AXP, market share, volatility, growth, pandemic impact, Nilson Report
false
Financial Performance
Financial Services financial-services
Single Chart
McKinsey
View slide
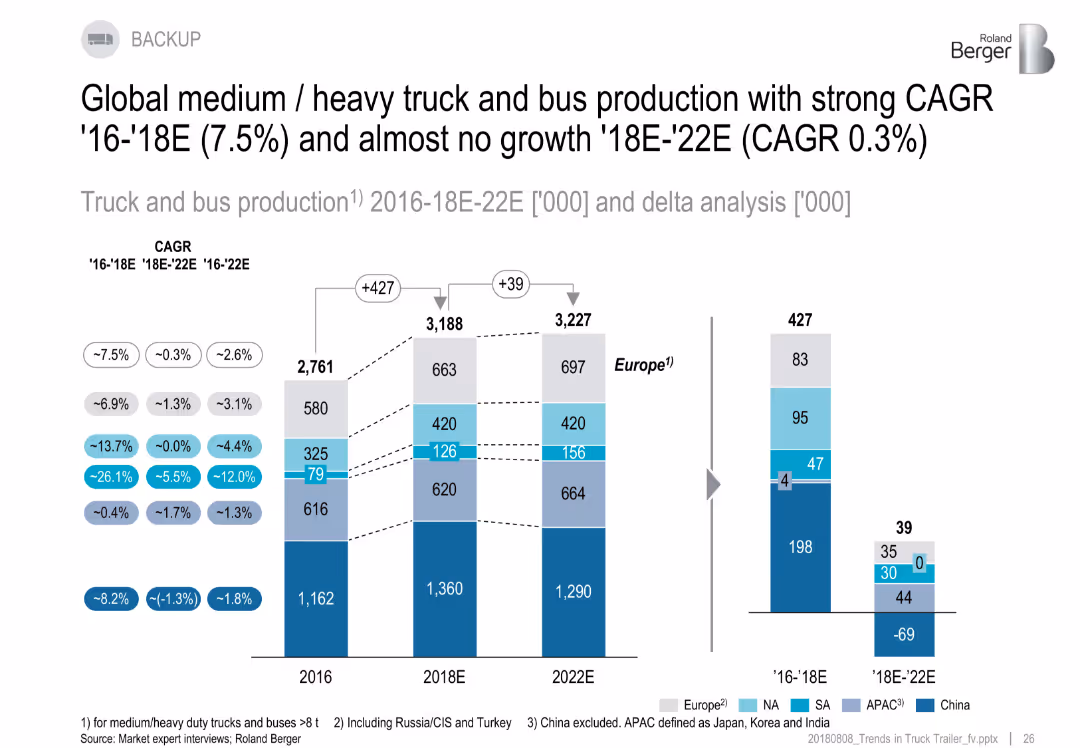
Stacked bar chart comparing truck and bus production from 2016–2022E, including deltas and CAGR bubbles.
Performance Metrics and KPIs
Industrial & Manufacturing
This slide contrasts two periods: strong growth from 2016–2018 (CAGR 7.5%) and a flattening trend from 2018–2022 (CAGR 0.3%). Regional data is presented, highlighting China’s significant role and slowing output beyond 2018.
CAGR, truck production, bus, global growth, KPIs, 2016–2022, regions
false
Performance Metrics and KPIs
Industrial & Manufacturing industrial-and-manufacturing
Multiple Chart
Roland Berger
View slide
Complex diagram, labeled sections, icons
Technology and Digital Transformation
Technology & Software
Architectural overview of CAI components
CAI, architecture, virtual agent, systems
false
Technology and Digital Transformation
Technology & Software technology-and-software
Diagram
Deloitte
View slide
Contains bulleted lists, icons, small text, two columns
Industry Overview
Technology & Software
Explains benefits of CAI in customer service
CAI, customer service, ML models, CSAT
false
Industry Overview
Technology & Software technology-and-software
Header Vertical
Deloitte
View slide
Flowchart design, icons, circular flow, green accents
Operational Efficiency
Technology & Software
Details the components of CAI and its user interactions
CAI, persona, self service, channels
false
Operational Efficiency
Technology & Software technology-and-software
Linear Flow
Deloitte
View slide
Multi-panel comparison, various aspects of CAI solutions
Strategic Planning
Professional Services
Guides decision-making in CAI implementation
CAI, platform, user experience, analytics
false
Strategic Planning
Professional Services professional-services
Table
Deloitte
View slide
Organized table layout, green highlights, icons
Human Resources and Talent Management
Professional Services
Describes various roles in CAI development teams
CAI, roles, skillsets, team structure
false
Human Resources and Talent Management
Professional Services professional-services
Header Vertical
Deloitte
View slide
Two sections with lists, graphic elements, green color
Market Analysis and Trends
Technology & Software
Discusses impact and opportunities of CAI in businesses
CAI, self-service, real-time, business evolution
false
Market Analysis and Trends
Technology & Software technology-and-software
Vertical Flow
Deloitte
View slide
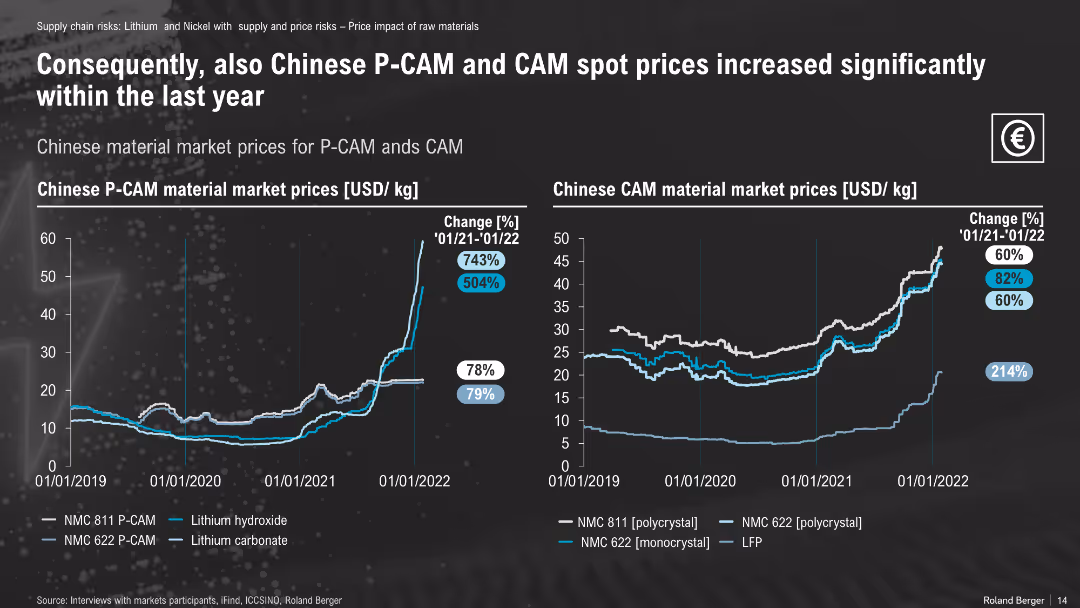
Dual line charts of P-CAM and CAM prices (2019–2022); color-coded by type
Pricing Strategies
Energy & Utilities
This slide tracks sharp price increases in Chinese cathode active materials (CAM) and precursors (P-CAM), aligned with rising lithium costs. Key materials like NMC 811 and 622 show significant inflation through early 2022.
CAM, P-CAM, lithium carbonate, price surge, NMC811, NMC622, China market
false
Pricing Strategies
Energy & Utilities energy-and-utilities
Multiple Chart
Roland Berger
View slide
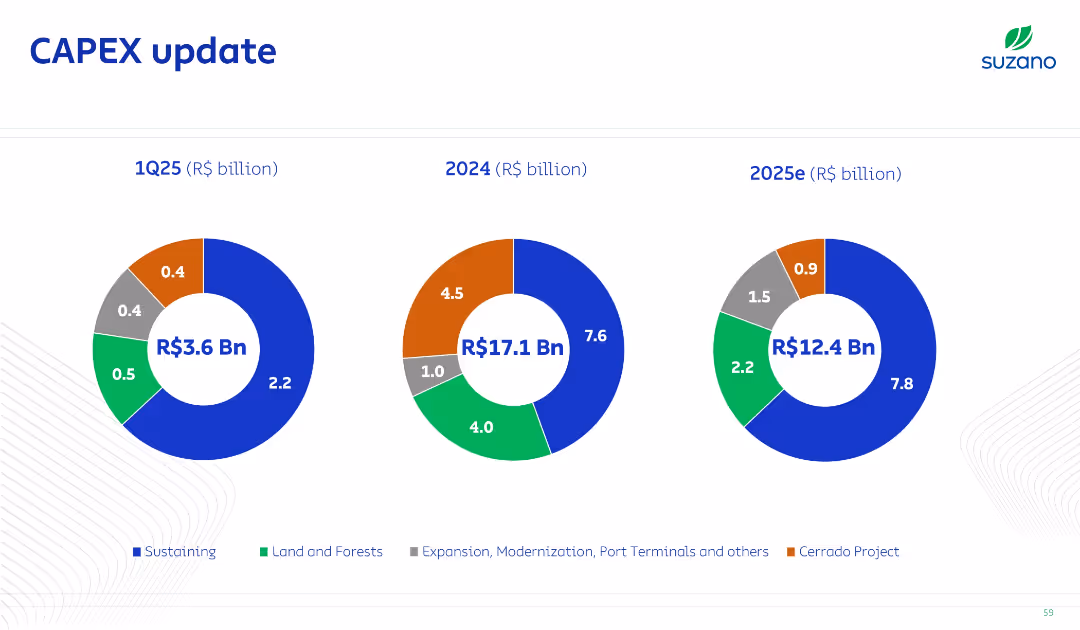
Three circular donut charts representing CAPEX breakdown for 1Q25, 2024, and 2025e; each segment color-coded by category (sustaining, land, projects, etc.).
Strategic Planning
Consumer Goods
This slide outlines Suzano’s capital expenditure plans by year and category, indicating major investments in sustaining operations and the Cerrado project. It emphasizes planned infrastructure and environmental allocations.
CAPEX, Investment, Forecast, Cerrado, Sustaining
false
Strategic Planning
Consumer Goods consumer-goods
Single Chart
Goldman Sachs
View slide
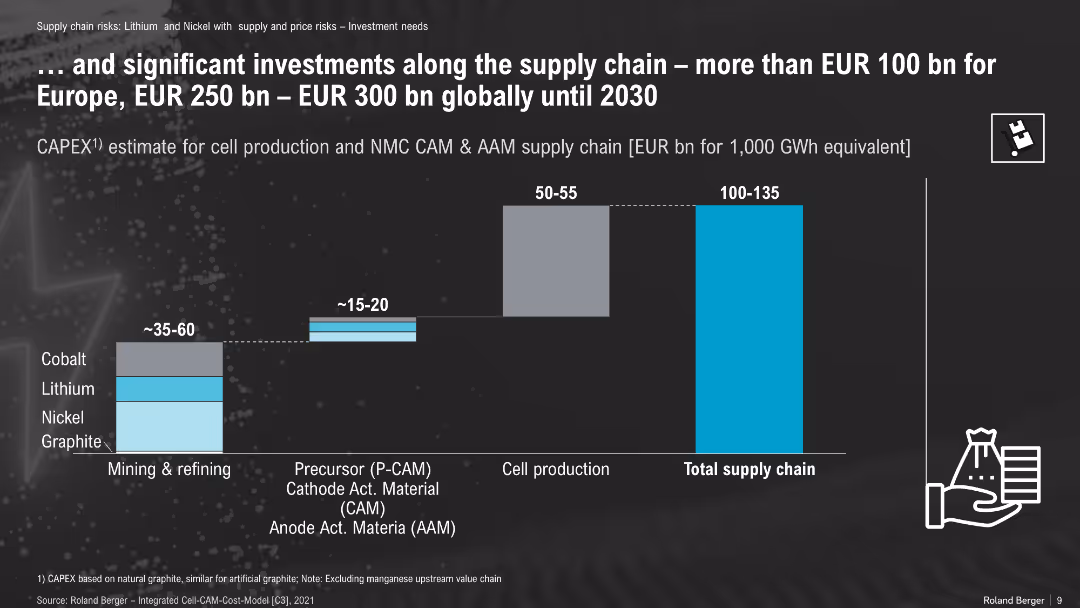
Bar chart of estimated CAPEX needs by supply chain stage; color-coded by material type
Investment Analysis
Energy & Utilities
CAPEX estimates for battery material and cell production supply chain show investments between EUR 100–135 bn needed globally by 2030. Mining, refining, and precursor material production dominate investment requirements.
CAPEX, supply chain, lithium, nickel, cobalt, graphite, cell production
false
Investment Analysis
Energy & Utilities energy-and-utilities
Single Chart
Roland Berger
View slide
Bubble chart showing CARG and growth for various IT segments from 2020-2025. Segments like Supply Chain Management, IaaS, and Business Intelligence Platforms are plotted with bubbles varying in size to represent different scales of impact.
Strategic Planning
Technology & Software
The slide analyzes the shift from purchasing solutions to building them in-house across various IT segments, with a focus on growth and CARG predictions.
CARG, growth, IT segments, bubble chart, strategy
false
Strategic Planning
Technology & Software technology-and-software
Single Chart
Gartner
View slide
The slide features a world map pinpointing regions of international expansion with a focus on EMEA countries, supplemented by bullet points on strategy. The color contrast and map design aid in focusing on the strategic elements.
Strategic Planning
Financial Services
Provides a strategy for international expansion of the commercial banking model, with a focus on market opportunities and targeted regions. It's useful for global strategic planning and discussing international growth potential with stakeholders.
CB model, international expansion, market opportunity, strategic planning, EMEA, APAC
false
Strategic Planning
Financial Services financial-services
Header Vertical
JP Morgan
View slide
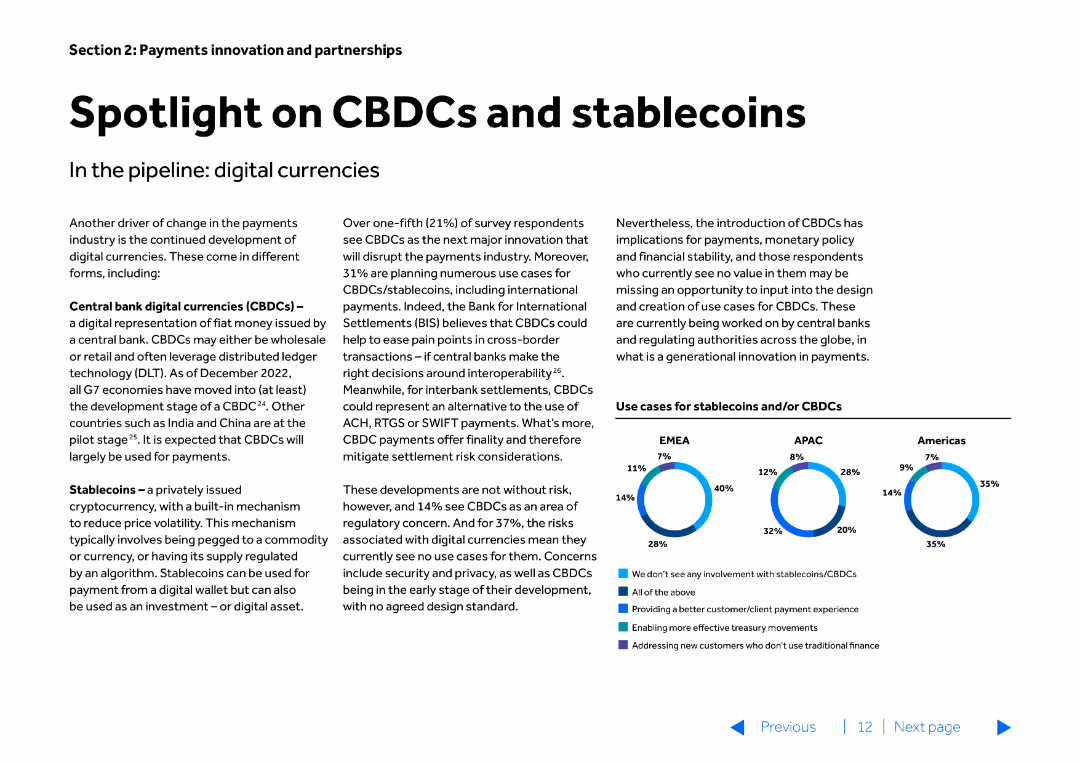
The slide features text-heavy content with a small column chart at the bottom. The slide is divided into two main sections discussing CBDCs and stablecoins, and their implications in digital currencies.
Market Analysis and Trends
Financial Services
Discusses the development and implications of Central Bank Digital Currencies (CBDCs) and stablecoins, highlighting their potential impact on the payments industry.
CBDCs, stablecoins, digital currencies, payments, trends
false
Market Analysis and Trends
Financial Services financial-services
Mixed Chart
Barclays
View slide
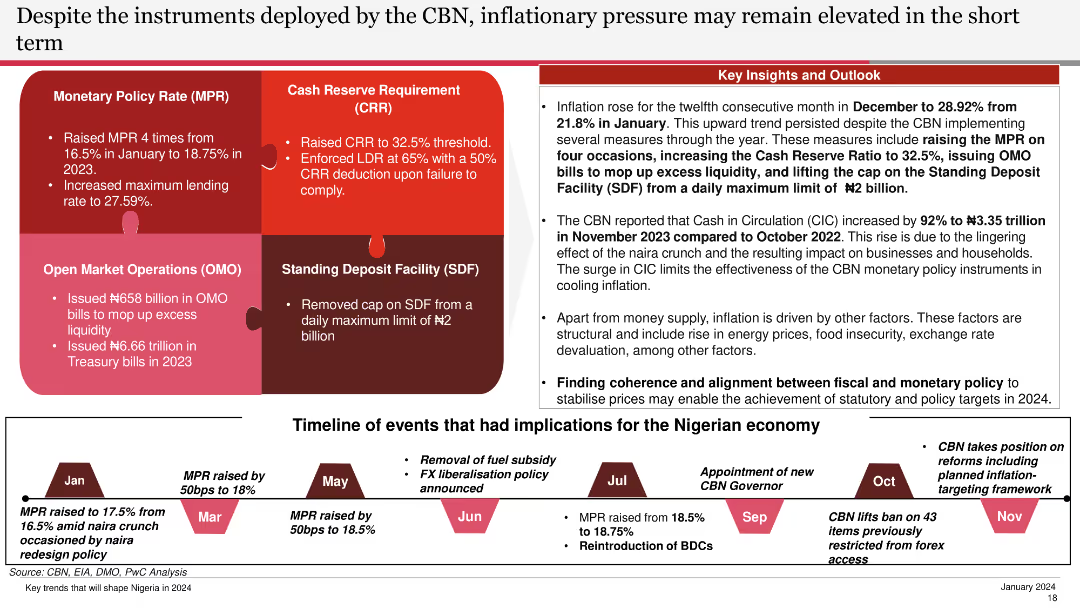
The slide includes text blocks and a timeline of monetary policy events. It is moderately complex, with clear use of color coding and annotations to highlight key measures.
Regulatory and Compliance
Financial Services
This slide details the monetary policy instruments used by the CBN to control inflation, providing a timeline of key events and their impact on the Nigerian economy in the short term.
CBN, Inflation, Policy, Instruments, Timeline
false
Regulatory and Compliance
Financial Services financial-services
Linear Flow
PwC/Strategy&
View slide
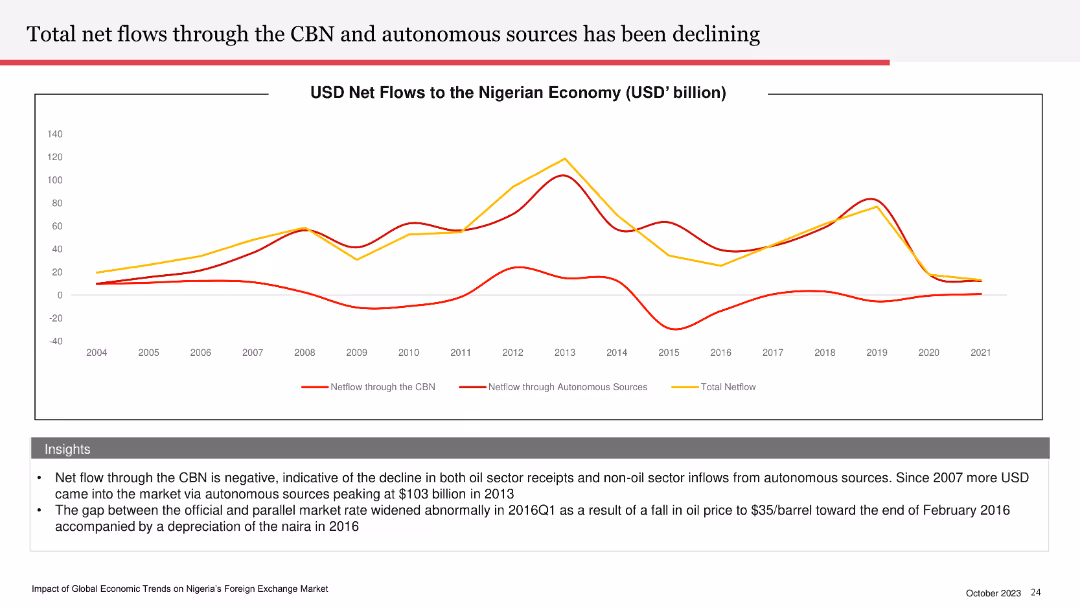
Line chart depicting USD net flows to the Nigerian economy from 2004 to 2021. Multiple lines show net flows through the CBN, autonomous sources, and total net flows.
Financial Performance
Financial Services
The slide details the declining net flows through the CBN and autonomous sources, indicating a negative trend in Nigeria's oil and non-oil sector receipts. It highlights the gap between official and parallel market rates, particularly in 2016.
CBN, net flows, Nigerian economy, oil sector, market rates
false
Financial Performance
Financial Services financial-services
Mixed Chart
PwC/Strategy&
Previous
Loading...
Hold On!
We are searching in our database
If nothing, comes up, please try different filters!
Column Chart
Heatmap
Chevron
Org Chart
Infographic
Callouts
Timeline
List
Graphic
Picture
Process Flow
Diagram
Paragraph
Map
Table
Framework
Subtitle
Takeaway Box
Icon
Other Chart
Radar Chart
Waterfall Chart
Mekko Chart
Pie Chart
Scatter Plot
Line Chart
Bar chart
Bullet points
Create a FREE account to continue browsing
Receive Instant Access to 1,000+ slides from companies like McKinsey, Google, and Goldman Sachs
First Name
Last Name
Email
Password
I agree to all
Terms & Privacy Policy
Thank you! Your submission has been received!
Oops! Something went wrong while submitting the form.
Have an account?
Sign in
Upgrade to PRO to Save slides
Advanced Search and Filters
Access to 15,000+ slides
Access to Category Pages
Save/Bookmark Slides
PowerPoint Template Library
Pick a Plan
MONTHLY
$12/month
Billed every month, Cancel anytime.
YEARLY
$9/year
Billed $108 annually, Cancel anytime.
Checkout for $12/month
Checkout for $108/yr
Secured by Stripe | AES-256 bit encryption