My Account
My Slides
Search by Category
Templates
View All Templates
Download Template Slides
Leave Feedback
Login
Logout
Get Started
Browse all Slides
Browse all Slides
Create a FREE Account
Instant access to 1,000+ real slides from top companies like McKinsey, BCG, Goldman Sachs, Google and many more!
First Name
Last Name
Email
Password
I agree to all
Terms & Privacy Policy
Thank you! Your submission has been received!
Oops! Something went wrong while submitting the form.
Have an account?
Sign in
Spark Your Next Big Idea with New Presentation Templates
VIEW ALL Templates
Welcome,
Welcome
PRO
Show Featured Only
Checkbox 8
Companies
Mckinsey
Bain
BCG
EY
Deloitte
Accenture
PwC/Strategy&
JP Morgan
Goldman Sachs
Morgan Stanley
Citigroup
Deutsche Bank
Barclays
LEK
KPMG
Kearney
Oliver Wyman
Booz Allen Hamilton
Gartner
IPSOS
Nielsen
Slide type
Text Only
Linear Flow
Vertical Flow
Single Chart
Header Horizontal
Mixed Chart
Header Vertical
Pillar
Multiple Chart
Graphic
Agenda
Title
Table
Framework
Industry
Technology & Software
Artificial Intelligence
Financial Services
Retail & E-commerce
Consumer Goods
Industrial & Manufacturing
Transportation & Logistics
Telecommunications
Real Estate & Construction
Hospitality & Tourism
Professional Services
Education & Training
Media & Entertainment
Agriculture & Food Production
Healthcare & Pharmaceuticals
Environmental Services & Sustainability
Government & Public Sector
Use Case
Mergers and Acquisitions
Performance Metrics and KPIs
Client Case Studies
Competitive Landscape
Corporate Finance and Valuation
Product and Service Analysis
Customer and Market Segmentation
Organizational Structure and Change
Industry Overview
Regulatory and Compliance
Risk Assessment and Management
Investment Analysis
Organizational Structure and Change
Human Resources and Talent Management
Financial Performance
Market Analysis and Trends
Sales and Business Development
Human Resources and Talent Management
Clear all
Thank you! Your submission has been received!
Oops! Something went wrong while submitting the form.
Tag
View slide
Bar chart showing the percentage of companies experiencing various degrees of revenue impact due to COVID-19.
Risk Assessment and Management
Professional Services
This slide details the financial impact of COVID-19 on companies, highlighting different extents of revenue decreases and increases.
COVID-19 impact, revenue changes, company performance, financial risk
false
Risk Assessment and Management
Professional Services professional-services
Single Chart
PwC/Strategy&
View slide
Contains multiple bar charts aligned horizontally displaying the percentages of consumers delaying, maintaining, or increasing vehicle maintenance and repairs post-COVID-19. Colors differentiate actions across several countries.
Market Analysis and Trends
Transportation & Logistics
Discusses the impact of COVID-19 on consumer behaviors related to vehicle maintenance and repair, showing trends of postponement and additional work done across different nations.
COVID-19 impact, vehicle maintenance, consumer behavior, repair trends, international comparison
false
Market Analysis and Trends
Transportation & Logistics transportation-and-logistics
Single Chart
McKinsey
View slide
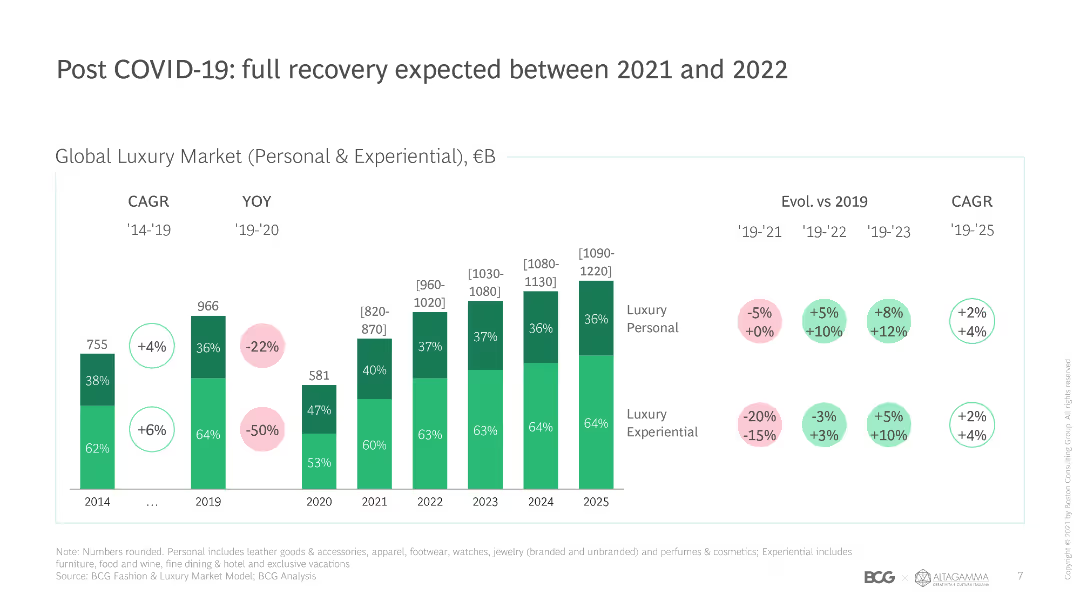
This slide features a column chart comparing global luxury market size and growth rates from 2014 to 2025, with color-coded segments for personal and experiential luxury.
Market Analysis and Trends
Retail & E-commerce
The slide projects the recovery of the global luxury market post-COVID-19, highlighting growth rates and market size for personal and experiential luxury segments.
COVID-19 recovery, luxury market, growth rates, market size, experiential luxury, personal luxury, global trends, projections, CAGR
false
Market Analysis and Trends
Retail & E-commerce retail-and-e-commerce
Single Chart
BCG
View slide
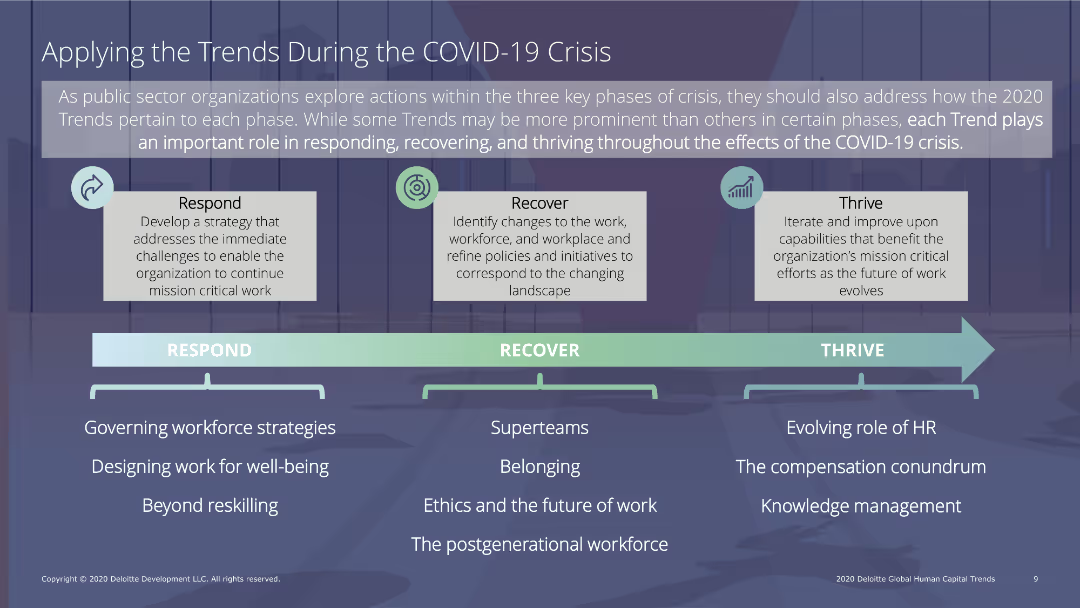
The slide includes a flow diagram outlining strategies for responding to, recovering from, and thriving during the COVID-19 crisis, with text sections detailing specific actions and phases.
Human Resources and Talent Management
Professional Services
The slide outlines a framework for public sector organizations to respond, recover, and thrive during the COVID-19 crisis, with specific strategies for each phase, such as workforce strategies, well-being, and reskilling.
COVID-19 response, crisis management, public sector, recovery, thrive
false
Human Resources and Talent Management
Professional Services professional-services
Linear Flow
Deloitte
View slide
Features a stacked area chart for variant frequencies and a scatter plot comparing the antibody resistance of COVID-19 variants.
Regulatory and Compliance
Healthcare & Pharmaceuticals
Details the prevalence of COVID-19 variants and their implications on vaccine efficacy, stressing the need for continued vigilance.
COVID-19 variants, vaccine efficacy, public health, antibody resistance, variant tracking, health policy
false
Regulatory and Compliance
Healthcare & Pharmaceuticals healthcare-and-pharmaceuticals
Multiple Chart
BCG
View slide
Includes several line graphs showing predicted infection paths under different immunity and infection rate scenarios, annotated for clarity and comparison.
Strategic Planning
Healthcare & Pharmaceuticals
Analyzes potential COVID-19 infection trajectories for Austria under various public health response scenarios, aiding in policy decision-making and strategy adjustment.
COVID-19, Austria, scenario analysis, infection rates, public health response, policy planning
false
Strategic Planning
Healthcare & Pharmaceuticals healthcare-and-pharmaceuticals
Multiple Chart
McKinsey
View slide
Large area graph showing the daily new cases with a 7-day rolling average, accompanied by key observations that include numerical and percentage data.
Risk Assessment and Management
Government & Public Sector
Analyzes the rise in COVID-19 cases in early July 2020 and provides a snapshot of the global situation with key statistics on active cases, recoveries, and fatalities.
COVID-19, Case Growth, Recovery Rates, Summer Spread
false
Risk Assessment and Management
Government & Public Sector government-and-public-sector
Single Chart
BCG
View slide
The slide features a series of icons representing different communication channels, each accompanied by a percentage showing adoption or changes. This visual layout allows for a quick assessment of how COVID-19 has influenced channel strategies.
Technology and Digital Transformation
Professional Services
Discusses the transformation in marketing channels due to COVID-19, focusing on the shift towards more digital and direct-to-consumer approaches. It provides insights into how companies are adapting their communication and sales strategies in response to the pandemic, which is valuable for planning future marketing and sales initiatives.
COVID-19, Channel Strategy, Digital Transformation, Marketing, Sales
false
Technology and Digital Transformation
Professional Services professional-services
Pillar
Deloitte
View slide
Line graphs comparing daily traffic index, coal consumption, and property transactions in China before and during COVID-19, marked with key dates.
Strategic Planning
Financial Services
Tracks the early signs of economic recovery in China, analyzing daily activities, energy consumption, and property transactions as of April 2020.
COVID-19, China, economic recovery, traffic, coal consumption, property transactions, analysis, recovery tracking
false
Strategic Planning
Financial Services financial-services
Multiple Chart
BCG
View slide
This slide features a complex chart with a key explaining demographics, a world map, and a large pie chart in the center describing work situations.
Market Analysis and Trends
Retail & E-commerce
Details Accenture's research on consumer behavior during COVID-19, showing how attitudes, behaviors, and habits are likely to change post-crisis.
COVID-19, Consumer Research, Global Survey, Work Situations, Social Distancing, Demographics, Behavioral Change
false
Market Analysis and Trends
Retail & E-commerce retail-and-e-commerce
Mixed Chart
Accenture
View slide
Contains a line chart showing the change in consumer sentiment about COVID-19 over time in the US and emerging markets. The layout is simple with clear labels and a contrasting color scheme for clarity.
Market Analysis and Trends
Healthcare & Pharmaceuticals
Discusses changes in consumer confidence in the US and emerging markets due to the COVID-19 Delta variant, using survey data to illustrate perceptions over time and expectations for economic recovery.
COVID-19, Delta Variant, Consumer Sentiment, Markets
false
Market Analysis and Trends
Healthcare & Pharmaceuticals healthcare-and-pharmaceuticals
Mixed Chart
BCG
View slide
Features a stacked area chart tracking the frequency of COVID-19 variants over time with multiple color-coded layers representing different variants.
Market Analysis and Trends
Healthcare & Pharmaceuticals
This slide presents the dominance of the Delta variant among COVID-19 cases over time, useful for epidemiological tracking and vaccine strategy adjustments.
COVID-19, Delta variant, epidemiology, vaccine strategy, variant tracking
false
Market Analysis and Trends
Healthcare & Pharmaceuticals healthcare-and-pharmaceuticals
Single Chart
BCG
View slide
This slide features a detailed area graph depicting the rolling average of daily new COVID-19 cases globally, segmented by continent. The design is straightforward, focusing on the data presentation with minimal distractions. The color coding by region helps in distinguishing the data visually.
Market Analysis and Trends
Healthcare & Pharmaceuticals
Offers an in-depth analysis of the spread of the COVID-19 Delta variant and its impact on global case numbers. Highlights the effectiveness of vaccination efforts in reducing case numbers and discusses potential future trends in the pandemic's progression, providing valuable insights for healthcare and public health planning.
COVID-19, Delta variant, global health, pandemic trends, vaccination impact, public health, area graph
false
Market Analysis and Trends
Healthcare & Pharmaceuticals healthcare-and-pharmaceuticals
Mixed Chart
BCG
View slide
Line graph comparing daily cases per million population in several countries with accompanying text on lockdown strategies and cumulative cases.
Risk Assessment and Management
Government & Public Sector
Compares COVID-19 case trends in different countries and correlates them with their respective lockdown strategies.
COVID-19, Developed Economies, Lockdown Strategies, Case Trends
false
Risk Assessment and Management
Government & Public Sector government-and-public-sector
Single Chart
BCG
View slide
The slide features a mix of icons, bullet points, and sections of text, with a bold title at the top. It uses contrasting blue and white color blocks to differentiate points.
Strategic Planning
Healthcare & Pharmaceuticals
This slide details how COVID-19 has accelerated the adoption of digital solutions in healthcare, emphasizing innovations and pre-COVID-19 impediments to digital transformation in patient support solutions.
COVID-19, Digital Solutions, Healthcare, Patient Support, Telemedicine, e-Pharmacy, Innovation, Barriers, Adoption, Transformation
false
Strategic Planning
Healthcare & Pharmaceuticals healthcare-and-pharmaceuticals
Header Vertical
Bain
View slide
Pie chart showing the estimated duration of COVID-19's economic impact. Segments represent different time frames, with a majority predicting a prolonged effect. Text explains the context.
Market Analysis and Trends
Financial Services
This slide presents Canadian investors' views on the duration of COVID-19's impact on the economy, with a significant portion expecting the effects to last until April 2022 or longer. It discusses the variations in perceptions based on age and gender.
COVID-19, Economic Impact, Canadian, Duration, Prediction
false
Market Analysis and Trends
Financial Services financial-services
Mixed Chart
IPSOS
View slide
Bar chart illustrating the expected time for economic recovery post-COVID-19, ranging from one year to more than five years. Additional text provides insights.
Risk Assessment and Management
Financial Services
The slide outlines expectations for the Canadian economy's recovery time post-COVID-19, showing a range of predictions from one year to more than five years. It highlights the divide between optimists and pessimists regarding the economic rebound timeline.
COVID-19, Economic Recovery, Canadian, Timeline, Prediction
false
Risk Assessment and Management
Financial Services financial-services
Mixed Chart
IPSOS
View slide
Data-heavy slide with bar graphs and charts showing daily cases, growth of daily new cases, recovery rates, and testing data for the top 15 economies by GDP.
Risk Assessment and Management
Government & Public Sector
Presents detailed COVID-19 case numbers, recovery rates, and testing data for major economies, highlighting the disparity in pandemic management.
COVID-19, Economy, Recovery, Testing, GDP, Pandemic Management
false
Risk Assessment and Management
Government & Public Sector government-and-public-sector
Multiple Chart
BCG
View slide
The slide features a timeline table format, showcasing key educational developments during COVID-19 across various countries. It uses shades of blue for emphasis and has a clear header.
Regulatory and Compliance
Education & Training
It displays the educational response to COVID-19 in Southeast Asia, with timelines for school closures and alternative educational arrangements, demonstrating the shift towards online learning solutions.
COVID-19, Education, Response, SEA, School Closures, Online Learning, Alternatives, Timelines, Developments, Shift
false
Regulatory and Compliance
Education & Training education-and-training
Mixed Chart
Bain
View slide
Showcases a world map and timeline of COVID-19 case statistics, using color gradients to denote varying conditions across regions, complemented by key data points on recoveries and infection rates.
Strategic Planning
Healthcare & Pharmaceuticals
Provides a global overview of COVID-19 recovery rates and case doubling times, useful for public health monitoring and response planning.
COVID-19, Epidemic monitoring, Global health, Public health, Recovery rates
false
Strategic Planning
Healthcare & Pharmaceuticals healthcare-and-pharmaceuticals
Mixed Chart
BCG
View slide
This slide presents data in a series of well-organized tables and charts. It compares epidemiological data across various European countries with economic indicators on the side. There's a consistent color theme for visual clarity.
Market Analysis and Trends
Government & Public Sector
This slide compares COVID-19 data among European countries, with a focus on epidemiological and economic impacts. It is designed for presenting to stakeholders interested in the pandemic's effects and measures like travel restrictions and health notices, with country-specific details for a granular approach.
COVID-19, Europe, Data Comparison, Travel Restrictions, Health Notice, Economic Impact, Epidemiological Data, Country-Specific, Pandemic, Measures
false
Market Analysis and Trends
Government & Public Sector government-and-public-sector
Multiple Chart
McKinsey
View slide
The slide contains text analysis and a pie chart comparing the perceived impact of COVID-19 and the 2007-08 Financial Crisis on investors. Clean white background.
Market Analysis and Trends
Financial Services
This slide compares the impact of COVID-19 and the Financial Crisis of 2007-08 on investors, highlighting differences in perception and resulting investment behavior.
COVID-19, Financial Crisis, comparison, perception, investment behavior
false
Market Analysis and Trends
Financial Services financial-services
Mixed Chart
IPSOS
View slide
Stacked bar chart showing the self-assessed financial situations of respondents compared to pre-COVID-19. The chart divides responses into categories from 'Much worse off' to 'Much better off'.
Risk Assessment and Management
Financial Services
The slide analyzes the perceived financial impact of COVID-19 on Canadian investors, indicating that a significant portion felt worse off financially. It highlights variations across income groups, showing those with lower incomes were more adversely affected.
COVID-19, Financial Impact, Canadian, Income, Pandemic
false
Risk Assessment and Management
Financial Services financial-services
Mixed Chart
IPSOS
View slide
Bar chart showing the estimated time for financial recovery among households post-COVID-19. Categories range from one year to more than five years.
Risk Assessment and Management
Financial Services
The slide details the estimated time for Canadian households to recover financially from COVID-19, with responses indicating a range from one year to more than five years. It also notes a small percentage of respondents who feel their finances were not significantly impacted.
COVID-19, Financial Recovery, Canadian, Households, Pandemic
false
Risk Assessment and Management
Financial Services financial-services
Mixed Chart
IPSOS
View slide
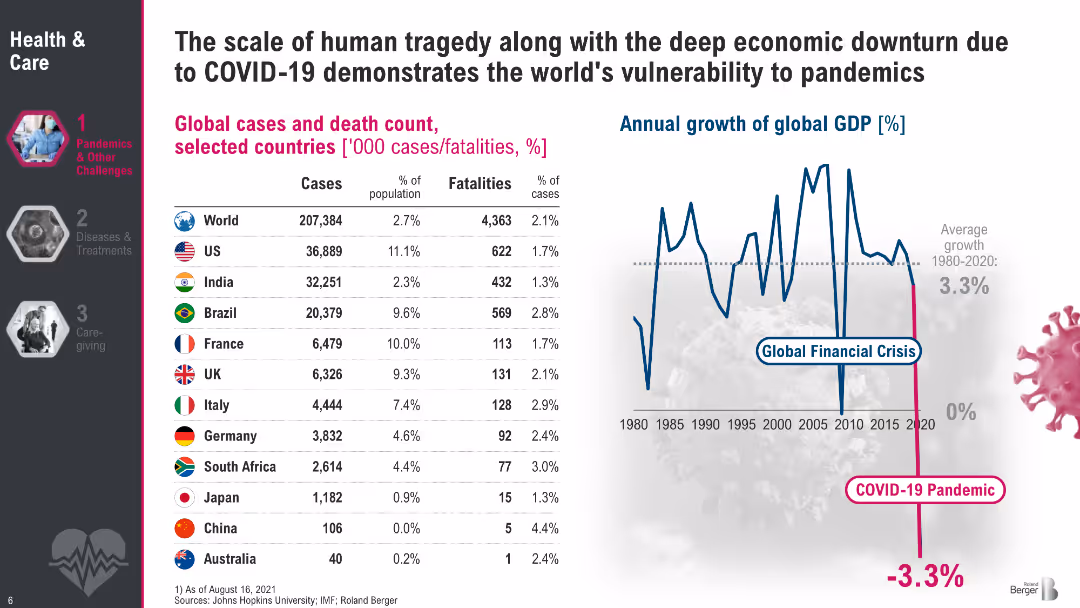
Split layout: left side features a table of COVID-19 cases and fatalities by country; right side shows a line graph of global GDP growth from 1980 to 2020 with a sharp drop in 2020; white background with pink and blue accents; sidebar navigation on the left.
Performance Metrics and KPIs
Healthcare & Pharmaceuticals
Demonstrates the global scale and impact of COVID-19, with detailed statistics on cases and fatalities across selected countries. It highlights how pandemics influence human health and global economic performance, with GDP data showing a sharp contraction in 2020. The slide contextualizes pandemic vulnerability using both health and economic indicators.
COVID-19, GDP impact, global health, fatalities, economic downturn, pandemic, WHO data, IMF, vulnerability
false
Performance Metrics and KPIs
Healthcare & Pharmaceuticals healthcare-and-pharmaceuticals
Mixed Chart
Roland Berger
View slide
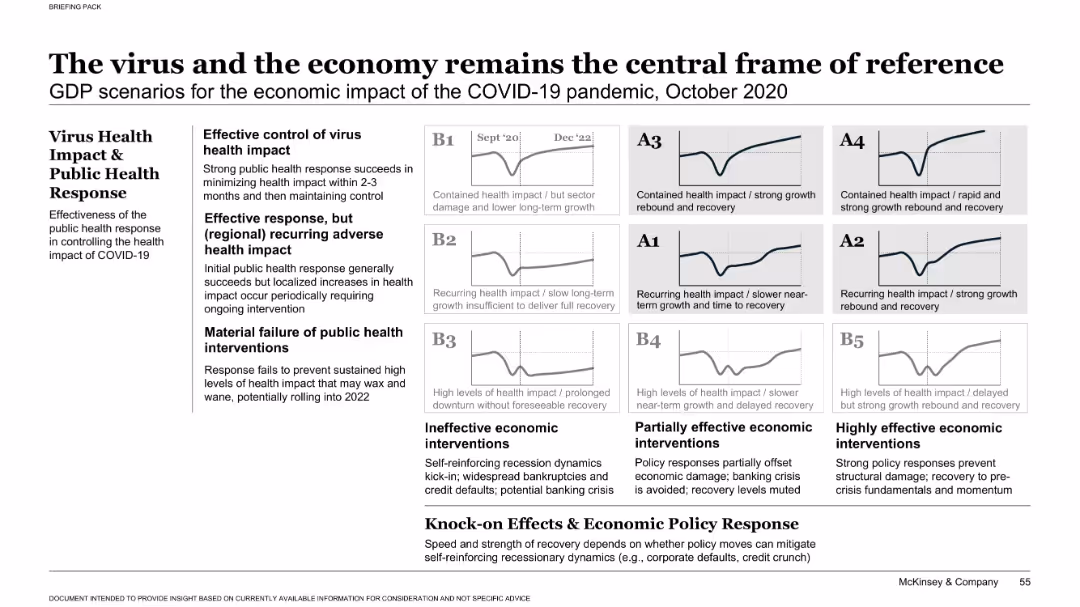
Matrix-style layout with 3x3 grid of small charts representing GDP scenarios, grouped by effectiveness of virus response and economic policy response. Left-hand text box explains scenario categories. Neutral color palette.
Strategic Planning
Professional Services
Presents a framework of nine GDP recovery scenarios based on public health response and economic interventions. It highlights three tiers of virus control (effective, recurring, and failure) and three levels of economic response (ineffective to highly effective), leading to different economic trajectories.
COVID-19, GDP scenarios, economic impact, virus response, policy impact, strategic framework, recovery models, public health, recession risk, intervention outcomes
false
Strategic Planning
Professional Services professional-services
Single Chart
McKinsey
View slide
This slide features a detailed comparison of three uncertainty scenarios: Base, Downside, and Upside. It uses icons and color coding for visual distinction.
Risk Assessment and Management
Professional Services
Discusses three potential economic scenarios regarding impacts such as COVID-19, geopolitical risks, and global supply chains. Each scenario (Base, Downside, Upside) includes detailed impacts and macroeconomic driver information. Useful for risk assessment and strategic decision-making.
COVID-19, Geopolitical Risk, Supply Chain, Inflation, GDP, Scenario Analysis, Economic Drivers, Risk Management
false
Risk Assessment and Management
Professional Services professional-services
Table
Deloitte
View slide
Dual-graph layout with a line graph on the left displaying global mobility and new infection rates, and a combined bar and line graph on the right comparing stock baskets and treasury yield. Utilizes contrasting colors and is text-heavy at the top with annotations for data points.
Market Analysis and Trends
Healthcare & Pharmaceuticals
The slide presents data on how COVID-19 variants affect different industries, showing a relationship between global mobility, infection rates, and market performance in various sectors. Intended for financial market analysis and predicting economic trends.
COVID-19, Global Mobility, Market Impact, Infection Rates, Stock Performance, Stay-at-Home Basket, Treasury Yield, Economic Trends
false
Market Analysis and Trends
Healthcare & Pharmaceuticals healthcare-and-pharmaceuticals
Multiple Chart
Citigroup
View slide
List of key government actions to combat COVID-19 with descriptive footnotes and examples of countries implementing these actions.
Risk Assessment and Management
Government & Public Sector
Suggests five critical actions that governments can take to protect the population and limit hospitalizations during the pandemic.
COVID-19, Government Actions, Hospitalizations, Protective Measures
false
Risk Assessment and Management
Government & Public Sector government-and-public-sector
Pillar
BCG
View slide
Text-heavy slide with headings and subheadings, outlining the document's objectives and leadership guidance.
Industry Overview
Government & Public Sector
Summarizes the global impact of COVID-19 and the need for an integrated response from leaders across sectors.
COVID-19, Health Crisis, Leadership, Integrated Response, Societal Impact
false
Industry Overview
Government & Public Sector government-and-public-sector
Text Only
BCG
Previous
Loading...
Hold On!
We are searching in our database
If nothing, comes up, please try different filters!
Column Chart
Heatmap
Chevron
Org Chart
Infographic
Callouts
Timeline
List
Graphic
Picture
Process Flow
Diagram
Paragraph
Map
Table
Framework
Subtitle
Takeaway Box
Icon
Other Chart
Radar Chart
Waterfall Chart
Mekko Chart
Pie Chart
Scatter Plot
Line Chart
Bar chart
Bullet points
Create a FREE account to continue browsing
Receive Instant Access to 1,000+ slides from companies like McKinsey, Google, and Goldman Sachs
First Name
Last Name
Email
Password
I agree to all
Terms & Privacy Policy
Thank you! Your submission has been received!
Oops! Something went wrong while submitting the form.
Have an account?
Sign in
Upgrade to PRO to Save slides
Advanced Search and Filters
Access to 15,000+ slides
Access to Category Pages
Save/Bookmark Slides
PowerPoint Template Library
Pick a Plan
MONTHLY
$12/month
Billed every month, Cancel anytime.
YEARLY
$9/year
Billed $108 annually, Cancel anytime.
Checkout for $12/month
Checkout for $108/yr
Secured by Stripe | AES-256 bit encryption