My Account
My Slides
Search by Category
Templates
View All Templates
Download Template Slides
Leave Feedback
Login
Logout
Get Started
Browse all Slides
Browse all Slides
Create a FREE Account
Instant access to 1,000+ real slides from top companies like McKinsey, BCG, Goldman Sachs, Google and many more!
First Name
Last Name
Email
Password
I agree to all
Terms & Privacy Policy
Thank you! Your submission has been received!
Oops! Something went wrong while submitting the form.
Have an account?
Sign in
Spark Your Next Big Idea with New Presentation Templates
VIEW ALL Templates
Welcome,
Welcome
PRO
Show Featured Only
Checkbox 8
Companies
Mckinsey
Bain
BCG
EY
Deloitte
Accenture
PwC/Strategy&
JP Morgan
Goldman Sachs
Morgan Stanley
Citigroup
Deutsche Bank
Barclays
LEK
KPMG
Kearney
Oliver Wyman
Booz Allen Hamilton
Gartner
IPSOS
Nielsen
Slide type
Text Only
Linear Flow
Vertical Flow
Single Chart
Header Horizontal
Mixed Chart
Header Vertical
Pillar
Multiple Chart
Graphic
Agenda
Title
Table
Framework
Industry
Technology & Software
Artificial Intelligence
Financial Services
Retail & E-commerce
Consumer Goods
Industrial & Manufacturing
Transportation & Logistics
Telecommunications
Real Estate & Construction
Hospitality & Tourism
Professional Services
Education & Training
Media & Entertainment
Agriculture & Food Production
Healthcare & Pharmaceuticals
Environmental Services & Sustainability
Government & Public Sector
Use Case
Mergers and Acquisitions
Performance Metrics and KPIs
Client Case Studies
Competitive Landscape
Corporate Finance and Valuation
Product and Service Analysis
Customer and Market Segmentation
Organizational Structure and Change
Industry Overview
Regulatory and Compliance
Risk Assessment and Management
Investment Analysis
Organizational Structure and Change
Human Resources and Talent Management
Financial Performance
Market Analysis and Trends
Sales and Business Development
Human Resources and Talent Management
Clear all
Thank you! Your submission has been received!
Oops! Something went wrong while submitting the form.
Tag
View slide
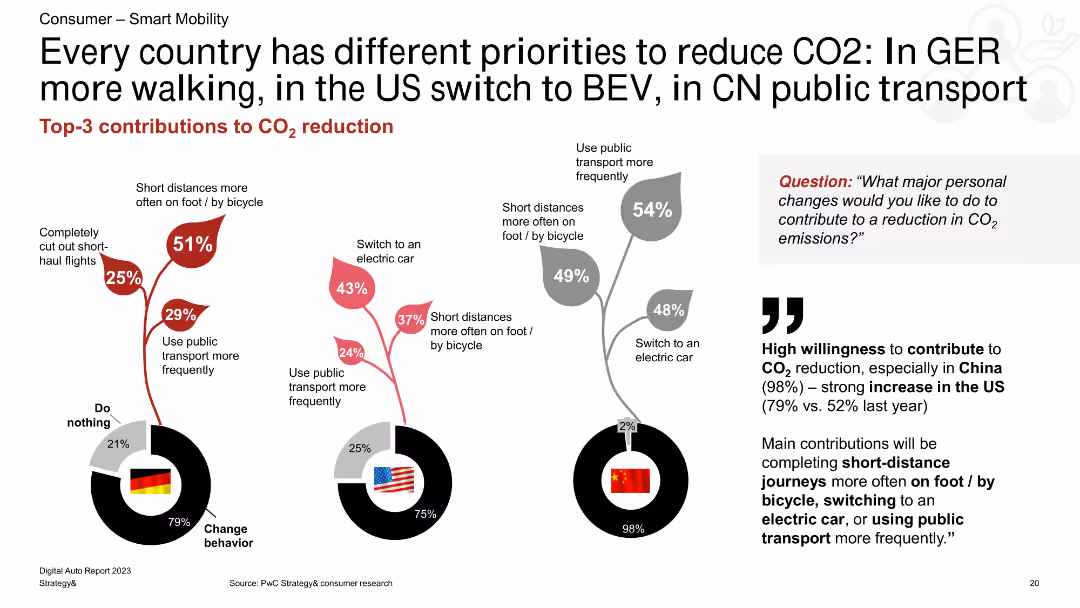
A combination of column charts showing CO2 reduction methods for Germany, the US, and China. The charts are accompanied by text highlighting key points and percentages.
Market Analysis and Trends
Transportation & Logistics
The slide compares the top three methods for reducing CO2 emissions in Germany, the US, and China, emphasizing walking, BEV, and public transport use.
CO2 reduction, Germany, US, China, walking, BEV, public transport
false
Market Analysis and Trends
Transportation & Logistics transportation-and-logistics
Multiple Chart
PwC/Strategy&
View slide
The slide includes a bar chart on the left showing CO2 thresholds for low carbon steel, and a list of decarbonization levers on the right.
Risk Assessment and Management
Industrial & Manufacturing
The slide discusses different methods for reducing CO2 emissions across three scopes and provides examples of decarbonization strategies.
CO2 reduction, decarbonization, steel, scope 1-3, emissions
false
Risk Assessment and Management
Industrial & Manufacturing industrial-and-manufacturing
Table
McKinsey
View slide
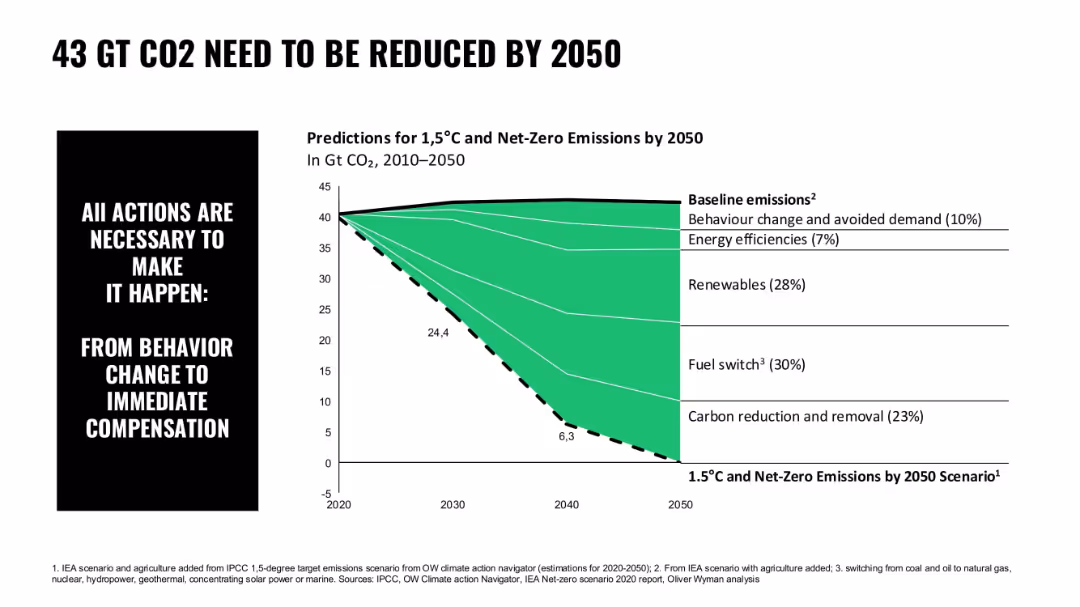
Area chart in green with segmented contributions to carbon reduction; simple typography; left-aligned callout box
Risk Assessment and Management
Environmental Services & Sustainability
The chart depicts required CO2 reduction levels by 2050 to reach 1.5°C targets, breaking it down by behavioral changes, renewables, fuel switch, and carbon removal.
CO2 reduction, emissions, net-zero, renewables, fuel switch, climate action, IEA scenario
false
Risk Assessment and Management
Environmental Services & Sustainability environmental-services-and-sustainability
Mixed Chart
Oliver Wyman
View slide
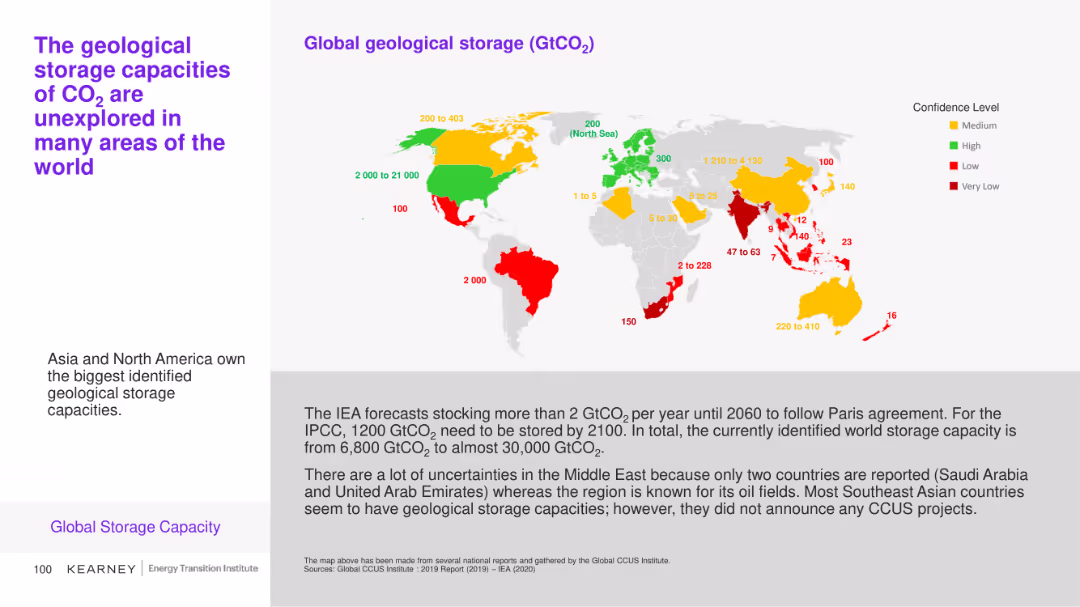
This slide includes a map and a bar chart illustrating the global geological storage capacities of CO2 with varying confidence levels across different regions. Color coding (green, yellow, red) indicates confidence levels.
Market Analysis and Trends
Environmental Services & Sustainability
The slide explores the identified geological storage capacities for CO2 globally, emphasizing areas with the highest potential and the uncertainties in certain regions like the Middle East.
CO2 storage, geological capacity, global map, confidence levels
false
Market Analysis and Trends
Environmental Services & Sustainability environmental-services-and-sustainability
Graphic
Kearney
View slide
The slide includes a line chart comparing geological storage costs for CO2 in onshore and offshore sites.
Financial Performance
Energy & Utilities
This slide compares the costs of geological storage for CO2 in depleted oil and gas fields and saline aquifers.
CO2 storage, geological, costs, onshore, offshore
false
Financial Performance
Energy & Utilities energy-and-utilities
Mixed Chart
Kearney
View slide
The slide includes a line chart comparing cost estimates for long-distance CO2 transport using various methods.
Financial Performance
Energy & Utilities
This slide presents cost estimates for transporting CO2 over long distances by ship, offshore pipeline, and onshore pipeline.
CO2 transport, costs, long-distance, pipeline, ship
false
Financial Performance
Energy & Utilities energy-and-utilities
Single Chart
Kearney
View slide
The slide includes an infographic showing how CO2 is used as a raw material for plastics. It illustrates the process of converting CO2 into polyols and other plastic components with various end-use applications.
Technology and Digital Transformation
Energy & Utilities
The slide highlights the innovative technology developed by Covestro to use CO2 as a raw material for manufacturing plastics, showcasing its potential to substitute oil-based raw materials and support circular economy initiatives.
CO2 utilization, plastics, raw materials, Covestro, circular economy
false
Technology and Digital Transformation
Energy & Utilities energy-and-utilities
Diagram
Kearney
View slide
The slide features a flowchart depicting the order of magnitude of CO2 storage and utilization. It includes branches for conversion and non-conversion processes with specific applications like mineralization, biological, chemical, etc.
Technology and Digital Transformation
Environmental Services & Sustainability
The slide outlines the various technological pathways and their respective capacities for CO2 utilization and storage, showcasing a broad range of solutions for either using or storing carbon dioxide.
CO2 utilization, storage, technology, pathways, conversion processes
false
Technology and Digital Transformation
Environmental Services & Sustainability environmental-services-and-sustainability
Diagram
Kearney
View slide
The slide features a comparative analysis with column charts and bar charts showing CO2 avoided and CO2 avoidance cost for FCEV and BEV under different energy sources.
Regulatory and Compliance
Energy & Utilities
The slide compares carbon abatement costs and CO2 savings for fuel cell electric vehicles and battery electric vehicles, considering various energy sources for charging stations.
CO2, FCEV, BEV, carbon abatement, energy sources
false
Regulatory and Compliance
Energy & Utilities energy-and-utilities
Multiple Chart
Kearney
View slide
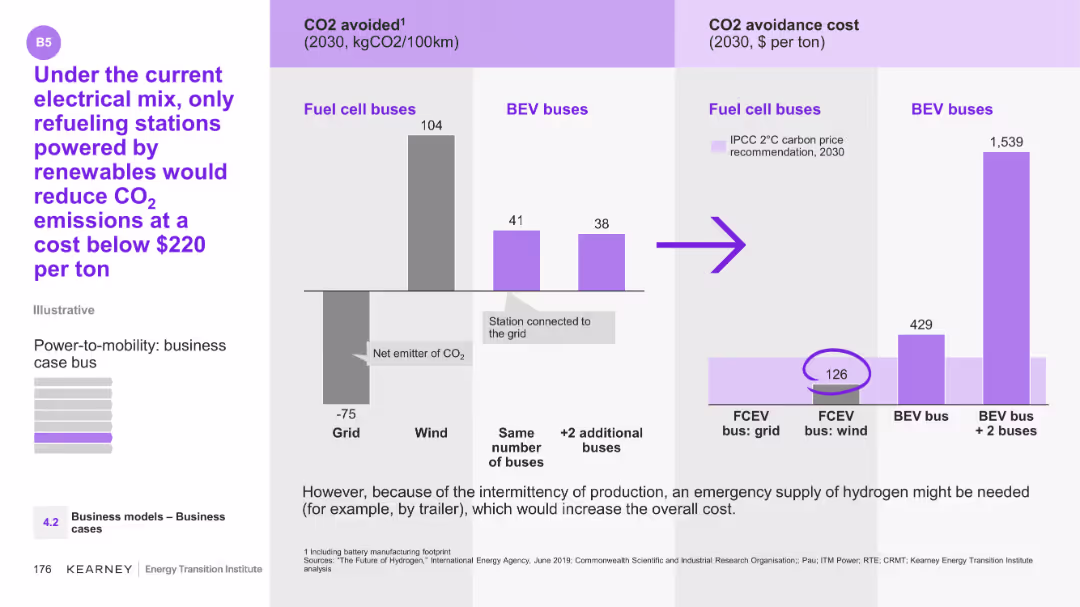
The slide features a column chart showing CO2 avoided for fuel cell buses and BEV buses, along with their CO2 avoidance costs.
Technology and Digital Transformation
Energy & Utilities
The slide compares CO2 emissions and avoidance costs between fuel cell and BEV buses under different energy sources. It suggests that only renewable-powered refueling stations can reduce CO2 emissions cost-effectively.
CO2, emissions, fuel cell buses, BEV buses, renewables
false
Technology and Digital Transformation
Energy & Utilities energy-and-utilities
Multiple Chart
Kearney
View slide
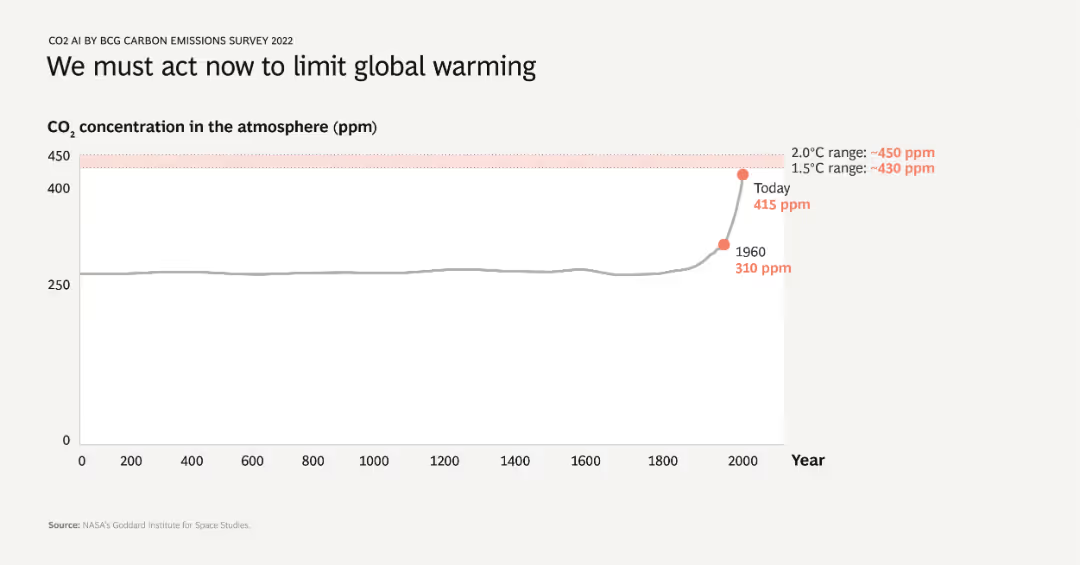
A line chart showing CO2 concentration in the atmosphere over time from year 0 to 2022. The chart highlights a significant increase in CO2 levels, especially after 1960, with today’s concentration at 415 ppm. The critical thresholds for 1.5°C and 2.0°C are also marked.
Market Analysis and Trends
Environmental Services & Sustainability
This slide emphasizes the urgent need to address global warming by illustrating the historical rise in atmospheric CO2 levels. It shows that current CO2 concentrations are dangerously high, surpassing thresholds that could limit global temperature increase.
CO2, global warming, climate change, historical data, critical thresholds
false
Market Analysis and Trends
Environmental Services & Sustainability environmental-services-and-sustainability
Single Chart
BCG
View slide
The slide features two column charts comparing storage cost curves for onshore and offshore CO2 storage in the US for 2017. The charts are labeled with percentages on the vertical axis and storage amounts on the horizontal axis.
Market Analysis and Trends
Energy & Utilities
The slide presents the storage cost curve for onshore and offshore CO2 storage in the US for 2017, highlighting that CO2 for EOR is at negative costs, and most of the onshore storage capacity in the US is available for less than $10 per ton of CO2.
CO2, storage, onshore, offshore, cost curve
false
Market Analysis and Trends
Energy & Utilities energy-and-utilities
Multiple Chart
Kearney
View slide
The slide includes two charts: one showing oil price scenarios and associated US CO2-EOR production forecasts, and another showing the proportion of CO2-EOR in total EOR production. The charts are color-coded with projections until 2040.
Market Analysis and Trends
Energy & Utilities
The slide analyzes the impact of oil prices on the demand for CO2-EOR projects and forecasts the production of CO2-EOR in the US, indicating potential future trends and challenges due to price fluctuations.
CO2-EOR, oil prices, production forecasts, US market, future trends
false
Market Analysis and Trends
Energy & Utilities energy-and-utilities
Multiple Chart
Kearney
View slide
The slide displays a table listing different CO2-based products, their compounds, and the current status of deployment, categorized into commercial, lab-scale, and demonstration stages. It uses color coding for each category.
Product and Service Analysis
Energy & Utilities
The slide provides a detailed overview of various CO2-based chemical products, their current development stages, and potential applications, highlighting the maturity levels of different pathways.
CO2-based products, chemical compounds, deployment status, maturity stages
false
Product and Service Analysis
Energy & Utilities energy-and-utilities
Table
Kearney
View slide
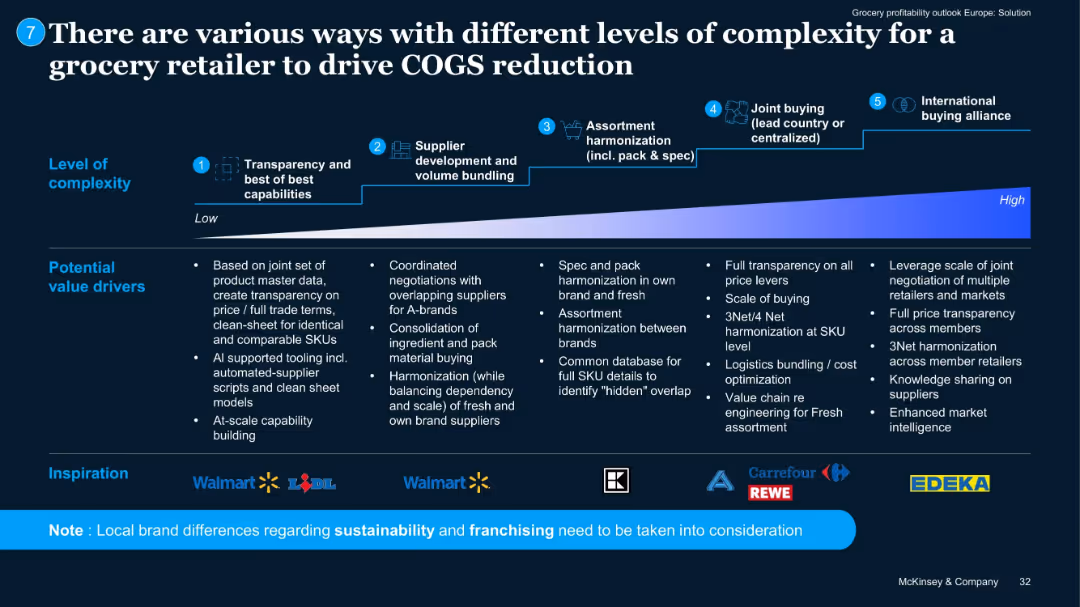
Horizontal flowchart from left to right illustrating 5 levels of complexity with icons/logos of retailers.
Operational Efficiency
Retail & E-commerce
Outlines a maturity curve for COGS reduction, from basic transparency to international alliances. Lists value drivers per stage. Shows examples from Walmart, Lidl, Carrefour, EDEKA, and others.
COGS strategy, sourcing, alliances, complexity, procurement
false
Operational Efficiency
Retail & E-commerce retail-and-e-commerce
Pillar
McKinsey
View slide
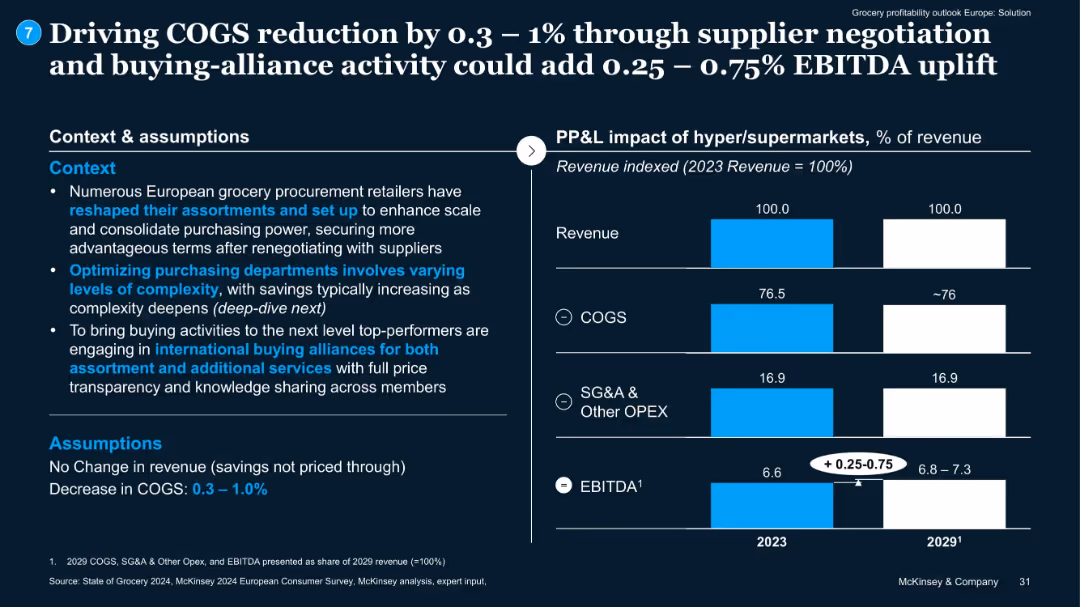
Text context on left, bar charts on right showing potential EBITDA gains from cost savings.
Pricing Strategies
Retail & E-commerce
Explains how improved supplier negotiations and alliances can lower COGS by 0.3–1%, raising EBITDA by 0.25–0.75%. No revenue change assumed.
COGS, EBITDA, supplier negotiation, buying alliances, pricing
false
Pricing Strategies
Retail & E-commerce retail-and-e-commerce
Mixed Chart
McKinsey
View slide
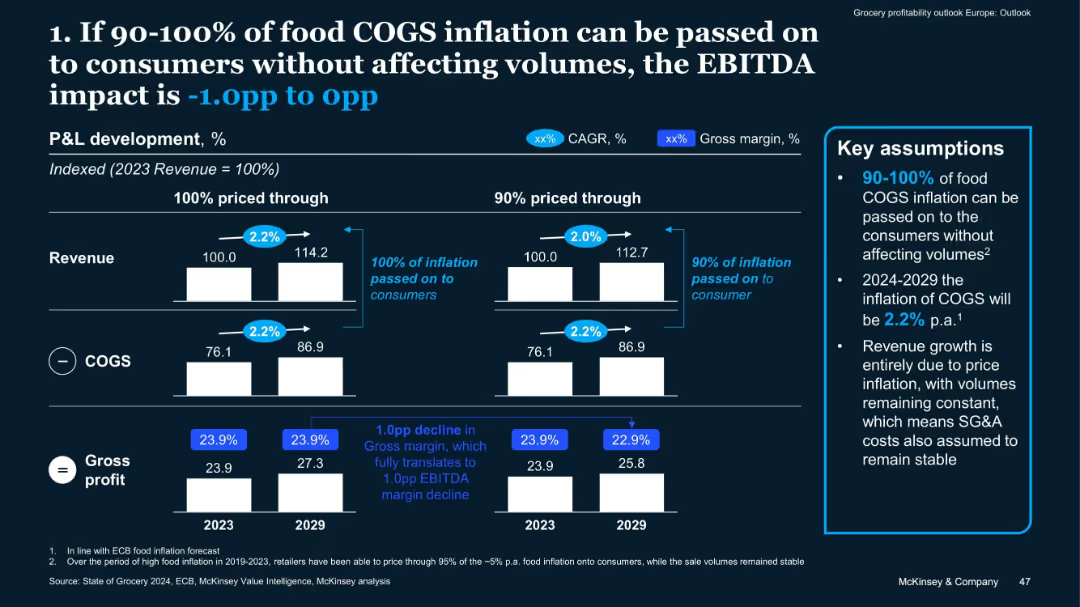
Comparative bar chart with 2 scenarios (100% vs 90% inflation pass-through); includes assumptions box
Risk Assessment and Management
Retail & E-commerce
This slide assesses the EBITDA impact of passing food COGS inflation to consumers. If 90–100% is passed through, EBITDA impact ranges from -1.0pp to 0pp. It assumes 2.2% annual inflation through 2029 with stable volumes and SG&A.
COGS, Inflation, Pricing Strategy, EBITDA, Food Retail, Pass-Through
false
Risk Assessment and Management
Retail & E-commerce retail-and-e-commerce
Mixed Chart
McKinsey
View slide
The slide features a bar chart and pie charts displaying cost structures and impact potential for an automotive supplier's typical P/L.
Financial Performance
Industrial & Manufacturing
Examines the cost structure of an automotive supplier, highlighting the significant share of COGS and the easier impact on SG&A in the short and medium term.
COGS, SG&A, automotive, costs, impact, P/L, financial performance, bar chart, pie chart
false
Financial Performance
Industrial & Manufacturing industrial-and-manufacturing
Single Chart
EY
View slide
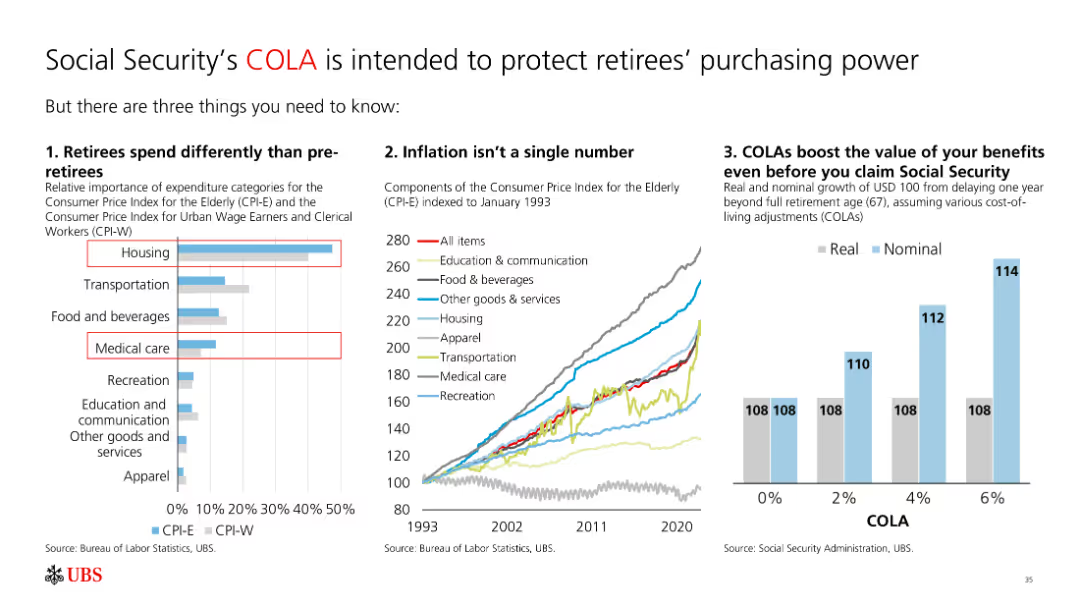
The slide features a bar chart, a line chart, and a column chart. It includes text and multiple visual elements like charts and graphs, making it moderately complex.
Regulatory and Compliance
Financial Services
The slide explains how cost-of-living adjustments (COLA) protect retirees' purchasing power by showing differences in spending, inflation impact, and benefits growth.
COLA, retirees, inflation, spending, benefits, purchasing power
false
Regulatory and Compliance
Financial Services financial-services
Multiple Chart
UBS
View slide
Features a structured checklist format outlining various governmental actions needed to meet COP26 ambitions, including strategies for decarbonization, energy transition costs, and green financing.
Regulatory and Compliance
Energy & Utilities
Details a comprehensive framework for government actions within SEA to build visibility and implement actionable plans that align with COP26 ambitions, focusing on regulatory, financial, and collaborative measures to facilitate the green transition.
COP26, Government Strategies, Decarbonization, SEA, Green Financing
false
Regulatory and Compliance
Energy & Utilities energy-and-utilities
Header Horizontal
Bain
View slide
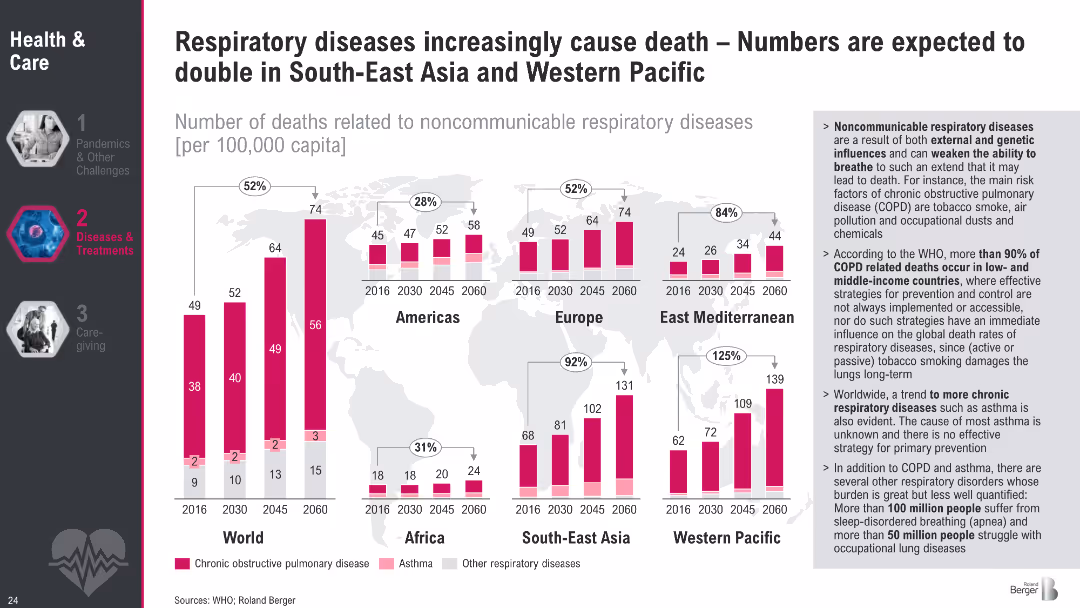
World map with bar charts per region showing death rates from respiratory diseases (2016–2060); sidebar with detailed insights; color-coded bars for disease types
Market Analysis and Trends
Healthcare & Pharmaceuticals
This slide presents global and regional projections of deaths from noncommunicable respiratory diseases, highlighting a sharp increase in South-East Asia and Western Pacific. It attributes the rise to environmental and behavioral risk factors and emphasizes disparities between high- and low-income countries.
COPD, respiratory diseases, regional projections, healthcare inequality, asthma, pollution, mortality, WHO, tobacco, healthcare trends
false
Market Analysis and Trends
Healthcare & Pharmaceuticals healthcare-and-pharmaceuticals
Multiple Chart
Roland Berger
View slide
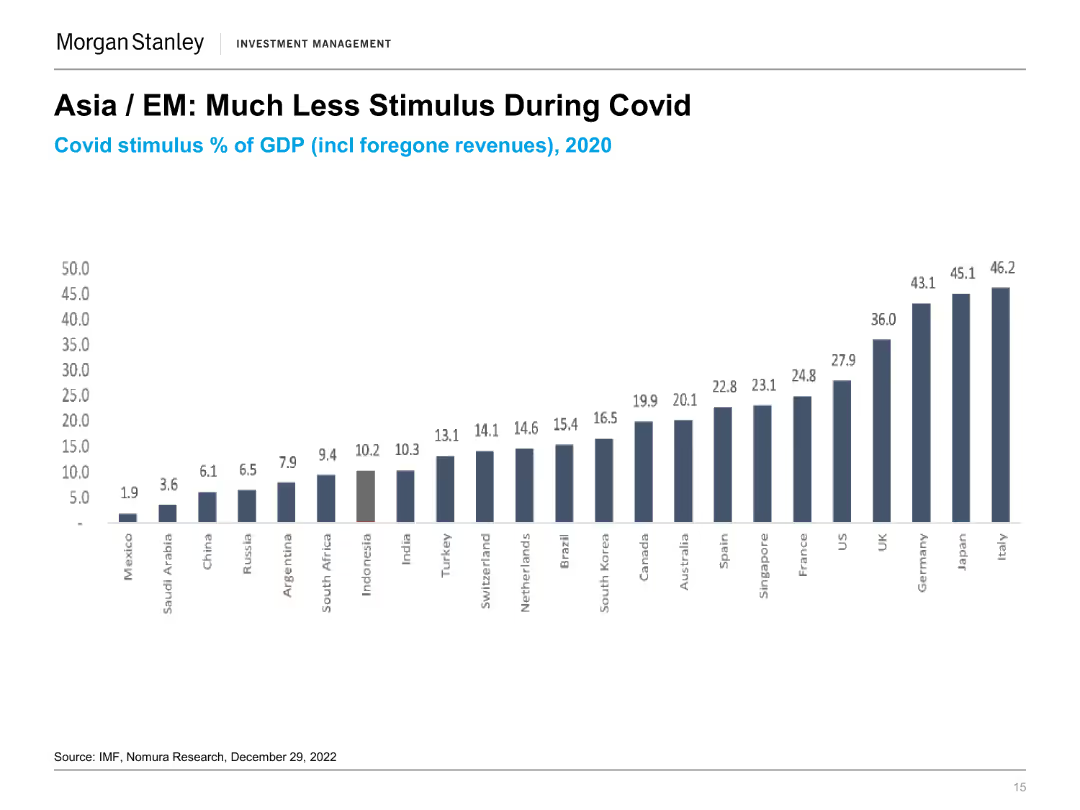
The slide presents a column chart showing the COVID stimulus as a percentage of GDP for various countries in 2020. Each column represents a different country with varying stimulus percentages.
Market Analysis and Trends
Financial Services
The slide compares the level of fiscal stimulus provided by different countries during the COVID-19 pandemic, highlighting the relatively lower stimulus in Asian and emerging markets.
COVID Stimulus, GDP, Fiscal Policy, Market Analysis, Economic Impact, Government Response, Comparative Analysis, Financial Services
false
Market Analysis and Trends
Financial Services financial-services
Single Chart
Morgan Stanley
View slide
Line graphs with mobility data indexed to pre-pandemic baselines.
Operational Efficiency
Technology & Software
Slide with mobility trends indicating consumer behavior change post-COVID restrictions. Useful for analyzing the impact on retail and hospitality industries.
COVID restrictions, consumer behavior, mobility data, retail, hospitality
false
Operational Efficiency
Technology & Software technology-and-software
Multiple Chart
Bain
View slide
Featuring a vertical bar graph, this slide depicts the timeline of COVID-19's impact on the US economy. Accompanying text boxes provide additional insights into investors' perspectives.
Market Analysis and Trends
Financial Services
Presents investors' beliefs on the diminishing economic impact of COVID-19, relevant for assessing market risks and investment approaches.
COVID-19 Impact, Economic Analysis, Investor Beliefs, Risk Assessment, Market Sentiment, Investment Decisions, Economic Recovery, Pandemic Effects, Health Crisis, Investment Strategies
false
Market Analysis and Trends
Financial Services financial-services
Single Chart
BCG
View slide
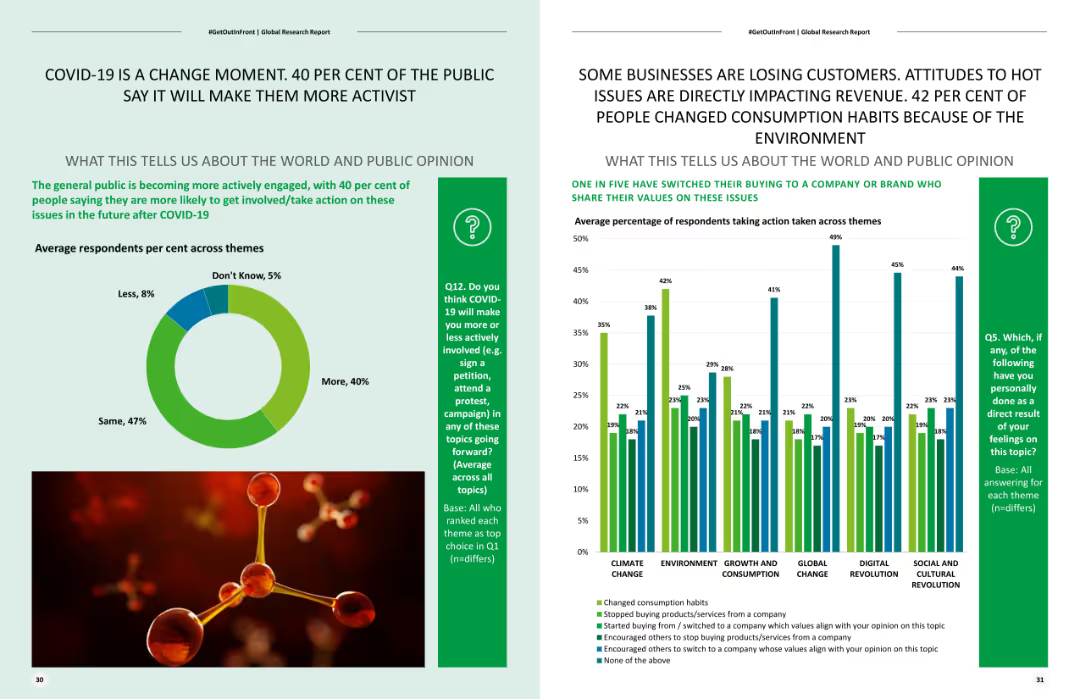
Includes a pie chart showing the distribution of expected future activism levels post-COVID-19 and a column chart on changes in consumption habits due to environmental concerns.
Risk Assessment and Management
Healthcare & Pharmaceuticals
Analyzes the impact of COVID-19 on future activism, illustrating how public sentiment towards activism has increased and affected consumer behavior.
COVID-19 impact, activism, consumer behavior, environmental concerns, future trends
false
Risk Assessment and Management
Healthcare & Pharmaceuticals healthcare-and-pharmaceuticals
Multiple Chart
Deloitte
View slide
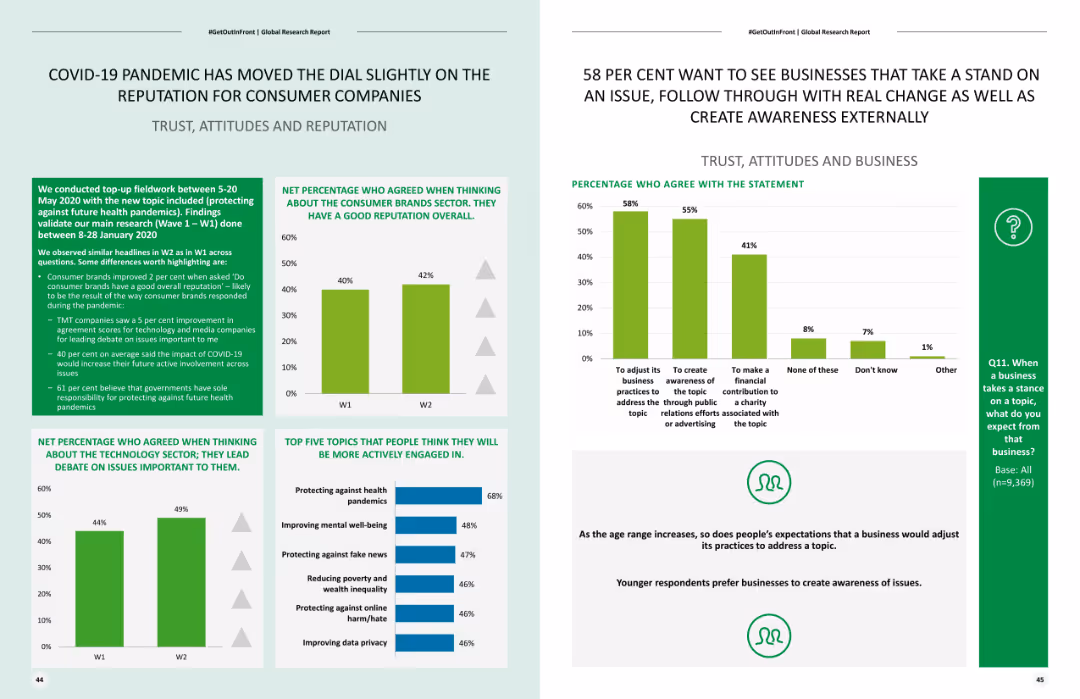
Displays column charts showing changes in reputation for consumer companies pre and post-COVID-19, and a list of top issues for future engagement.
Market Analysis and Trends
Consumer Goods
Examines how the COVID-19 pandemic has affected the reputation of consumer companies and identifies key areas for future engagement and public concerns.
COVID-19 impact, consumer companies, reputation, future engagement, public concerns
false
Market Analysis and Trends
Consumer Goods consumer-goods
Multiple Chart
Deloitte
View slide
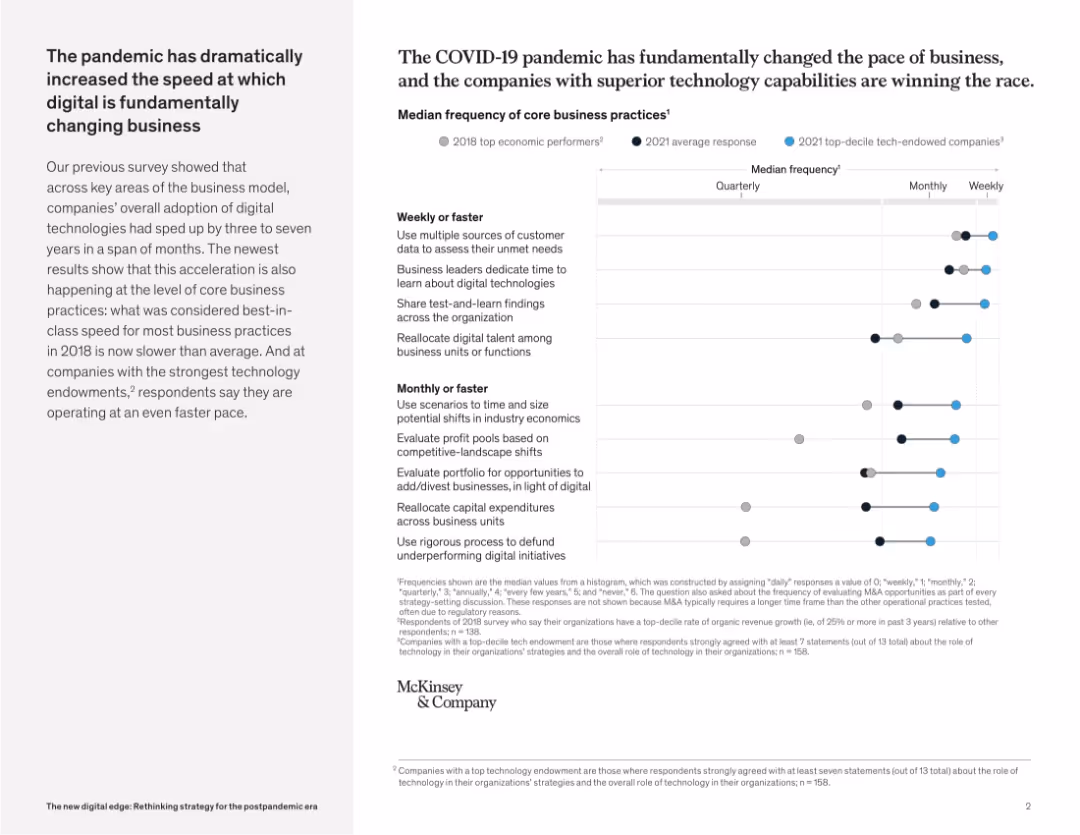
Right-heavy layout featuring dot plot chart comparing 2018 vs 2021 business process frequency across tech-maturity tiers. Left side contains narrative.
Market Analysis and Trends
Technology & Software
This slide demonstrates how COVID-19 accelerated digital transformation, especially in companies with strong tech capabilities. Business practices that were monthly in 2018 are now performed weekly, indicating a dramatic pace shift.
COVID-19 impact, digital acceleration, core processes, business transformation, tech capabilities, pace of change, pandemic disruption
false
Market Analysis and Trends
Technology & Software technology-and-software
Mixed Chart
McKinsey
View slide
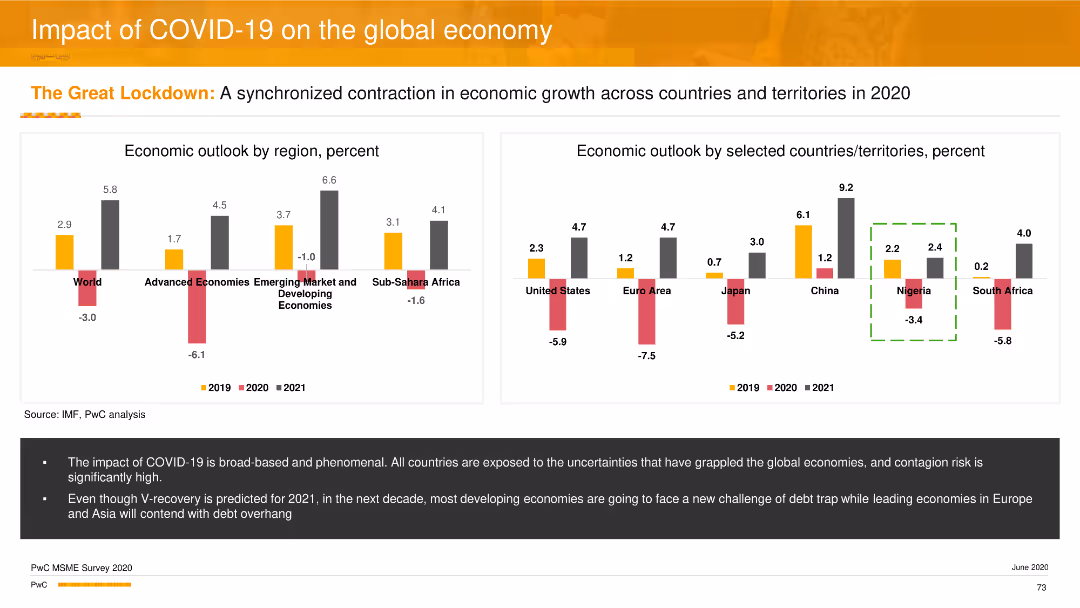
Two column charts showing the economic outlook by region and by selected countries for 2019, 2020, and 2021, highlighting the contraction due to COVID-19. Orange, grey, and black bars represent different years.
Risk Assessment and Management
Professional Services
This slide assesses the economic impact of COVID-19 globally, showing a synchronized contraction in economic growth across various regions and countries, with predictions for recovery in 2021.
COVID-19 impact, economic outlook, global economy, professional services, column chart
false
Risk Assessment and Management
Professional Services professional-services
Multiple Chart
PwC/Strategy&
View slide
A column chart showing employment losses in the first six months of 2020 across various Canadian metropolitan areas, highlighting the significant impact on Metro Vancouver.
Market Analysis and Trends
Professional Services
This slide presents the economic impact of COVID-19, focusing on employment losses in Canadian metropolitan areas, with a spotlight on the severe impact on Metro Vancouver.
COVID-19 impact, employment losses, Metro Vancouver, Canada
false
Market Analysis and Trends
Professional Services professional-services
Single Chart
Deloitte
View slide
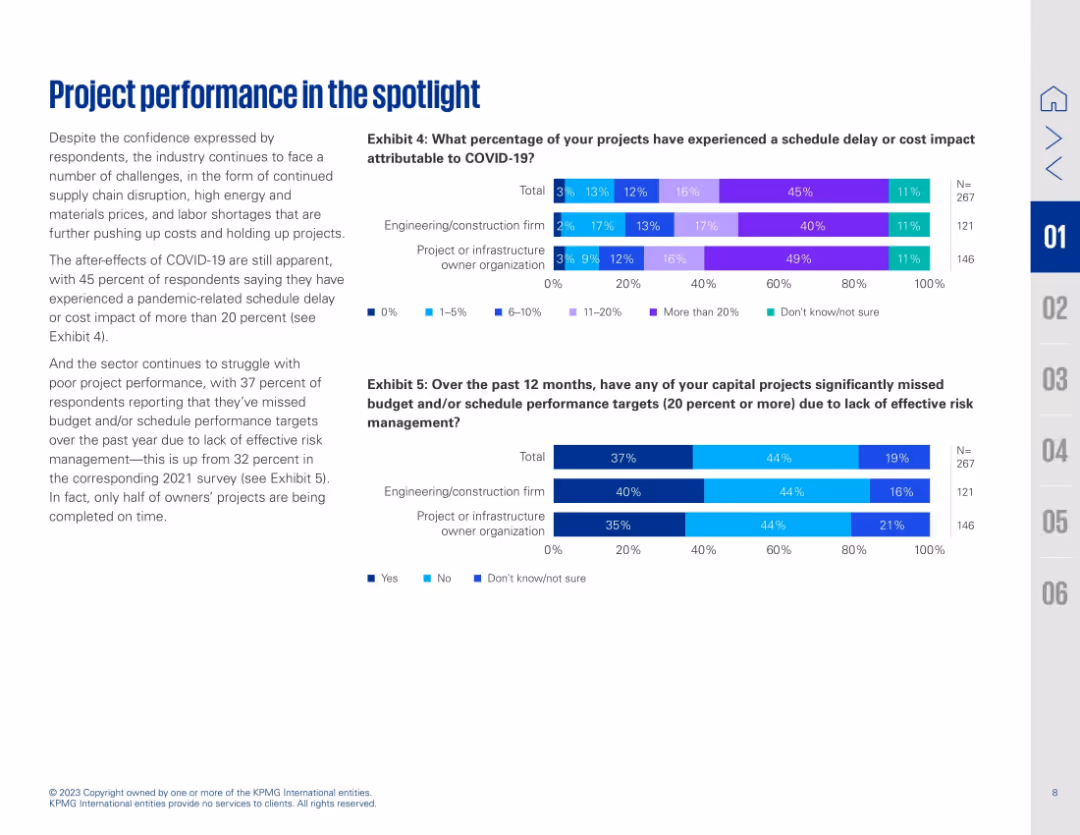
Two-column layout with text on the left and two horizontal bar charts on the right (Exhibits 4 & 5). Blue and purple gradient bars represent survey percentages.
Performance Metrics and KPIs
Real Estate & Construction
Highlights how COVID-19 continues to impact project performance, with many projects experiencing delays or cost increases. Exhibit 4 shows the extent of COVID-related schedule delays, while Exhibit 5 reveals that 37% of projects missed targets due to ineffective risk management. The slide emphasizes ongoing struggles in project delivery despite some return to confidence post-pandemic.
COVID-19 impact, project delay, cost overrun, risk management, schedule, survey data, construction, performance issues, engineering, metrics
false
Performance Metrics and KPIs
Real Estate & Construction real-estate-and-construction
Multiple Chart
KPMG
Previous
Loading...
Hold On!
We are searching in our database
If nothing, comes up, please try different filters!
Column Chart
Heatmap
Chevron
Org Chart
Infographic
Callouts
Timeline
List
Graphic
Picture
Process Flow
Diagram
Paragraph
Map
Table
Framework
Subtitle
Takeaway Box
Icon
Other Chart
Radar Chart
Waterfall Chart
Mekko Chart
Pie Chart
Scatter Plot
Line Chart
Bar chart
Bullet points
Create a FREE account to continue browsing
Receive Instant Access to 1,000+ slides from companies like McKinsey, Google, and Goldman Sachs
First Name
Last Name
Email
Password
I agree to all
Terms & Privacy Policy
Thank you! Your submission has been received!
Oops! Something went wrong while submitting the form.
Have an account?
Sign in
Upgrade to PRO to Save slides
Advanced Search and Filters
Access to 15,000+ slides
Access to Category Pages
Save/Bookmark Slides
PowerPoint Template Library
Pick a Plan
MONTHLY
$12/month
Billed every month, Cancel anytime.
YEARLY
$9/year
Billed $108 annually, Cancel anytime.
Checkout for $12/month
Checkout for $108/yr
Secured by Stripe | AES-256 bit encryption