My Account
My Slides
Search by Category
Templates
View All Templates
Download Template Slides
Leave Feedback
Login
Logout
Get Started
Browse all Slides
Browse all Slides
Create a FREE Account
Instant access to 1,000+ real slides from top companies like McKinsey, BCG, Goldman Sachs, Google and many more!
First Name
Last Name
Email
Password
I agree to all
Terms & Privacy Policy
Thank you! Your submission has been received!
Oops! Something went wrong while submitting the form.
Have an account?
Sign in
Spark Your Next Big Idea with New Presentation Templates
VIEW ALL Templates
Welcome,
Welcome
PRO
Show Featured Only
Checkbox 8
Companies
Mckinsey
Bain
BCG
EY
Deloitte
Accenture
PwC/Strategy&
JP Morgan
Goldman Sachs
Morgan Stanley
Citigroup
Deutsche Bank
Barclays
LEK
KPMG
Kearney
Oliver Wyman
Booz Allen Hamilton
Gartner
IPSOS
Nielsen
Slide type
Text Only
Linear Flow
Vertical Flow
Single Chart
Header Horizontal
Mixed Chart
Header Vertical
Pillar
Multiple Chart
Graphic
Agenda
Title
Table
Framework
Industry
Technology & Software
Artificial Intelligence
Financial Services
Retail & E-commerce
Consumer Goods
Industrial & Manufacturing
Transportation & Logistics
Telecommunications
Real Estate & Construction
Hospitality & Tourism
Professional Services
Education & Training
Media & Entertainment
Agriculture & Food Production
Healthcare & Pharmaceuticals
Environmental Services & Sustainability
Government & Public Sector
Use Case
Mergers and Acquisitions
Performance Metrics and KPIs
Client Case Studies
Competitive Landscape
Corporate Finance and Valuation
Product and Service Analysis
Customer and Market Segmentation
Organizational Structure and Change
Industry Overview
Regulatory and Compliance
Risk Assessment and Management
Investment Analysis
Organizational Structure and Change
Human Resources and Talent Management
Financial Performance
Market Analysis and Trends
Sales and Business Development
Human Resources and Talent Management
Clear all
Thank you! Your submission has been received!
Oops! Something went wrong while submitting the form.
Tag
View slide
Depicts a woman and child shopping online, with a bold purple title indicating a focus on COVID-19's impact on retail consumers.
Market Analysis and Trends
Retail & E-commerce
Introduces a report on how COVID-19 has altered consumer behavior, specifically in the retail sector, with data-driven insights.
COVID-19, consumer behavior, retail, market research, data-driven insights, consumer insights
false
Market Analysis and Trends
Retail & E-commerce retail-and-e-commerce
Title
Accenture
View slide
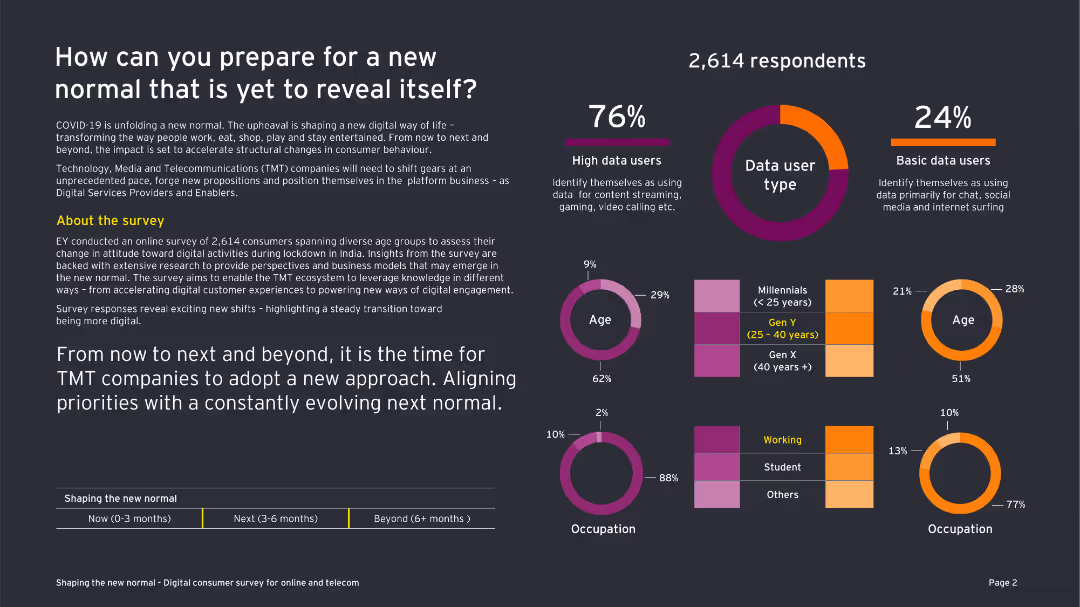
This slide features a combination of text and various charts including a column chart, pie chart, and doughnut chart. The design is moderately dense.
Market Analysis and Trends
Telecommunications
The slide discusses the impact of COVID-19 on consumer behavior in the telecommunications sector, using survey data from 2,614 respondents.
COVID-19, consumer behavior, telecommunications, survey, data usage, TMT companies, new normal, digital engagement, technology
false
Market Analysis and Trends
Telecommunications telecommunications
Multiple Chart
EY
View slide
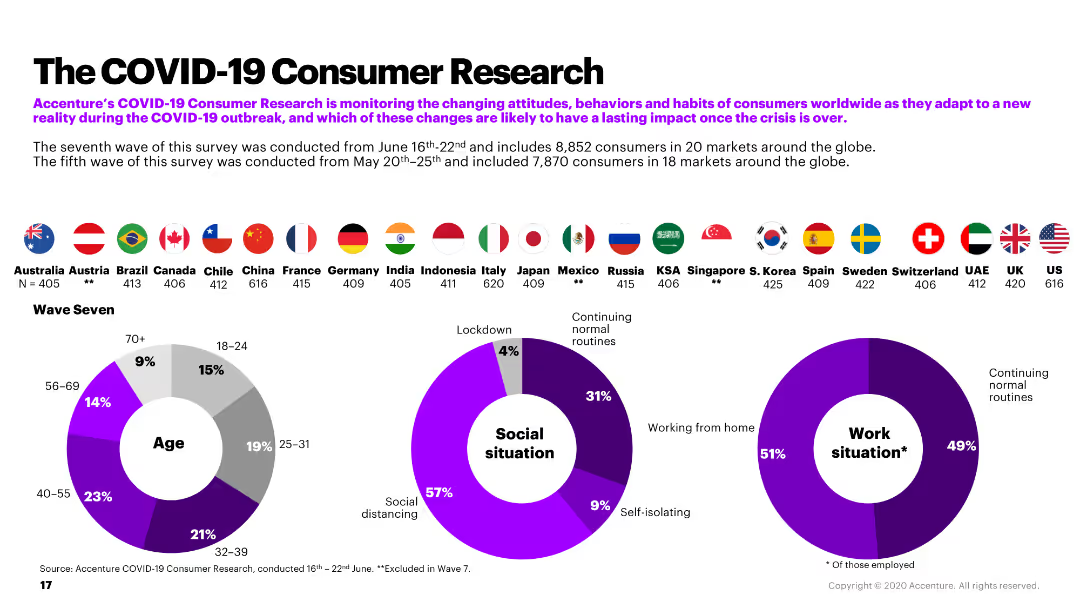
The slide includes a combination of pie charts and country flags, summarizing the demographic and situational data from Accenture's COVID-19 consumer research.
Market Analysis and Trends
Retail & E-commerce
The slide provides an overview of Accenture's COVID-19 consumer research, detailing demographics, social situations, and work situations during the pandemic.
COVID-19, consumer research, demographics, social situation, work situation
false
Market Analysis and Trends
Retail & E-commerce retail-and-e-commerce
Multiple Chart
Accenture
View slide
Bar charts showing U.S. consumer willingness to resume activities post-lockdown under various conditions, with observations on current sentiment.
Strategic Planning
Financial Services
Surveys U.S. consumer sentiment on resuming everyday activities post-COVID-19 lockdown, indicating varied readiness depending on conditions.
COVID-19, consumer sentiment, U.S., activities, lockdown, behavior analysis, readiness, conditions
false
Strategic Planning
Financial Services financial-services
Multiple Chart
BCG
View slide
Line graph comparing consumer sentiment over time in five countries regarding the ongoing impact of COVID-19.
Market Analysis and Trends
Consumer Goods
Tracks changes in consumer sentiment during the COVID-19 pandemic across different regions, useful for market analysis in consumer goods industries.
COVID-19, consumer sentiment, market analysis, trends, regions
false
Market Analysis and Trends
Consumer Goods consumer-goods
Single Chart
BCG
View slide
A large multi-colored area graph dominates this slide, charting the increase in daily COVID-19 cases by region from March to December. The background is gray, and each region (like North America, South America) is represented in a different color, with key data points highlighted on the graph.
Strategic Planning
Healthcare & Pharmaceuticals
Details the dramatic increase in COVID-19 cases globally with a focus on recent months. It provides a visual analysis of the pandemic's surge in different regions, emphasizing the growth in cases and the ongoing challenges in managing the spread.
COVID-19, daily cases, global, regions, pandemic, trends, healthcare
false
Strategic Planning
Healthcare & Pharmaceuticals healthcare-and-pharmaceuticals
Single Chart
BCG
View slide
Slide includes multiple column charts comparing COVID-19 death rates and case growth across top countries, emphasizing European and North American data.
Risk Assessment and Management
Healthcare & Pharmaceuticals
Analyzes COVID-19 death rates per capita in top affected countries, particularly in Europe and North America, and discusses the trends in new cases, offering insights into the pandemic's regional impacts as of June 2020.
COVID-19, death rates, Europe, North America
false
Risk Assessment and Management
Healthcare & Pharmaceuticals healthcare-and-pharmaceuticals
Mixed Chart
McKinsey
View slide
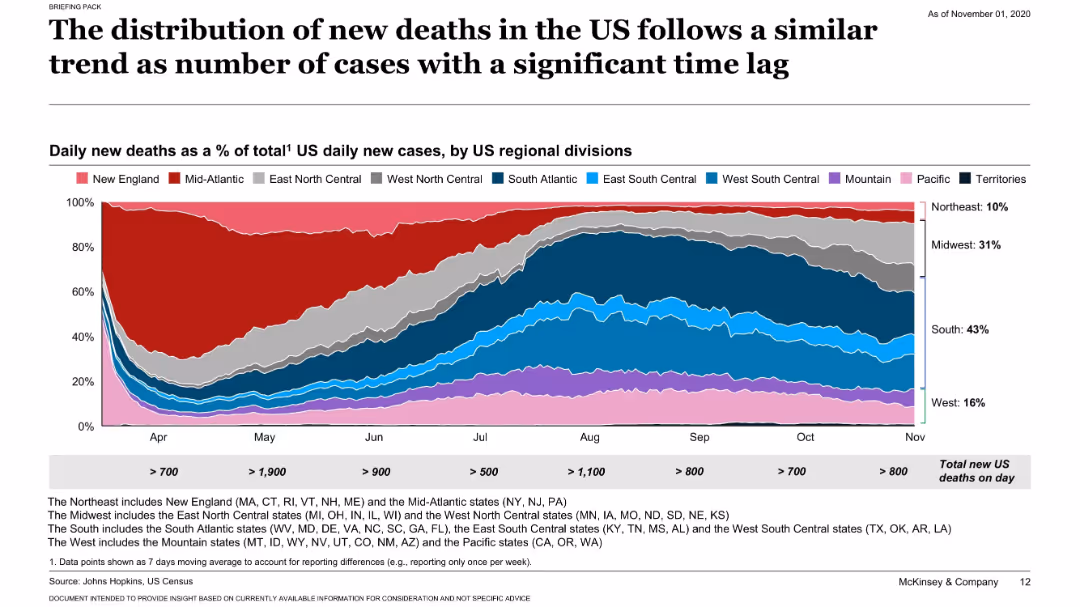
Similar stacked area chart as slide 17401, but for daily new deaths instead of cases.
Market Analysis and Trends
Healthcare & Pharmaceuticals
Displays a delayed but similar regional shift in new COVID-19 deaths across the US, suggesting a lagging correlation with the rise in cases seen in earlier months.
COVID-19, deaths, regional analysis, time lag, US trends
false
Market Analysis and Trends
Healthcare & Pharmaceuticals healthcare-and-pharmaceuticals
Single Chart
McKinsey
View slide
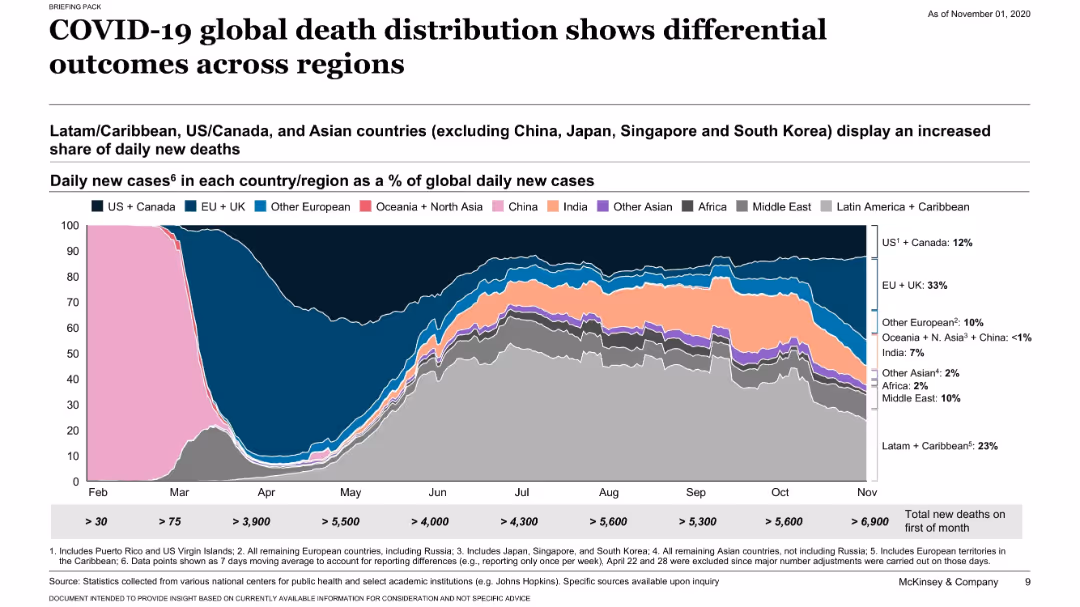
Similar layout to previous slide but for death rates; stacked area chart showing daily deaths by region; regional shares labeled.
Risk Assessment and Management
Healthcare & Pharmaceuticals
This slide compares global COVID-19 death distribution across regions. It shows that Latin America, the US/Canada, and Asian countries have increasing shares of daily new deaths, suggesting varied regional outcomes.
COVID-19, deaths, regional comparison, mortality, McKinsey, pandemic, distribution
false
Risk Assessment and Management
Healthcare & Pharmaceuticals healthcare-and-pharmaceuticals
Single Chart
McKinsey
View slide
This slide compares the percentage of respondents engaging in online activities before and after COVID-19 with bar graphs and a textual summary.
Market Analysis and Trends
Technology & Software
It shows how the pandemic increased online engagement and awareness, crucial for understanding consumer behavior changes and market opportunities.
COVID-19, digital adoption, online activities, market analysis, consumer behavior, awareness, engagement, pandemic
false
Market Analysis and Trends
Technology & Software technology-and-software
Multiple Chart
Kearney
View slide
With a deep purple backdrop, the slide includes vertical bar graphs illustrating pre and post-COVID-19 online activity changes.
Market Analysis and Trends
Technology & Software
Highlights the amplified use of telehealth, online learning, shopping, and government services on the nbn network as a result of COVID-19.
COVID-19, digital alternatives, nbn network, online activities, telehealth, online learning, government services
false
Market Analysis and Trends
Technology & Software technology-and-software
Multiple Chart
Accenture
View slide
Three-column chart with icons: a clock (>80% more urgent), a hand with a dollar sign (~65% anticipate more investments), and a gear (priorities on remote work and automation).
Market Analysis and Trends
Technology & Software
Highlights increased urgency and investment in digital transformation post-COVID-19. Useful for discussing strategic planning in technology adoption and operational adjustments within businesses.
COVID-19, digital transformation, investment, remote work, cybersecurity, marketing, automation
false
Market Analysis and Trends
Technology & Software technology-and-software
Pillar
BCG
View slide
The slide contains an area chart showing the projected economic impact of COVID-19 on New York's GDP, compared to the pre-COVID baseline. It visually represents data points through shading and text annotations to highlight key figures like total economic loss.
Financial Performance
Government & Public Sector
Provides detailed projections of the economic impact of COVID-19 on New York, including total loss and timeline to recovery. Valuable for discussions on fiscal planning and economic strategies in response to pandemics.
COVID-19, economic impact, GDP, New York, projections, recovery, fiscal planning
false
Financial Performance
Government & Public Sector government-and-public-sector
Mixed Chart
BCG
View slide
The slide features a column chart and line graph visualizing the Philippine economy's GDP growth, unemployment trends, and PSE Index values during the COVID-19 pandemic.
Market Analysis and Trends
Government & Public Sector
Analyzes the economic impact of COVID-19 on the Philippines, detailing GDP changes, unemployment rates, and stock market performance.
COVID-19, economic impact, Philippines, GDP, unemployment, stock market, column chart, line graph
false
Market Analysis and Trends
Government & Public Sector government-and-public-sector
Mixed Chart
Deloitte
View slide
Color-coded matrix showing potential economic impacts in the U.S. based on different lengths of COVID-19 suppression and associated economic downturns.
Financial Performance
Financial Services
Analyzes the potential economic losses from COVID-19 in the U.S. under various suppression scenario lengths, useful for financial planning and analysis.
COVID-19, economic impact, financial analysis, suppression, U.S., scenarios, losses, planning
false
Financial Performance
Financial Services financial-services
Table
BCG
View slide
Slide shows bar graphs comparing economic conditions globally, with a focus on how perceptions have shifted over the last six months.
Market Analysis and Trends
Financial Services
Discusses the economic impact of COVID-19 worldwide, showing trends in economic perception and conditions over recent months. Essential for financial analysts and economic forecasters.
COVID-19, economic impact, global economy, market conditions, financial analysis, trend analysis
false
Market Analysis and Trends
Financial Services financial-services
Multiple Chart
McKinsey
View slide
This slide presents multiple data visualizations, including bar charts and line graphs, tracking COVID-19's impact on various factors like mobility, economic forecasts, and consumer activity from August to November. Each section uses a different color to denote the type of data being represented, like green for mobility and red for GDP.
Strategic Planning
Financial Services
Summarizes key metrics affected by COVID-19, such as global epidemic progression, mobility trends, GDP forecasts, and stock market performance. It provides a comprehensive overview of how different sectors and regions are recovering from the pandemic impacts.
COVID-19, economic impact, healthcare, GDP, mobility, stock markets
false
Strategic Planning
Financial Services financial-services
Mixed Chart
BCG
View slide
Detailed diagrams and calculations explaining the methodology to estimate economic impact of COVID-19 by combining sectoral data with expected duration of crisis measures.
Strategic Planning
Financial Services
Explores the methodology to estimate economic impacts of COVID-19, combining industry-specific data with projected lengths of lockdowns and restrictions.
COVID-19, economic impact, sectoral analysis, lockdown duration, crisis measures, economic methodology
false
Strategic Planning
Financial Services financial-services
Multiple Chart
BCG
View slide
Highly data-centric slide with graphs, charts, and bullet points presenting various leading indicators for economic recovery.
Performance Metrics and KPIs
Technology & Software
Provides a detailed dashboard of leading indicators related to COVID-19's economic impact in China, valuable for analysts and strategists.
COVID-19, economic indicators, China, Hubei, recovery tracking, consumer confidence, economic restart
false
Performance Metrics and KPIs
Technology & Software technology-and-software
Multiple Chart
McKinsey
View slide
Bar charts displaying U.S. employment and revenue by sector during COVID-19, segmented by contact intensity and susceptibility to lockdown measures.
Market Analysis and Trends
Professional Services
Examines the impact of COVID-19 on various U.S. economic sectors, offering insights into employment and revenue changes under different restrictions.
COVID-19, economic sectors, employment, revenue, U.S., impact analysis, lockdown, sector analysis
false
Market Analysis and Trends
Professional Services professional-services
Multiple Chart
BCG
View slide
This slide is split into two halves. The left side has a line graph titled "Global mobility at retail and recreation sites," showing a trend over time with activity levels relative to January 2020. The right side has a combined column and line graph titled "Zoom meetings vs workplace visits in person" comparing Zoom's revenue against workplace visits, with the latter indicated by bars and the former by a line. The background is white with a blue header.
Investment Analysis
Financial Services
The slide evaluates the impact of COVID-19 on the economy by comparing global mobility data with corporate earnings from a company like Zoom. It indicates a shift in the economy, with digital communication platforms becoming more significant as traditional mobility patterns change. This slide would be useful for financial analysts and investors considering the implications of COVID-19 on market trends, operational shifts, and investment decisions in the technology and service sectors.
COVID-19, economy, global mobility, Zoom, workplace visits, digital communication, market trends, operational shifts
false
Investment Analysis
Financial Services financial-services
Multiple Chart
Citigroup
View slide
A bar graph displays the number of school days lost in different regions due to COVID-19, with dual-color bars representing fully and partially closed schools.
Market Analysis and Trends
Education & Training
This slide quantifies the educational disruption caused by COVID-19, showcasing the number of school days lost in different regions globally. It highlights the long-term effects on educational equality and economic impact.
COVID-19, education, impact, school closures
false
Market Analysis and Trends
Education & Training education-and-training
Mixed Chart
Roland Berger
View slide
Features a complex multi-line graph illustrating different response strategies and epidemic trajectories by country with color-coded lines and icons representing national flags.
Strategic Planning
Healthcare & Pharmaceuticals
Compares COVID-19 response strategies and their effectiveness across various countries, highlighting different stages of epidemic control and potential end-state strategies.
COVID-19, epidemic curve, country comparison, response strategies, healthcare policy, international
false
Strategic Planning
Healthcare & Pharmaceuticals healthcare-and-pharmaceuticals
Mixed Chart
McKinsey
View slide
Two distinct graphs are shown. The first graph plots daily growth rates of total cases with a log scale of confirmed cases, categorizing countries by their cases doubling rate. The second graph displays cumulative number of confirmed cases for selected countries with a curve that shows the progression over days.
Market Analysis and Trends
Healthcare & Pharmaceuticals
This slide visualizes the COVID-19 case growth trends and containment efforts across different countries, useful for analyzing epidemic progression and virus monitoring.
COVID-19, epidemic progression, virus monitoring, case growth, containment efforts, daily growth rate, cumulative cases, log scale
false
Market Analysis and Trends
Healthcare & Pharmaceuticals healthcare-and-pharmaceuticals
Multiple Chart
BCG
View slide
Contains stacked area chart and a line chart displaying global COVID-19 cases over time. Utilizes a color gradient for different continents.
Regulatory and Compliance
Healthcare & Pharmaceuticals
Slide presents global COVID-19 epidemic progression with a focus on daily cases and cumulative totals by region. Analyzes trends in case growth rates.
COVID-19, epidemic, cases, global, trends
false
Regulatory and Compliance
Healthcare & Pharmaceuticals healthcare-and-pharmaceuticals
Multiple Chart
BCG
View slide
Line chart comparing daily COVID-19 cases per million among the world's largest economies, annotated with key statistics on recent tests and case trends.
Regulatory and Compliance
Healthcare & Pharmaceuticals
Provides a comparative analysis of COVID-19 impact in major economies, focusing on daily cases per million and testing rates.
COVID-19, epidemiology, economies, cases
false
Regulatory and Compliance
Healthcare & Pharmaceuticals healthcare-and-pharmaceuticals
Single Chart
BCG
View slide
Slide displays a line graph showing an epidemic curve with stages marked by circles, and a dotted line representing potential future scenarios, set against a dark background.
Strategic Planning
Healthcare & Pharmaceuticals
Discusses the uncertainty in long-term COVID-19 spread and potential outcomes depending on public health decisions. Useful for strategic planning in healthcare and government policy-making.
COVID-19, epidemiology, healthcare capacity, epidemic curve, public health, future scenarios
false
Strategic Planning
Healthcare & Pharmaceuticals healthcare-and-pharmaceuticals
Single Chart
McKinsey
View slide
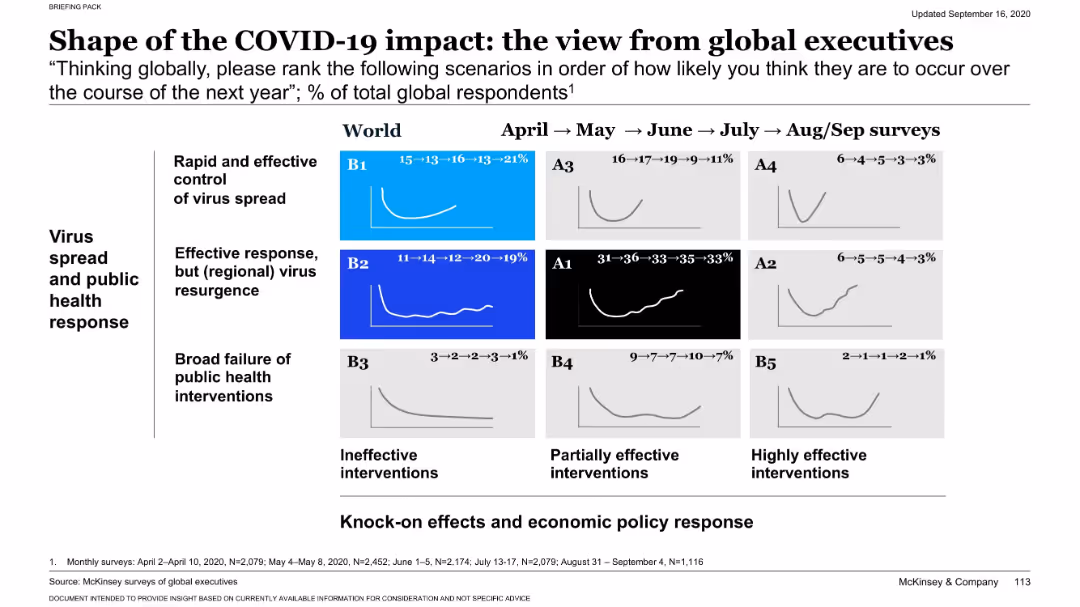
This slide includes a series of mini line charts depicting global executive opinions on various potential outcomes of the COVID-19 impact over the next year.
Risk Assessment and Management
Healthcare & Pharmaceuticals
Provides insights into executive expectations globally on public health response effectiveness and the potential scenarios regarding virus control or resurgence.
COVID-19, executive insights, health response, scenarios, impact
false
Risk Assessment and Management
Healthcare & Pharmaceuticals healthcare-and-pharmaceuticals
Multiple Chart
McKinsey
View slide
Matrix view of scenarios with color-coded probability rankings from surveys over several months.
Market Analysis and Trends
Government & Public Sector
Survey data from global executives ranks COVID-19 recovery scenarios by likelihood. The A1 (virus resurgence, muted recovery) scenario holds the highest probability, reflecting executive concerns over recurrence and slow recovery as of August/September 2020.
COVID-19, executive survey, scenario ranking, impact, probability, recovery, virus resurgence, muted growth
false
Market Analysis and Trends
Government & Public Sector government-and-public-sector
Single Chart
McKinsey
View slide
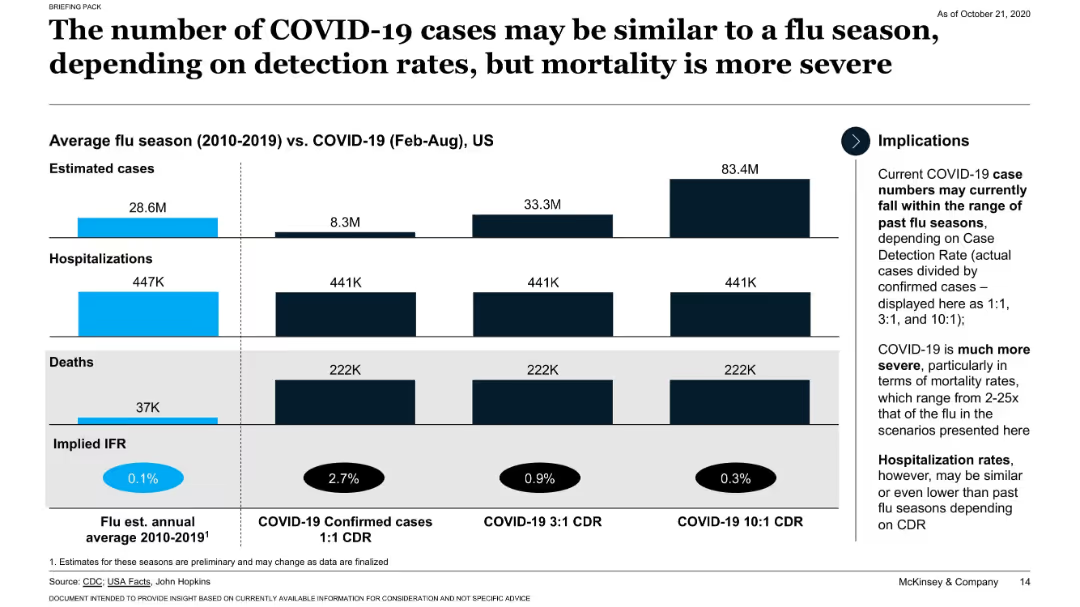
Side-by-side bar comparisons for flu vs. COVID-19 metrics across three case detection ratios (CDRs), with implications on right.
Strategic Planning
Healthcare & Pharmaceuticals
Compares COVID-19 and flu seasons in terms of estimated cases, hospitalizations, and deaths under varying detection assumptions. Highlights the much higher implied fatality rate for COVID-19 under all modeled detection scenarios.
COVID-19, flu comparison, hospitalizations, case detection, IFR
false
Strategic Planning
Healthcare & Pharmaceuticals healthcare-and-pharmaceuticals
Mixed Chart
McKinsey
Previous
Loading...
Hold On!
We are searching in our database
If nothing, comes up, please try different filters!
Column Chart
Heatmap
Chevron
Org Chart
Infographic
Callouts
Timeline
List
Graphic
Picture
Process Flow
Diagram
Paragraph
Map
Table
Framework
Subtitle
Takeaway Box
Icon
Other Chart
Radar Chart
Waterfall Chart
Mekko Chart
Pie Chart
Scatter Plot
Line Chart
Bar chart
Bullet points
Create a FREE account to continue browsing
Receive Instant Access to 1,000+ slides from companies like McKinsey, Google, and Goldman Sachs
First Name
Last Name
Email
Password
I agree to all
Terms & Privacy Policy
Thank you! Your submission has been received!
Oops! Something went wrong while submitting the form.
Have an account?
Sign in
Upgrade to PRO to Save slides
Advanced Search and Filters
Access to 15,000+ slides
Access to Category Pages
Save/Bookmark Slides
PowerPoint Template Library
Pick a Plan
MONTHLY
$12/month
Billed every month, Cancel anytime.
YEARLY
$9/year
Billed $108 annually, Cancel anytime.
Checkout for $12/month
Checkout for $108/yr
Secured by Stripe | AES-256 bit encryption