My Account
My Slides
Search by Category
Templates
View All Templates
Download Template Slides
Leave Feedback
Login
Logout
Get Started
Browse all Slides
Browse all Slides
Create a FREE Account
Instant access to 1,000+ real slides from top companies like McKinsey, BCG, Goldman Sachs, Google and many more!
First Name
Last Name
Email
Password
I agree to all
Terms & Privacy Policy
Thank you! Your submission has been received!
Oops! Something went wrong while submitting the form.
Have an account?
Sign in
Spark Your Next Big Idea with New Presentation Templates
VIEW ALL Templates
Welcome,
Welcome
PRO
Show Featured Only
Checkbox 8
Companies
Mckinsey
Bain
BCG
EY
Deloitte
Accenture
PwC/Strategy&
JP Morgan
Goldman Sachs
Morgan Stanley
Citigroup
Deutsche Bank
Barclays
LEK
KPMG
Kearney
Oliver Wyman
Booz Allen Hamilton
Gartner
IPSOS
Nielsen
Slide type
Text Only
Linear Flow
Vertical Flow
Single Chart
Header Horizontal
Mixed Chart
Header Vertical
Pillar
Multiple Chart
Graphic
Agenda
Title
Table
Framework
Industry
Technology & Software
Artificial Intelligence
Financial Services
Retail & E-commerce
Consumer Goods
Industrial & Manufacturing
Transportation & Logistics
Telecommunications
Real Estate & Construction
Hospitality & Tourism
Professional Services
Education & Training
Media & Entertainment
Agriculture & Food Production
Healthcare & Pharmaceuticals
Environmental Services & Sustainability
Government & Public Sector
Use Case
Mergers and Acquisitions
Performance Metrics and KPIs
Client Case Studies
Competitive Landscape
Corporate Finance and Valuation
Product and Service Analysis
Customer and Market Segmentation
Organizational Structure and Change
Industry Overview
Regulatory and Compliance
Risk Assessment and Management
Investment Analysis
Organizational Structure and Change
Human Resources and Talent Management
Financial Performance
Market Analysis and Trends
Sales and Business Development
Human Resources and Talent Management
Clear all
Thank you! Your submission has been received!
Oops! Something went wrong while submitting the form.
Tag
View slide
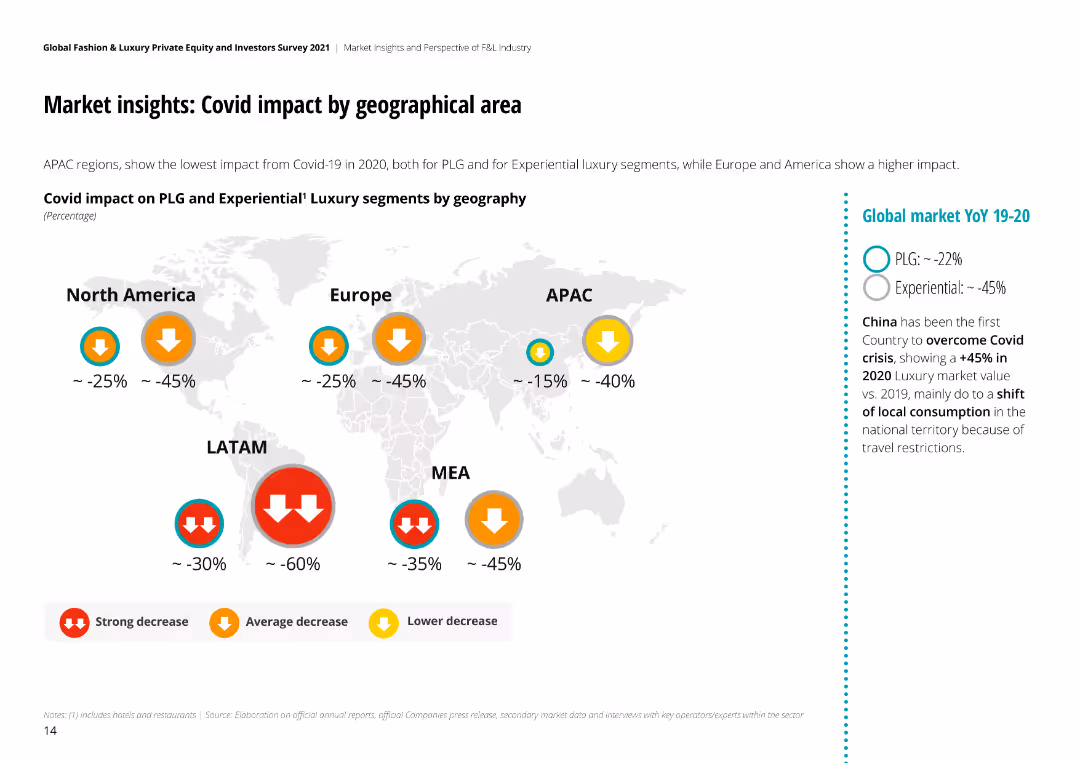
The slide includes a world map with color-coded arrows indicating the degree of COVID-19 impact on luxury markets by region, along with textual analysis.
Market Analysis and Trends
Retail & E-commerce
Examines the geographical impact of COVID-19 on the luxury market, comparing regions such as North America, Europe, APAC, LATAM, and MEA.
COVID-19, geographical impact, luxury, market, retail, e-commerce, regions, analysis
false
Market Analysis and Trends
Retail & E-commerce retail-and-e-commerce
Graphic
Deloitte
View slide
World map with data points and legends indicating COVID-19 spread and statistics, high visual complexity.
Risk Assessment and Management
Healthcare & Pharmaceuticals
Global dashboard showing the spread and impact of COVID-19, useful for risk assessment and international response planning.
COVID-19, global dashboard, transmission, pandemic, risk management, health crisis, leading indicators
false
Risk Assessment and Management
Healthcare & Pharmaceuticals healthcare-and-pharmaceuticals
Graphic
McKinsey
View slide
Features multiple small graphs showing different predicted scenarios for virus control globally, based on executive surveys over time.
Market Analysis and Trends
Healthcare & Pharmaceuticals
Provides a global perspective on expected COVID-19 outcomes, summarizing executive opinions and highlighting the variability in expected virus control scenarios.
COVID-19, global expectations, public health response, executive survey, virus outcomes, scenario analysis
false
Market Analysis and Trends
Healthcare & Pharmaceuticals healthcare-and-pharmaceuticals
Multiple Chart
McKinsey
View slide
The slide displays a complex array of data including graphs, charts, and tables summarizing various impacts of COVID-19 globally. It includes a variety of visual elements like color-coded sections, numerical indicators, and brief text explanations to convey information effectively.
Industry Overview
Financial Services
This comprehensive dashboard captures the global impact of COVID-19 across multiple dimensions, including epidemic progression, consumer activity, economic effects, and business impacts. It provides a snapshot of changes over time, offering insights into how different regions and sectors are navigating the pandemic.
COVID-19, global impact, economic effects, consumer behavior, business impacts, epidemic data, dashboard
false
Industry Overview
Financial Services financial-services
Mixed Chart
BCG
View slide
Timeline showing different countries' responses to COVID-19 with a focus on lockdown measures and case doubling times.
Regulatory and Compliance
Government & Public Sector
Examines the timing and types of responses implemented by various countries to the COVID-19 pandemic, useful for comparative policy analysis and planning.
COVID-19, global response, lockdown, policy, timeline
false
Regulatory and Compliance
Government & Public Sector government-and-public-sector
Mixed Chart
BCG
View slide
This slide presents a world map colored to indicate COVID-19 case numbers and deaths as of July 2020, with detailed statistics for each region.
Market Analysis and Trends
Healthcare & Pharmaceuticals
Provides an overview of global COVID-19 cases and deaths, highlighting significant data points and trends as of July 2020, useful for understanding the pandemic’s international impact at that time.
COVID-19, global, cases, deaths, 2020
false
Market Analysis and Trends
Healthcare & Pharmaceuticals healthcare-and-pharmaceuticals
Graphic
McKinsey
View slide
Multiple small graphs displaying the effect of various government actions on COVID-19 case growth rates across different countries, using a day-by-day comparison.
Regulatory and Compliance
Government & Public Sector
Assesses the impact of measures like school closures and travel restrictions on the COVID-19 spread, useful for policymakers and public health officials.
COVID-19, government response, public health, measures, effectiveness, policy, case reduction, spread, actions
false
Regulatory and Compliance
Government & Public Sector government-and-public-sector
Multiple Chart
BCG
View slide
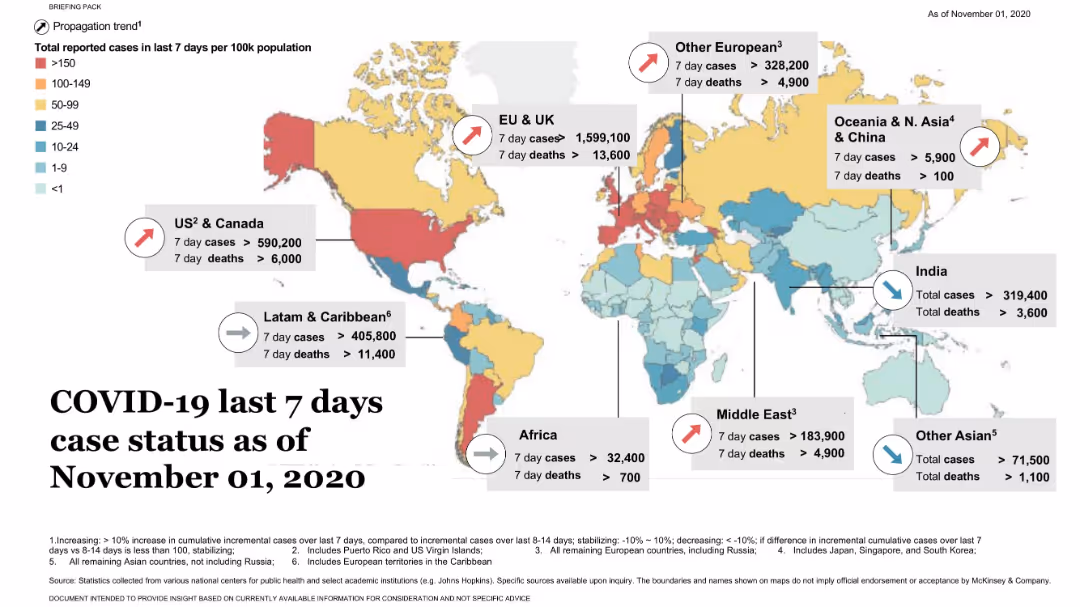
World map with heatmap coloring and arrows for trend direction; regional stats in callouts; legend and notes at bottom.
Risk Assessment and Management
Healthcare & Pharmaceuticals
This slide presents a global heatmap of COVID-19 case rates by region for a 7-day period. Regional callouts show case and death figures, with trend indicators (rising/stabilizing/decreasing).
COVID-19, heatmap, global health, cases, deaths, McKinsey, pandemic, trend
false
Risk Assessment and Management
Healthcare & Pharmaceuticals healthcare-and-pharmaceuticals
Uncategorized
McKinsey
View slide
The slide presents a table with percentages showing alternative sites of care hospitals will invest in, such as diagnostic imaging centers and rural health clinics, across various countries.
Strategic Planning
Healthcare & Pharmaceuticals
The slide discusses the shift in hospital investment priorities post-COVID-19, with a focus on diagnostic imaging centers, rural health clinics, and skilled nursing facilities across different countries, reflecting changing healthcare dynamics.
COVID-19, hospital priorities, investment, care sites, global
false
Strategic Planning
Healthcare & Pharmaceuticals healthcare-and-pharmaceuticals
Table
LEK
View slide
The slide displays a combination of icons and column charts in green shades, illustrating the types of shortages (hospital beds, supplies, medical staff) and the utilization of ICU beds in the U.S. during different COVID-19 waves. The design is clear, with direct comparisons between the first and current waves.
Strategic Planning
Healthcare & Pharmaceuticals
Discusses the pressure on hospital systems due to surging COVID-19 cases, showing data on ICU utilization and the types of resource shortages. It serves as an analysis tool to understand the strain on healthcare infrastructure during different pandemic waves.
COVID-19, hospitals, ICU, healthcare, shortages, cases, pressure
false
Strategic Planning
Healthcare & Pharmaceuticals healthcare-and-pharmaceuticals
Mixed Chart
BCG
View slide
This slide features multiple bar charts detailing the impact of COVID-19 on various industries like hotels, food services, and entertainment in New York. It shows year-over-year changes in unemployment claims and daily worker hours. Colors differentiate industries for clarity.
Risk Assessment and Management
Financial Services
Analyzes sector-specific impacts of COVID-19, highlighting industries like hospitality and retail severely affected. Suitable for discussions on risk management and strategic planning in response to economic downturns.
COVID-19, industries, unemployment, hospitality, retail, risk management, New York, sector analysis
false
Risk Assessment and Management
Financial Services financial-services
Multiple Chart
BCG
View slide
The slide presents an array of images from various dates and sources, reflecting the ongoing conversation about innovation in response to COVID-19. The design is a grid collage on a black background, with each image given a white border and captioned with the publication date and source. The arrangement is methodical, allowing for each image to contribute to the overall narrative about the importance of innovation.
Technology and Digital Transformation
Technology & Software
This slide depicts a selection of news headlines emphasizing the priority of innovation during the COVID-19 pandemic across different sectors. It serves to underscore the critical role of innovation in addressing global challenges and could be used to illustrate the push for innovation in healthcare, policy, and technology. This visual summary of global news can aid discussions about the cross-industry focus on innovation in light of the pandemic.
COVID-19, innovation priority, global news, healthcare, technology
false
Technology and Digital Transformation
Technology & Software technology-and-software
Header Vertical
BCG
View slide
Displays a line chart showing trends in prioritization of innovation, core business, and other aspects during and post-COVID-19 crisis.
Strategic Planning
Professional Services
Analyzes shifts in business focus on innovation during the COVID-19 crisis, highlighting how priorities changed over time and the implications for business strategy post-crisis.
COVID-19, innovation, trends, crisis management, business strategy, core business
false
Strategic Planning
Professional Services professional-services
Single Chart
McKinsey
View slide
Displays a column chart detailing the impact of COVID-19 on job satisfaction among deskless workers in France versus a general overview, using shades of green, grey, and red.
Operational Efficiency
Professional Services
Examines the impact of COVID-19 on job satisfaction levels among deskless workers, providing insights into the pandemic’s effects on employee morale.
COVID-19, job satisfaction, impact, deskless workers, column chart
false
Operational Efficiency
Professional Services professional-services
Multiple Chart
BCG
View slide
Column chart showing potential layoffs percentages due to COVID-19, with varying probabilities. The slide uses a soft blue floral background, adding a visual contrast to the stark data presented.
Human Resources and Talent Management
Professional Services
Discusses the uncertainty and potential for layoffs due to COVID-19, making it relevant for discussions in HR and strategic business planning sessions.
COVID-19, layoffs, business impact, uncertainty
false
Human Resources and Talent Management
Professional Services professional-services
Single Chart
McKinsey
View slide
A scatter plot chart showing cumulative number of cases per million population juxtaposed against a ratio of total tests to total cases for various countries, within a gradient green background indicating preparedness.
Market Analysis and Trends
Healthcare & Pharmaceuticals
Analyzes countries' testing rates in relation to COVID-19 cases to evaluate readiness for relaxing lockdown measures, providing insights into public health strategies.
COVID-19, lockdown measures, testing rates, public health, cumulative cases, preparedness, relax lockdown
false
Market Analysis and Trends
Healthcare & Pharmaceuticals healthcare-and-pharmaceuticals
Mixed Chart
BCG
View slide
Slide contains multiple line graphs depicting infection fatality rates and immunity duration scenarios, color-coded for severity impact, with detailed explanatory text and references.
Strategic Planning
Healthcare & Pharmaceuticals
Provides a scenario analysis of long-term COVID-19 impacts based on infection fatality rates and immunity durations, critical for future healthcare strategy and policy planning.
COVID-19, long-term impact, infection fatality rate, immunity duration, scenario planning, healthcare strategy
false
Strategic Planning
Healthcare & Pharmaceuticals healthcare-and-pharmaceuticals
Mixed Chart
McKinsey
View slide
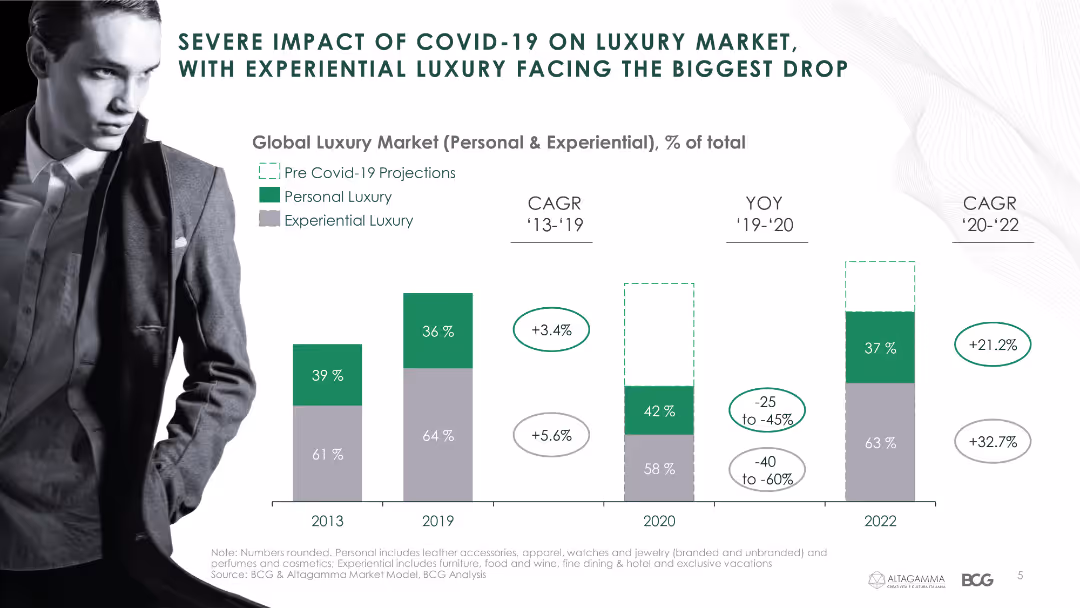
The slide features a column chart depicting the impact of COVID-19 on the luxury market, differentiating between personal and experiential luxury with various metrics.
Market Analysis and Trends
Consumer Goods
This slide illustrates the projected and actual impact of COVID-19 on the luxury market, highlighting changes in CAGR and YOY metrics.
COVID-19, luxury market, projections, personal luxury, experiential luxury, CAGR, YOY
false
Market Analysis and Trends
Consumer Goods consumer-goods
Single Chart
BCG
View slide
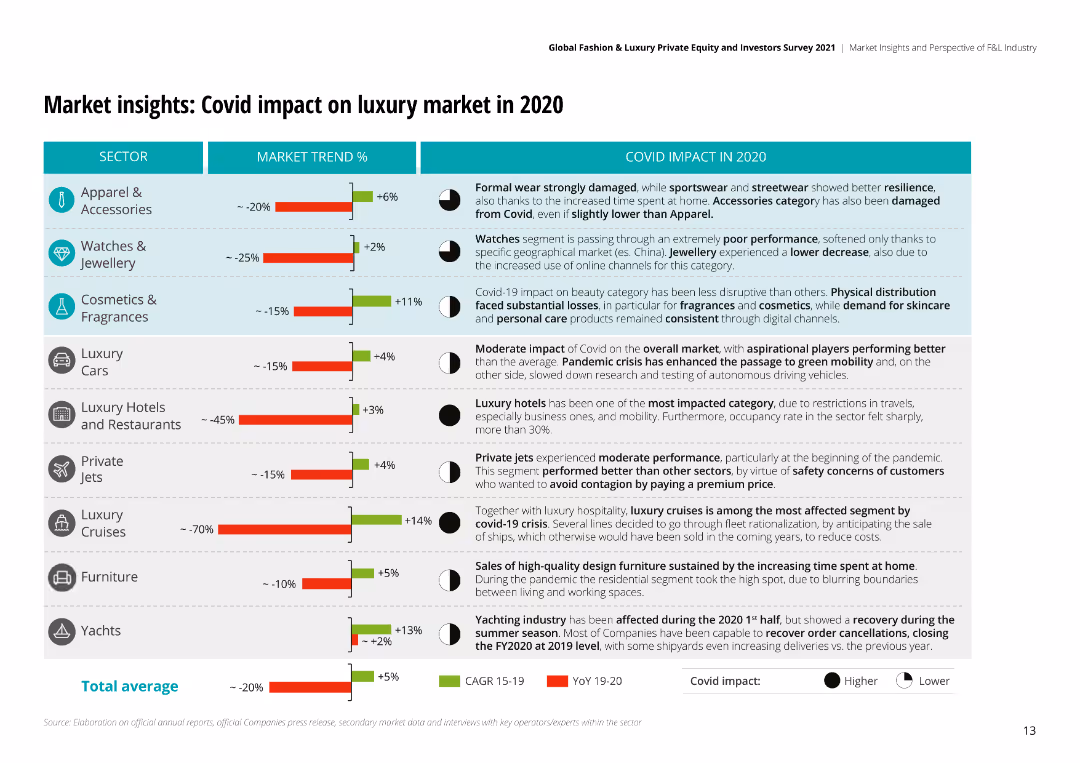
The slide uses a combination of bar charts and textual analysis to detail the impact of COVID-19 on different luxury sectors, including percentages of market trends.
Market Analysis and Trends
Retail & E-commerce
Analyzes the impact of COVID-19 on the luxury market, showing how various sectors like apparel, watches, and hotels were affected during the pandemic.
COVID-19, market impact, luxury, retail, e-commerce, apparel, watches, analysis
false
Market Analysis and Trends
Retail & E-commerce retail-and-e-commerce
Mixed Chart
Deloitte
View slide
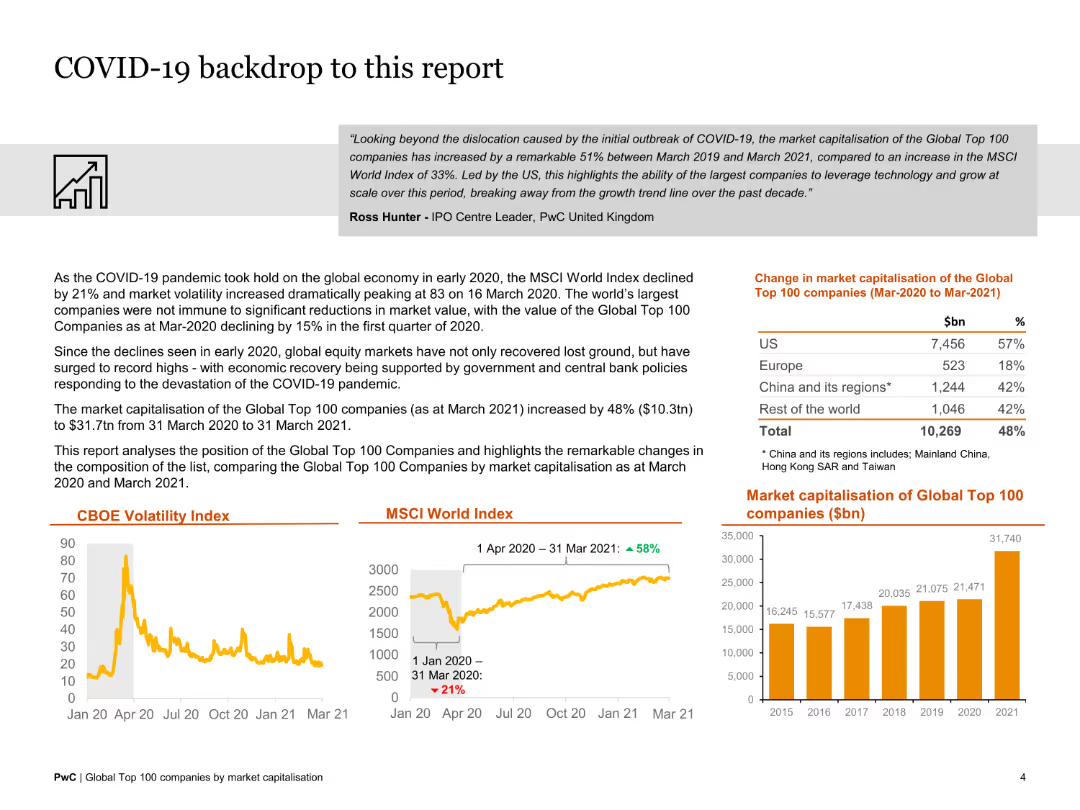
This slide features a mix of text and visual elements, including column charts, line graphs, and data tables. The design is moderately dense with a focus on market capitalization.
Market Analysis and Trends
Financial Services
The slide discusses the impact of COVID-19 on market volatility and the market capitalization of the top 100 companies, comparing data from March 2020 to March 2021.
COVID-19, market volatility, capitalization, impact, 2020-2021, financial analysis, global economy
false
Market Analysis and Trends
Financial Services financial-services
Multiple Chart
PwC/Strategy&
View slide
Column chart with different concerns people have during COVID-19, showing data comparison between May 2020 and Dec 2020.
Market Analysis and Trends
Healthcare & Pharmaceuticals
Highlights major worries about physical and mental health of family and friends during COVID-19, comparing data between two time points.
COVID-19, mental health, physical health, comparison, family concerns
false
Market Analysis and Trends
Healthcare & Pharmaceuticals healthcare-and-pharmaceuticals
Single Chart
IPSOS
View slide
Combined line and column charts showing non-residential movement trends and weekly city movement during COVID-19 across various countries.
Operational Efficiency
Transportation & Logistics
Analyzes mobility patterns during the COVID-19 pandemic to assess impacts on transportation and logistics sectors. Useful for planning urban mobility and public transport strategies.
COVID-19, mobility, transportation, logistics, urban planning
false
Operational Efficiency
Transportation & Logistics transportation-and-logistics
Multiple Chart
BCG
View slide
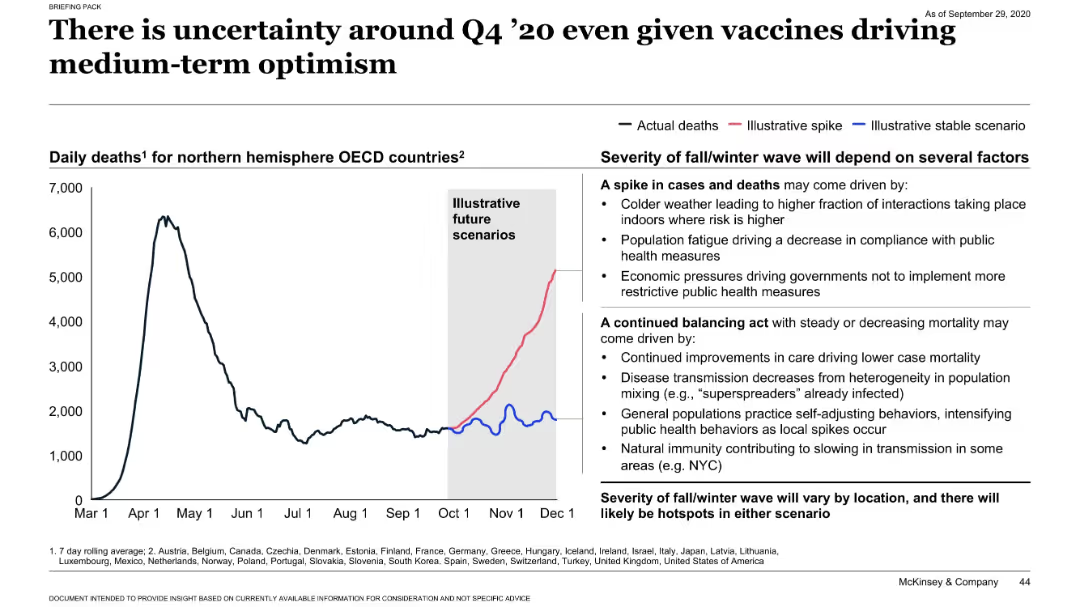
Line chart showing daily deaths and future scenario projections; side panel lists factors driving potential outcomes.
Risk Assessment and Management
Healthcare & Pharmaceuticals
This slide presents possible COVID-19 mortality trends in Q4 2020. It compares actual death rates with projected spikes or stable scenarios. Key factors influencing outcomes include seasonality, public fatigue, compliance with measures, and emerging immunity. It emphasizes regional variability and uncertainty in projections.
COVID-19, mortality, forecast, uncertainty, public health, seasonal trend
false
Risk Assessment and Management
Healthcare & Pharmaceuticals healthcare-and-pharmaceuticals
Mixed Chart
McKinsey
View slide
Bar graphs displaying user reliance levels on nbn™ network during COVID-19, visual markers for household upgrades, and supportive text on the side.
Strategic Planning
Technology & Software
Details the critical role of the nbn™ network in keeping users connected for entertainment and support during the pandemic, leading to many upgrading their plans.
COVID-19, nbn network, family connectivity, entertainment reliance, plan upgrades, pandemic response, user reliance, household data
false
Strategic Planning
Technology & Software technology-and-software
Multiple Chart
Accenture
View slide
The slide features a complex graph plotting activities by enjoyment and time, with a dotted trend line indicating an increase in work-related activities during COVID-19.
Market Analysis and Trends
Technology & Software
It explores the significant increase in time spent on work-related services over the nbn network due to the pandemic, with a focus on LinkedIn, emails, and web browsing.
COVID-19, nbn network, work activities, time increase, remote work, online engagement, LinkedIn, emails
false
Market Analysis and Trends
Technology & Software technology-and-software
Multiple Chart
Accenture
View slide
The slide features a column chart comparing growth/decline in oil demand from 2019 to 2035 by underlying driver, including economic development and fuel efficiencies.
Market Analysis and Trends
Industrial & Manufacturing
The slide analyzes the impact of COVID-19 on oil demand in comparison to other factors like economic development and fuel efficiencies.
COVID-19, oil demand, behavioral shifts, economic development, fuel efficiency
false
Market Analysis and Trends
Industrial & Manufacturing industrial-and-manufacturing
Boxed
McKinsey
View slide
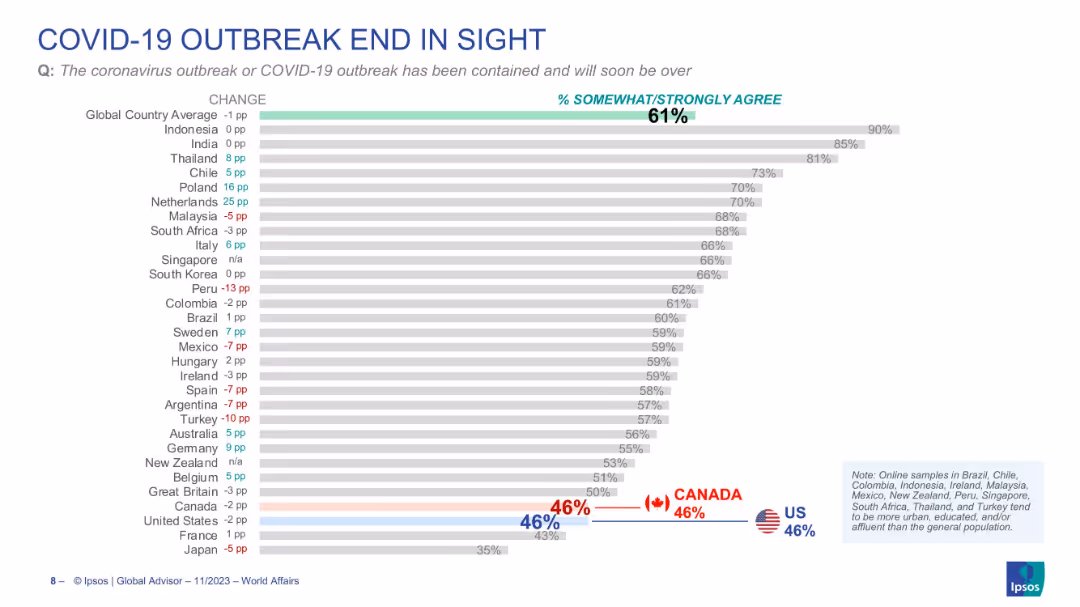
Horizontal bar chart with country comparisons, percentage values, and a central highlighted global average. Data is organized by descending agreement rate.
Market Analysis and Trends
Healthcare & Pharmaceuticals
The slide presents survey data showing the percentage of respondents in various countries who believe the COVID-19 outbreak has been contained and will soon be over. It includes comparison bars by country with % change from previous surveys. Global average is 61%, with countries like Indonesia (90%) and India (85%) being most optimistic.
COVID-19, outbreak, containment, perception, Ipsos, survey, country comparison, pandemic, global opinion, healthcare sentiment
false
Market Analysis and Trends
Healthcare & Pharmaceuticals healthcare-and-pharmaceuticals
Single Chart
IPSOS
View slide
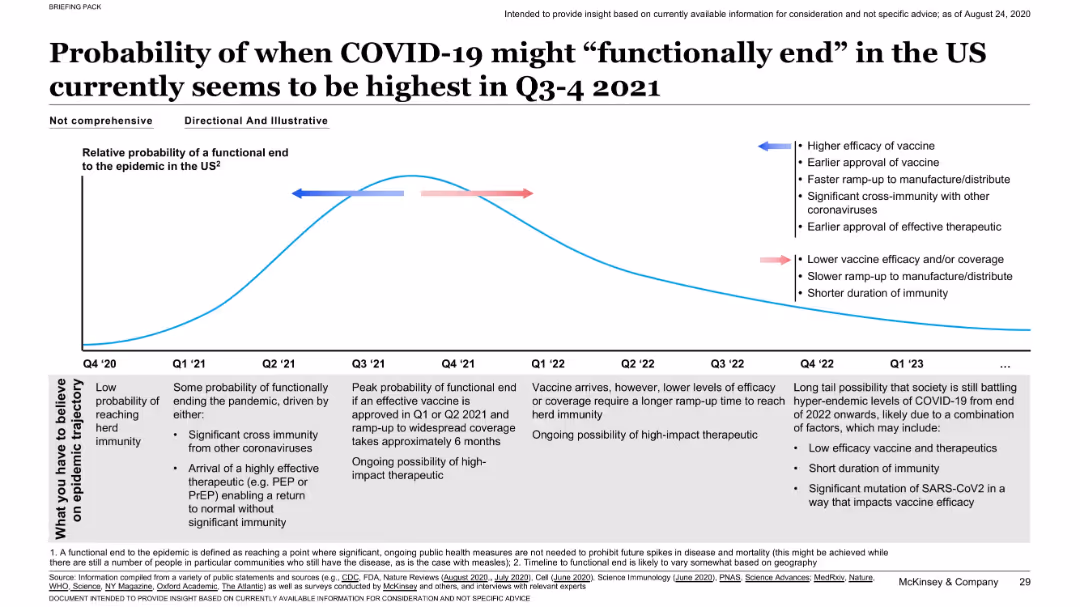
Line chart with a curve representing relative probability over time; annotated with influencing factors; timeline spans Q4 2020 to Q1 2023.
Strategic Planning
Healthcare & Pharmaceuticals
Estimates peak probability for functional end of the pandemic in Q3–Q4 2021, influenced by vaccine efficacy, speed of distribution, and therapeutic developments. Scenarios for faster or slower progress are annotated.
COVID-19, pandemic end, vaccine, immunity, timeline, probability
false
Strategic Planning
Healthcare & Pharmaceuticals healthcare-and-pharmaceuticals
Mixed Chart
McKinsey
View slide
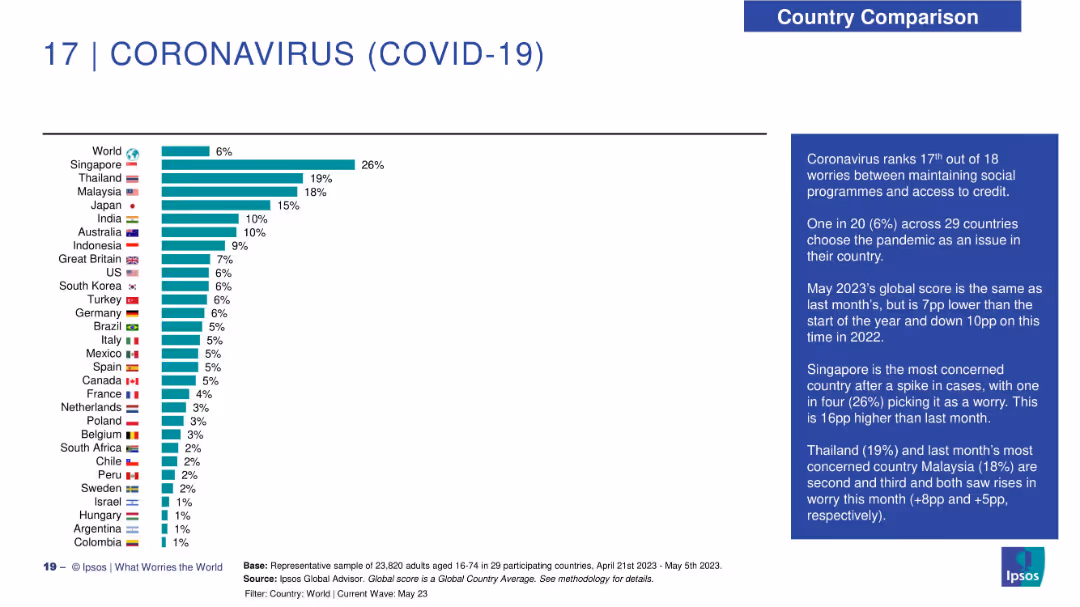
Bar chart ranking countries by concern about COVID-19; right-hand narrative box contextualizes findings.
Risk Assessment and Management
Healthcare & Pharmaceuticals
COVID-19 concern has dropped significantly worldwide, with a 6% global average. Singapore ranks highest (26%) after a recent spike, followed by Thailand (19%) and Malaysia (18%). The chart and commentary reflect declining pandemic-related anxiety across most regions.
COVID-19, pandemic, Ipsos, public health, declining concern, Singapore, global trends, May 2023
false
Risk Assessment and Management
Healthcare & Pharmaceuticals healthcare-and-pharmaceuticals
Mixed Chart
IPSOS
View slide
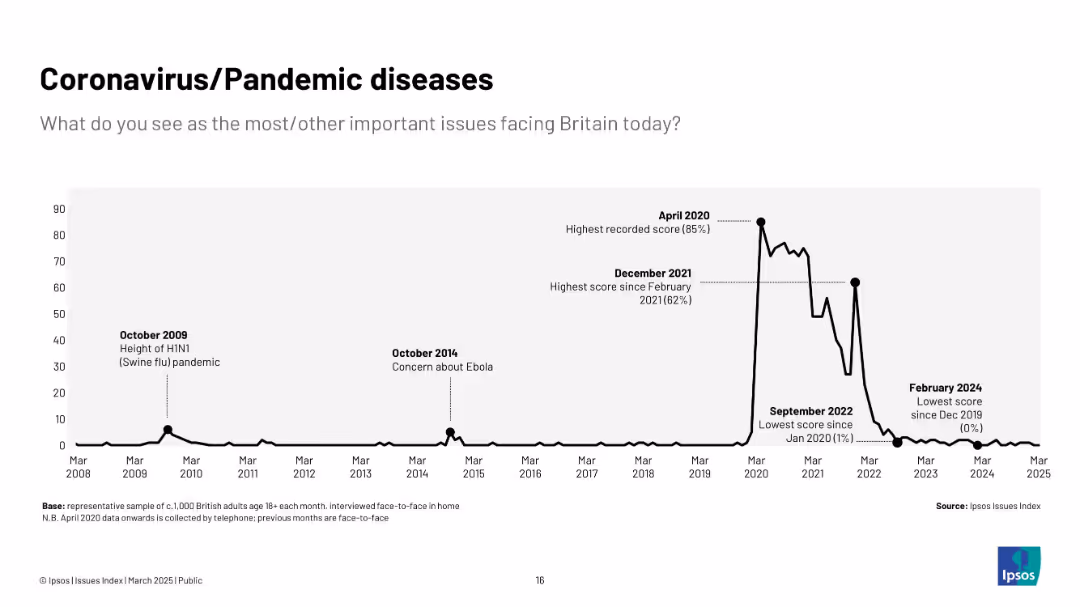
Black line graph with time axis from 2008 to 2025; notable spikes in 2009 (Swine flu) and 2020–2021.
Market Analysis and Trends
Healthcare & Pharmaceuticals
Tracks public concern over pandemics, with a dramatic peak in April 2020 during COVID-19. Smaller peaks correspond to Ebola and swine flu. Concern plummets post-2022.
COVID-19, pandemic, healthcare, public opinion, Ipsos, H1N1, Ebola, virus, disease, health concern
false
Market Analysis and Trends
Healthcare & Pharmaceuticals healthcare-and-pharmaceuticals
Single Chart
IPSOS
Previous
Loading...
Hold On!
We are searching in our database
If nothing, comes up, please try different filters!
Column Chart
Heatmap
Chevron
Org Chart
Infographic
Callouts
Timeline
List
Graphic
Picture
Process Flow
Diagram
Paragraph
Map
Table
Framework
Subtitle
Takeaway Box
Icon
Other Chart
Radar Chart
Waterfall Chart
Mekko Chart
Pie Chart
Scatter Plot
Line Chart
Bar chart
Bullet points
Create a FREE account to continue browsing
Receive Instant Access to 1,000+ slides from companies like McKinsey, Google, and Goldman Sachs
First Name
Last Name
Email
Password
I agree to all
Terms & Privacy Policy
Thank you! Your submission has been received!
Oops! Something went wrong while submitting the form.
Have an account?
Sign in
Upgrade to PRO to Save slides
Advanced Search and Filters
Access to 15,000+ slides
Access to Category Pages
Save/Bookmark Slides
PowerPoint Template Library
Pick a Plan
MONTHLY
$12/month
Billed every month, Cancel anytime.
YEARLY
$9/year
Billed $108 annually, Cancel anytime.
Checkout for $12/month
Checkout for $108/yr
Secured by Stripe | AES-256 bit encryption