My Account
My Slides
Search by Category
Templates
View All Templates
Download Template Slides
Leave Feedback
Login
Logout
Get Started
Browse all Slides
Browse all Slides
Create a FREE Account
Instant access to 1,000+ real slides from top companies like McKinsey, BCG, Goldman Sachs, Google and many more!
First Name
Last Name
Email
Password
I agree to all
Terms & Privacy Policy
Thank you! Your submission has been received!
Oops! Something went wrong while submitting the form.
Have an account?
Sign in
Spark Your Next Big Idea with New Presentation Templates
VIEW ALL Templates
Welcome,
Welcome
PRO
Show Featured Only
Checkbox 8
Companies
Mckinsey
Bain
BCG
EY
Deloitte
Accenture
PwC/Strategy&
JP Morgan
Goldman Sachs
Morgan Stanley
Citigroup
Deutsche Bank
Barclays
LEK
KPMG
Kearney
Oliver Wyman
Booz Allen Hamilton
Gartner
IPSOS
Nielsen
Slide type
Text Only
Linear Flow
Vertical Flow
Single Chart
Header Horizontal
Mixed Chart
Header Vertical
Pillar
Multiple Chart
Graphic
Agenda
Title
Table
Framework
Industry
Technology & Software
Artificial Intelligence
Financial Services
Retail & E-commerce
Consumer Goods
Industrial & Manufacturing
Transportation & Logistics
Telecommunications
Real Estate & Construction
Hospitality & Tourism
Professional Services
Education & Training
Media & Entertainment
Agriculture & Food Production
Healthcare & Pharmaceuticals
Environmental Services & Sustainability
Government & Public Sector
Use Case
Mergers and Acquisitions
Performance Metrics and KPIs
Client Case Studies
Competitive Landscape
Corporate Finance and Valuation
Product and Service Analysis
Customer and Market Segmentation
Organizational Structure and Change
Industry Overview
Regulatory and Compliance
Risk Assessment and Management
Investment Analysis
Organizational Structure and Change
Human Resources and Talent Management
Financial Performance
Market Analysis and Trends
Sales and Business Development
Human Resources and Talent Management
Clear all
Thank you! Your submission has been received!
Oops! Something went wrong while submitting the form.
Tag
View slide
The slide includes pie charts depicting the impact of COVID-19 on home purchasing in Ontario.
Market Analysis and Trends
Real Estate & Construction
It discusses how the pandemic affected the timing of home purchases, with a majority buying earlier than expected.
COVID-19, pandemic, home purchasing, impact, timing, Ontario, pie chart, earlier, expected, analysis
false
Market Analysis and Trends
Real Estate & Construction real-estate-and-construction
Multiple Chart
IPSOS
View slide
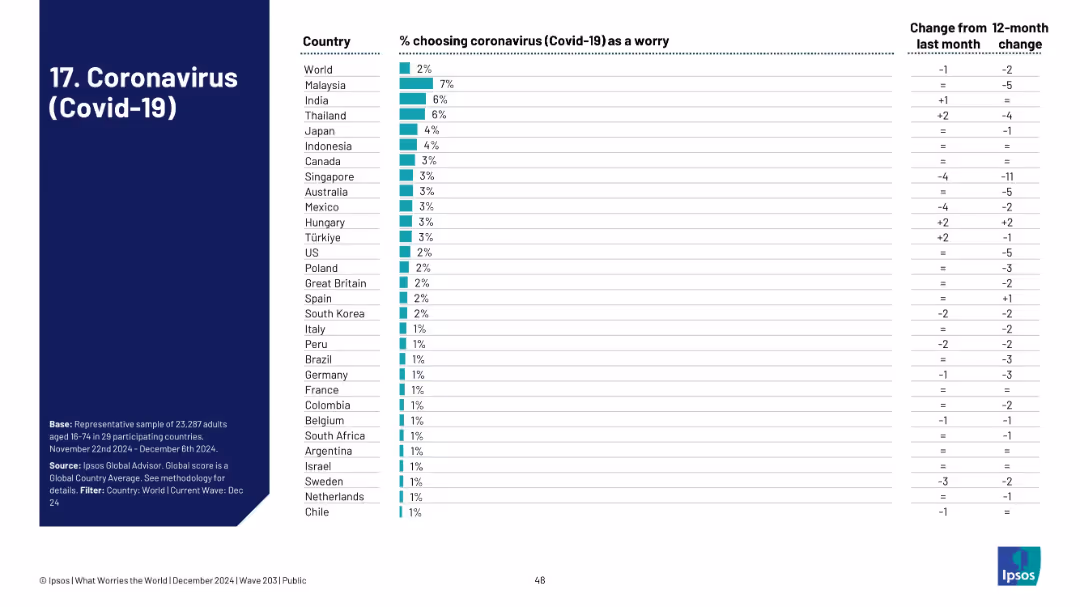
Bar chart showing coronavirus concern levels by country, including global score and trend shifts from prior months and year.
Risk Assessment and Management
Healthcare & Pharmaceuticals
The pandemic now registers only 2% global concern, a dramatic drop. Malaysia and India are relatively higher. The chart reveals a steep global decline in COVID-19 as a pressing issue, signaling a post-pandemic sentiment shift.
COVID-19, pandemic, public health, global recovery, Ipsos, declining concern
false
Risk Assessment and Management
Healthcare & Pharmaceuticals healthcare-and-pharmaceuticals
Single Chart
IPSOS
View slide
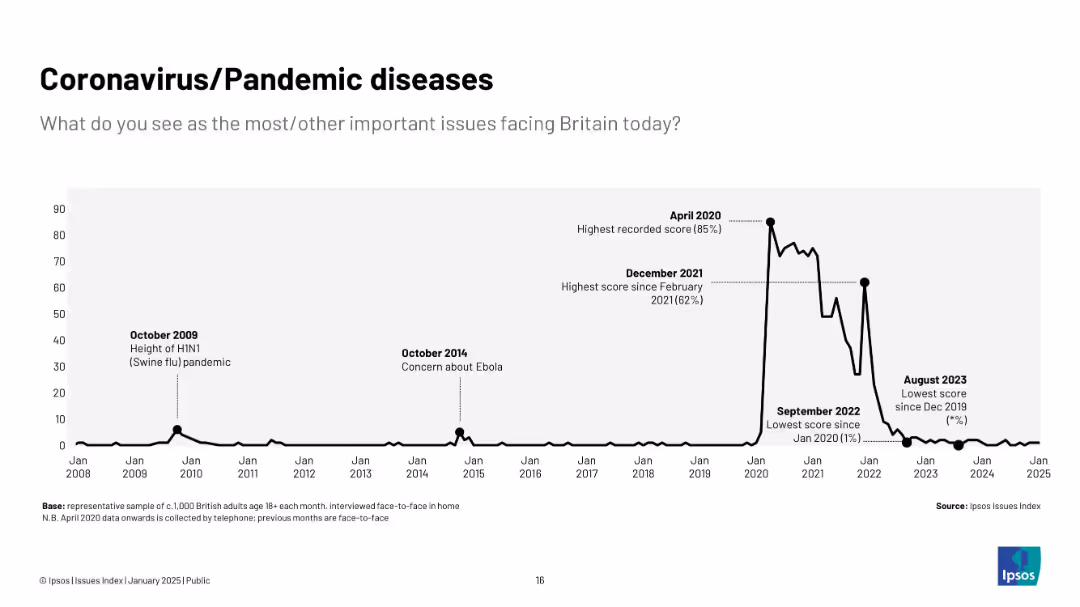
Sharp spike chart showing concern during COVID-19; 2008–2025 timeline; significant peaks labeled (e.g., April 2020, Dec 2021).
Risk Assessment and Management
Healthcare & Pharmaceuticals
Highlights the surge in concern during COVID-19 with peak concern in April 2020. Shows rapid decline by 2023 with minimal ongoing concern.
COVID-19, pandemic, virus, healthcare, UK, Ipsos, public concern, risk
false
Risk Assessment and Management
Healthcare & Pharmaceuticals healthcare-and-pharmaceuticals
Single Chart
IPSOS
View slide
Diagram split into three phases—Flatten, Fight, Future—detailing responses and strategic actions in managing the pandemic's impact.
Strategic Planning
Government & Public Sector
Analyzes the phased strategic responses to COVID-19, useful for government and health sectors planning long-term recovery and response strategies.
COVID-19, phases, strategy, government, health, recovery, response
false
Strategic Planning
Government & Public Sector government-and-public-sector
Linear Flow
BCG
View slide
Slide features a comparative visual of two maps of the US, one for each date, showing COVID-19 prevalence by state with a color gradient scale. Simple, clean design with minimal text and a focus on visual data representation.
Market Analysis and Trends
Healthcare & Pharmaceuticals
Illustrates the changes in COVID-19 case prevalence across US states over a two-week period. Used to analyze regional impacts and trends in the spread of the virus.
COVID-19, prevalence, US states, increase, health data, regional analysis, June 2020, two-week comparison
false
Market Analysis and Trends
Healthcare & Pharmaceuticals healthcare-and-pharmaceuticals
Table
McKinsey
View slide
The slide features a pie chart with three sections: 51% no impact, 37% more likely, and 13% less likely.
Market Analysis and Trends
Real Estate & Construction
This slide illustrates the impact of the COVID-19 pandemic on the likelihood of listing investment properties, showing how investors' plans have changed.
COVID-19, property listing, investment, pandemic impact, pie chart, investor behavior
false
Market Analysis and Trends
Real Estate & Construction real-estate-and-construction
Single Chart
IPSOS
View slide
Includes three column charts comparing percentages of population, cases, and deaths by race, with additional textual explanation on the side regarding factors affecting these disparities.
Market Analysis and Trends
Healthcare & Pharmaceuticals
Examines the racial disparities in COVID-19 impact within the US, highlighting the disproportionate effects on the Black population along with potential contributing social and economic factors.
COVID-19, racial disparity, healthcare access, comorbidities, US demographics, socioeconomic factors
false
Market Analysis and Trends
Healthcare & Pharmaceuticals healthcare-and-pharmaceuticals
Mixed Chart
McKinsey
View slide
Slide includes bullet points, and tables detailing recovery trends and financial strategies.
Strategic Planning
Transportation & Logistics
Provides an update on global and regional recovery trends post-COVID-19, emphasizing financial adaptations.
COVID-19, recovery trends, financial strategy, global impact, market analysis
false
Strategic Planning
Transportation & Logistics transportation-and-logistics
Header Vertical
Deutsche Bank
View slide
This slide uses a timeline format with a multi-colored wave graph showing the progression of COVID-19 through phases labeled "Flatten," "Fight," and "Future." It describes anticipated actions in each phase, like social distancing and vaccine development, aimed at controlling the pandemic's impact.
Strategic Planning
Healthcare & Pharmaceuticals
Analyzes the expected phases of COVID-19 recovery focusing on different strategic responses from government and healthcare systems to mitigate the pandemic's impact. Highlights the importance of coordinated responses in limiting cases and supporting economic recovery.
COVID-19, recovery, healthcare, government, pandemic, phases, vaccine
false
Strategic Planning
Healthcare & Pharmaceuticals healthcare-and-pharmaceuticals
Linear Flow
BCG
View slide
The slide presents a flow chart and bullet points outlining assumptions for economic recovery post-lockdown, categorized by industry and region. It includes symbolic representations (flags, state outlines) to visually distinguish between different geographical areas.
Strategic Planning
Financial Services
Outlines potential recovery scenarios from COVID-19 lockdowns, emphasizing different impacts and recovery rates by industry and region. Useful for strategic discussions on preparing for post-COVID economic landscapes.
COVID-19, recovery, industry, region, economic analysis, assumptions, strategic planning, lockdown
false
Strategic Planning
Financial Services financial-services
Header Vertical
BCG
View slide
Multi-layered flowchart with color gradients representing the phases of COVID-19 impact over time, focusing on various societal and economic responses.
Regulatory and Compliance
Government & Public Sector
Analyzes the phased responses to the COVID-19 pandemic, including initial containment efforts and future economic recovery strategies, with implications for policy and societal changes.
COVID-19, recovery, pandemic, policy, phases
false
Regulatory and Compliance
Government & Public Sector government-and-public-sector
Linear Flow
BCG
View slide
Line charts showing recovery trends post-COVID-19
Risk Assessment and Management
Hospitality & Tourism
Details the impact of COVID-19 on high-end tourism in Europe, showing recovery trends and ongoing challenges in the sector.
COVID-19, recovery, tourism, challenges
false
Risk Assessment and Management
Hospitality & Tourism hospitality-and-tourism
Mixed Chart
Bain
View slide
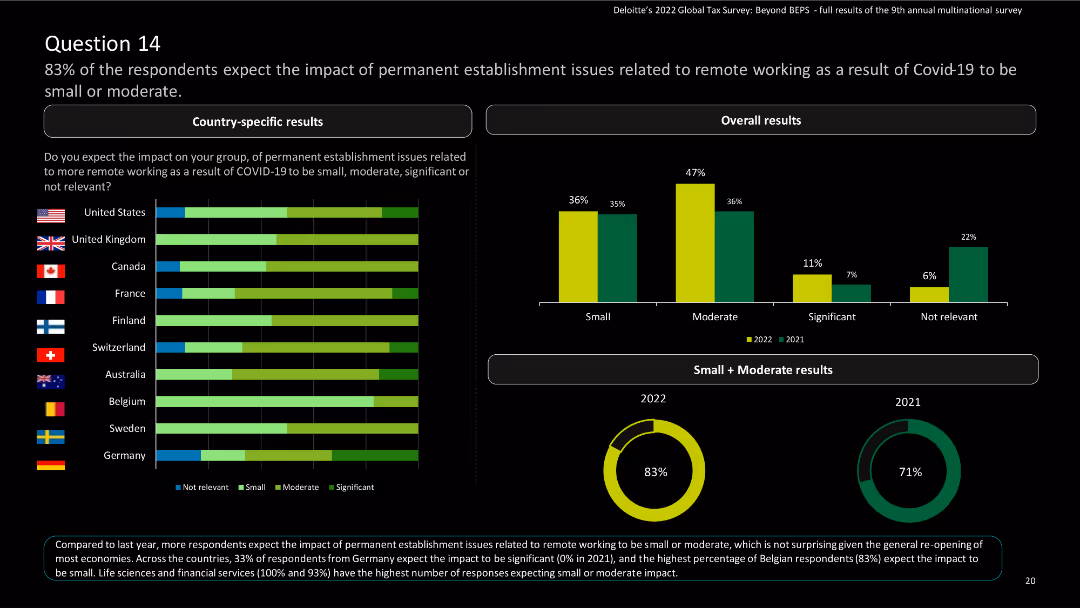
The slide contains horizontal bar charts for country-specific results and a column chart for overall results, along with a donut chart for trends.
Risk Assessment and Management
Financial Services
The slide summarizes survey findings on the impact of remote working on permanent establishment issues due to COVID-19. It includes country-specific and overall results, with trends from 2021 to 2022.
COVID-19, remote working, permanent establishment, financial services, survey results
false
Risk Assessment and Management
Financial Services financial-services
Multiple Chart
Deloitte
View slide
Illustrative graph depicting potential economic recovery scenarios post-COVID-19, categorized as "Flatten," "Fight," and "Future."
Strategic Planning
Professional Services
Outlines possible economic impacts and recovery paths under different COVID-19 management scenarios, highlighting critical decision points for businesses and governments.
COVID-19, scenarios, economic impact, recovery, management, flatten, fight, future, decision making
false
Strategic Planning
Professional Services professional-services
Mixed Chart
BCG
View slide
The slide contains a mix of icons, text, and colored boxes to represent various sectors and their growth or decline due to COVID-19. The layout is organized and color-coded.
Market Analysis and Trends
Technology & Software
Analyzes the differential impact of COVID-19 on sectors, identifying those that have been set back versus those that have seen growth or acceleration, such as e-commerce.
COVID-19, sectors, e-commerce, online travel, food delivery, growth, setback
false
Market Analysis and Trends
Technology & Software technology-and-software
Table
Bain
View slide
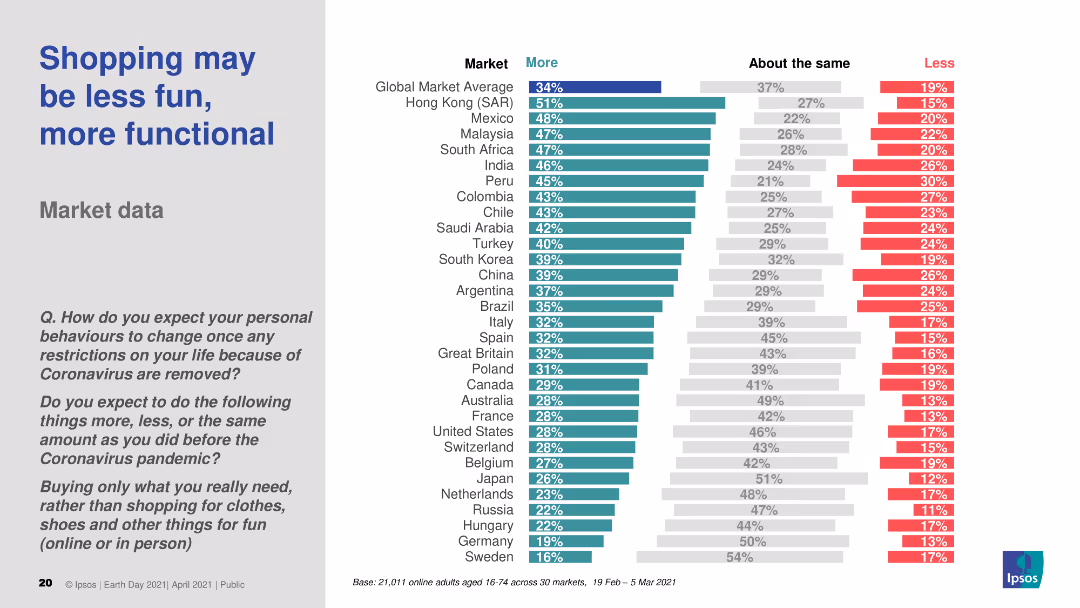
The slide features a column chart comparing the behavior changes in purchasing only essential items across various markets post-COVID-19. The chart uses three color bars to indicate "More," "About the same," and "Less." The text section includes a question and survey details.
Market Analysis and Trends
Retail & E-commerce
The slide presents survey data showing expected changes in personal buying behavior after COVID-19 restrictions are removed, focusing on purchasing essential items rather than non-essential items across multiple global markets.
COVID-19, shopping behavior, essential items, markets, global survey
false
Market Analysis and Trends
Retail & E-commerce retail-and-e-commerce
Multiple Chart
IPSOS
View slide
Line graphs and scatter plot on a logarithmic scale, comparing the daily growth rates and cumulative confirmed cases across countries.
Regulatory and Compliance
Healthcare & Pharmaceuticals
Analyzes COVID-19 case growth rates and doubling times, indicating which countries are successfully flattening the curve as of April 2020.
COVID-19, statistics, health policy, growth rate, logarithmic scale, flattening the curve, countries, cases, progression
false
Regulatory and Compliance
Healthcare & Pharmaceuticals healthcare-and-pharmaceuticals
Multiple Chart
BCG
View slide
A slide listing nine strategic action areas for business leaders post-COVID-19, including crisis management and digital transformation.
Strategic Planning
Professional Services
Outlines essential strategies for businesses navigating post-COVID-19 challenges, focusing on digital transformation, cost management, and supply chain adjustments. Useful for leadership and strategy teams.
COVID-19, strategy, digital transformation, crisis management, supply chain
false
Strategic Planning
Professional Services professional-services
Vertical Flow
BCG
View slide
Features a line graph depicting various business strategies companies are considering in response to COVID-19, like hiring freezes and salary reductions, overlaid with a large COVID-19 virus image for impact.
Human Resources and Talent Management
Professional Services
Explores how companies plan to adapt their talent strategies in light of the pandemic, with a focus on reducing costs. Useful for HR and strategic planning.
COVID-19, talent acquisition, business strategy, cost reduction, planning
false
Human Resources and Talent Management
Professional Services professional-services
Single Chart
McKinsey
View slide
The slide shows a line graph of COVID-19 test results in Ontario, indicating the waves of the pandemic.
Risk Assessment and Management
Healthcare & Pharmaceuticals
It presents data on the fluctuating positive COVID-19 test results over time, highlighting key dates and events.
COVID-19, test results, waves, Ontario, line graph, pandemic, positive, data, key dates, events
false
Risk Assessment and Management
Healthcare & Pharmaceuticals healthcare-and-pharmaceuticals
Single Chart
IPSOS
View slide
Several rows categorizing types of COVID-19 tests such as presence of viral genome, immune response, and antigen tests, including their availability status and brands involved.
Product and Service Analysis
Healthcare & Pharmaceuticals
Provides an overview of the available COVID-19 testing technologies, their developers, and the stage of availability, highlighting the evolving landscape in diagnostic tests.
COVID-19, testing landscape, viral genome, immune response, antigen tests, diagnostic tests, healthcare technology
false
Product and Service Analysis
Healthcare & Pharmaceuticals healthcare-and-pharmaceuticals
Table
BCG
View slide
Graph showing the cumulative number of tests per million population versus cases per million, along with a column chart comparing testing-to-case ratios by country.
Regulatory and Compliance
Healthcare & Pharmaceuticals
Discusses the scale of COVID-19 testing in various countries and contrasts it with the number of reported cases to evaluate testing adequacy as of April 2020.
COVID-19, testing, healthcare capacity, countries, testing ratios, cases, global overview, adequacy
false
Regulatory and Compliance
Healthcare & Pharmaceuticals healthcare-and-pharmaceuticals
Multiple Chart
BCG
View slide
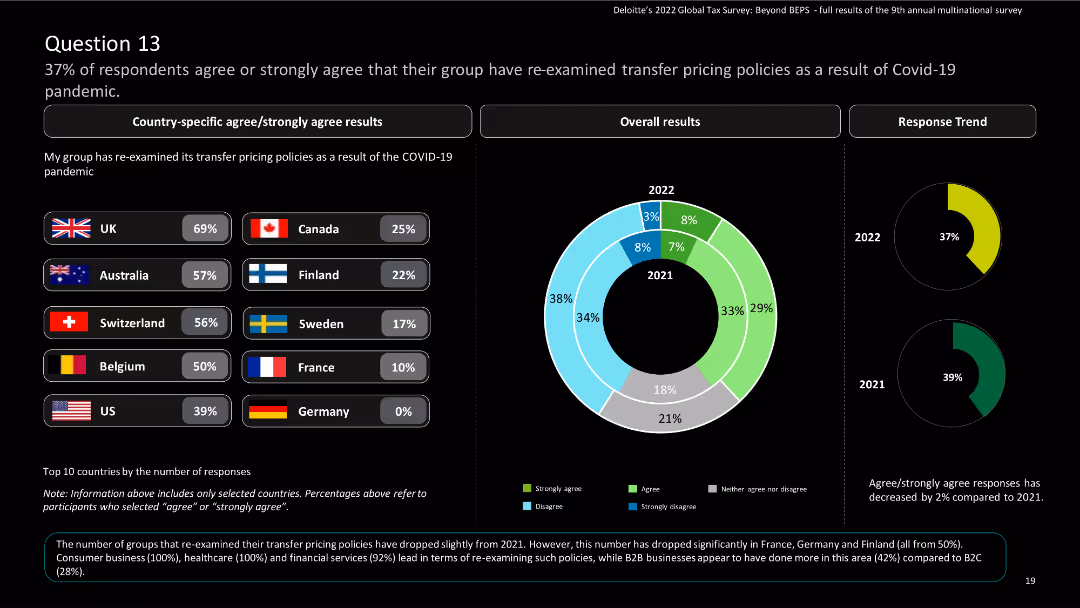
This slide presents country-specific results using bar charts and a donut chart for overall results. It includes country flags and percentages.
Risk Assessment and Management
Financial Services
The slide displays survey results on the re-examination of transfer pricing policies due to COVID-19. It shows country-specific and overall responses, comparing results from 2021 to 2022.
COVID-19, transfer pricing, survey, financial services, policy re-examination
false
Risk Assessment and Management
Financial Services financial-services
Multiple Chart
Deloitte
View slide
The slide shows a series of horizontal bar charts representing changes in transportation modes post-COVID-19 in Germany, the US, and China, with modes like own car, public transport, and shared mobility.
Market Analysis and Trends
Transportation & Logistics
The slide examines how transportation preferences have shifted post-COVID-19, with continued popularity of personal cars in Germany and the US, and increased use of shared modes in China.
COVID-19, transportation modes, own car, public transport, shared mobility, Germany, US, China, consumer trends
false
Market Analysis and Trends
Transportation & Logistics transportation-and-logistics
Multiple Chart
PwC/Strategy&
View slide
Contains multiple bar graphs and a small text section comparing the effects of different treatments on COVID-19 patient outcomes, highlighting dexamethasone and remdesivir.
Product and Service Analysis
Healthcare & Pharmaceuticals
Evaluates the effectiveness of various treatments like dexamethasone and remdesivir on COVID-19, useful for medical professionals and health service planners.
COVID-19, treatment outcomes, dexamethasone, remdesivir, therapeutics, patient care
false
Product and Service Analysis
Healthcare & Pharmaceuticals healthcare-and-pharmaceuticals
Multiple Chart
McKinsey
View slide
Contains multiple line graphs and a column chart depicting the impact of COVID-19 on various economic indicators like unemployment claims, credit card sales, and manufacturing activity in New York. Visual cues such as color highlight significant changes or trends.
Regulatory and Compliance
Financial Services
Discusses the immediate economic impacts of COVID-19 through various metrics such as unemployment, sales decline, and manufacturing downturn. Useful for presentations on economic policies and their effectiveness during crisis situations.
COVID-19, unemployment, manufacturing, sales, economic policy, New York, impact, recovery
false
Regulatory and Compliance
Financial Services financial-services
Multiple Chart
BCG
View slide
Pie charts with percentages for different countries.
Regulatory and Compliance
Healthcare & Pharmaceuticals
Showcases vaccination rates across SEA and compares them with global standards, useful for public health analysis and policy discussions. The slide is data-driven, presenting vaccination statistics to inform about regional healthcare status.
COVID-19, vaccination rates, SEA, healthcare, public policy
false
Regulatory and Compliance
Healthcare & Pharmaceuticals healthcare-and-pharmaceuticals
Multiple Chart
Bain
View slide
This slide combines bar chart and a line graph to illustrate vaccination rates and daily vaccine doses administered in the Philippines.
Market Analysis and Trends
Government & Public Sector
This slide offers a visual analysis of COVID-19 vaccination progress in the Philippines, highlighting coverage and vaccination rates.
COVID-19, vaccination, Philippines, public health, pie charts, line graph, vaccine doses, coverage
false
Market Analysis and Trends
Government & Public Sector government-and-public-sector
Multiple Chart
Deloitte
View slide
Depicts a timeline with icons representing various vaccine candidates across different trial phases, complemented by a side panel discussing strategic considerations.
Investment Analysis
Healthcare & Pharmaceuticals
Outlines the progress and projected timelines for COVID-19 vaccine development, providing insights for investors and policymakers in healthcare.
COVID-19, vaccine development, clinical trials, healthcare investment, strategic considerations, timeline
false
Investment Analysis
Healthcare & Pharmaceuticals healthcare-and-pharmaceuticals
Mixed Chart
McKinsey
View slide
Timeline showing traditional versus accelerated paths for COVID-19 vaccine development, highlighting key phases from discovery to commercial launch.
Strategic Planning
Healthcare & Pharmaceuticals
Provides a timeline for potential COVID-19 vaccine development, comparing traditional and accelerated pathways, important for healthcare planning.
COVID-19, vaccine development, timeline, healthcare, accelerated pathway, traditional, discovery, commercial launch
false
Strategic Planning
Healthcare & Pharmaceuticals healthcare-and-pharmaceuticals
Linear Flow
BCG
Previous
Loading...
Hold On!
We are searching in our database
If nothing, comes up, please try different filters!
Column Chart
Heatmap
Chevron
Org Chart
Infographic
Callouts
Timeline
List
Graphic
Picture
Process Flow
Diagram
Paragraph
Map
Table
Framework
Subtitle
Takeaway Box
Icon
Other Chart
Radar Chart
Waterfall Chart
Mekko Chart
Pie Chart
Scatter Plot
Line Chart
Bar chart
Bullet points
Create a FREE account to continue browsing
Receive Instant Access to 1,000+ slides from companies like McKinsey, Google, and Goldman Sachs
First Name
Last Name
Email
Password
I agree to all
Terms & Privacy Policy
Thank you! Your submission has been received!
Oops! Something went wrong while submitting the form.
Have an account?
Sign in
Upgrade to PRO to Save slides
Advanced Search and Filters
Access to 15,000+ slides
Access to Category Pages
Save/Bookmark Slides
PowerPoint Template Library
Pick a Plan
MONTHLY
$12/month
Billed every month, Cancel anytime.
YEARLY
$9/year
Billed $108 annually, Cancel anytime.
Checkout for $12/month
Checkout for $108/yr
Secured by Stripe | AES-256 bit encryption