My Account
My Slides
Search by Category
Templates
View All Templates
Download Template Slides
Leave Feedback
Login
Logout
Get Started
Browse all Slides
Browse all Slides
Create a FREE Account
Instant access to 1,000+ real slides from top companies like McKinsey, BCG, Goldman Sachs, Google and many more!
First Name
Last Name
Email
Password
I agree to all
Terms & Privacy Policy
Thank you! Your submission has been received!
Oops! Something went wrong while submitting the form.
Have an account?
Sign in
Spark Your Next Big Idea with New Presentation Templates
VIEW ALL Templates
Welcome,
Welcome
PRO
Show Featured Only
Checkbox 8
Companies
Mckinsey
Bain
BCG
EY
Deloitte
Accenture
PwC/Strategy&
JP Morgan
Goldman Sachs
Morgan Stanley
Citigroup
Deutsche Bank
Barclays
LEK
KPMG
Kearney
Oliver Wyman
Booz Allen Hamilton
Gartner
IPSOS
Nielsen
Slide type
Text Only
Linear Flow
Vertical Flow
Single Chart
Header Horizontal
Mixed Chart
Header Vertical
Pillar
Multiple Chart
Graphic
Agenda
Title
Table
Framework
Industry
Technology & Software
Artificial Intelligence
Financial Services
Retail & E-commerce
Consumer Goods
Industrial & Manufacturing
Transportation & Logistics
Telecommunications
Real Estate & Construction
Hospitality & Tourism
Professional Services
Education & Training
Media & Entertainment
Agriculture & Food Production
Healthcare & Pharmaceuticals
Environmental Services & Sustainability
Government & Public Sector
Use Case
Mergers and Acquisitions
Performance Metrics and KPIs
Client Case Studies
Competitive Landscape
Corporate Finance and Valuation
Product and Service Analysis
Customer and Market Segmentation
Organizational Structure and Change
Industry Overview
Regulatory and Compliance
Risk Assessment and Management
Investment Analysis
Organizational Structure and Change
Human Resources and Talent Management
Financial Performance
Market Analysis and Trends
Sales and Business Development
Human Resources and Talent Management
Clear all
Thank you! Your submission has been received!
Oops! Something went wrong while submitting the form.
Tag
View slide
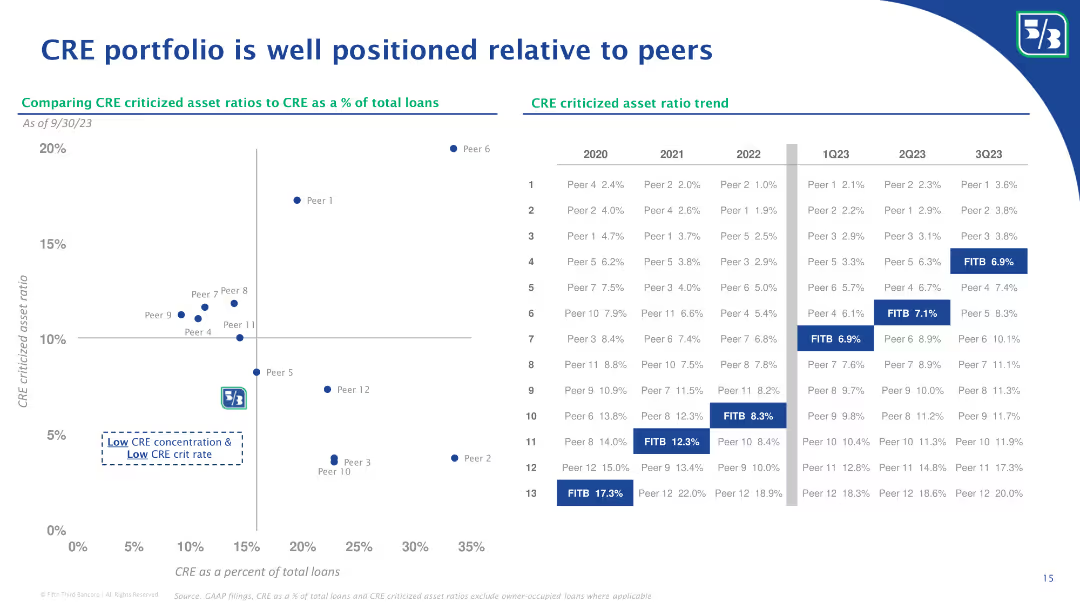
A scatter plot dominates the slide, comparing the CRE criticized asset ratio to other peers, paired with a detailed trend analysis table. The design is clean, with a blue and white theme, and includes textual explanations.
Market Analysis and Trends
Financial Services
Analyzes the bank's commercial real estate portfolio in relation to its peers, with a focus on criticized asset ratios and trends over recent years.
CRE portfolio, commercial real estate, asset ratios, peer comparison, trends
false
Market Analysis and Trends
Financial Services financial-services
Mixed Chart
Goldman Sachs
View slide
Slide displays two charts on commercial real estate risk. Left side includes a bar chart showing bank loan exposure to CRE as percentage of total assets for various countries. Right side has pie charts detailing CRE debt ownership in US and Europe.
Risk Assessment and Management
Financial Services
This slide provides a visual analysis of commercial real estate risks, focusing on the exposure of banks' and financial institutions' balance sheets in the US and Europe. Useful for discussions on market risk management.
CRE risk, financial exposure, US, Europe, banks, balance sheets
false
Risk Assessment and Management
Financial Services financial-services
Multiple Chart
Accenture
View slide
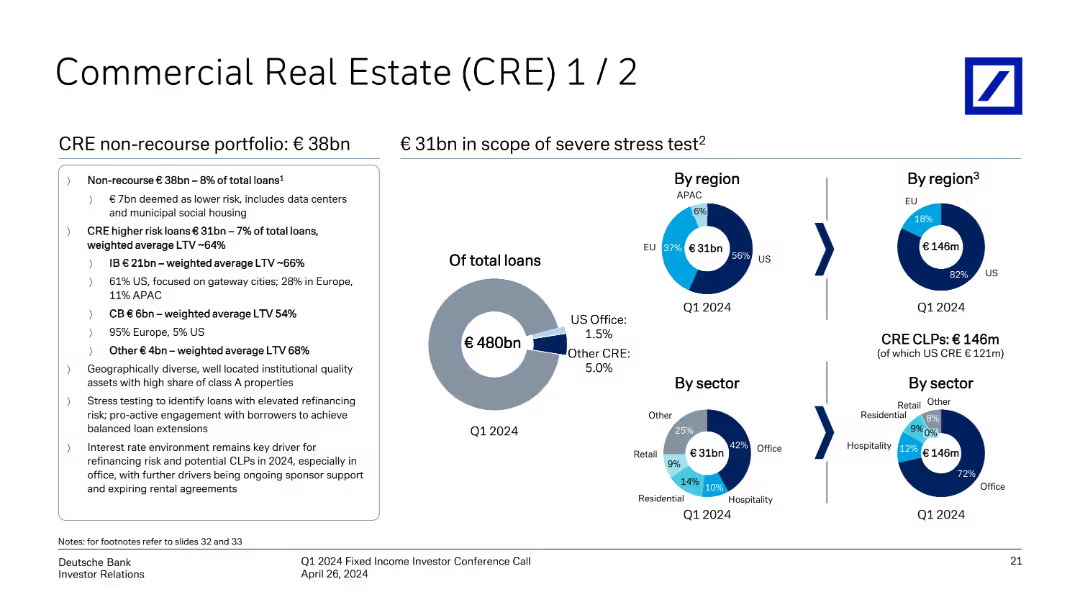
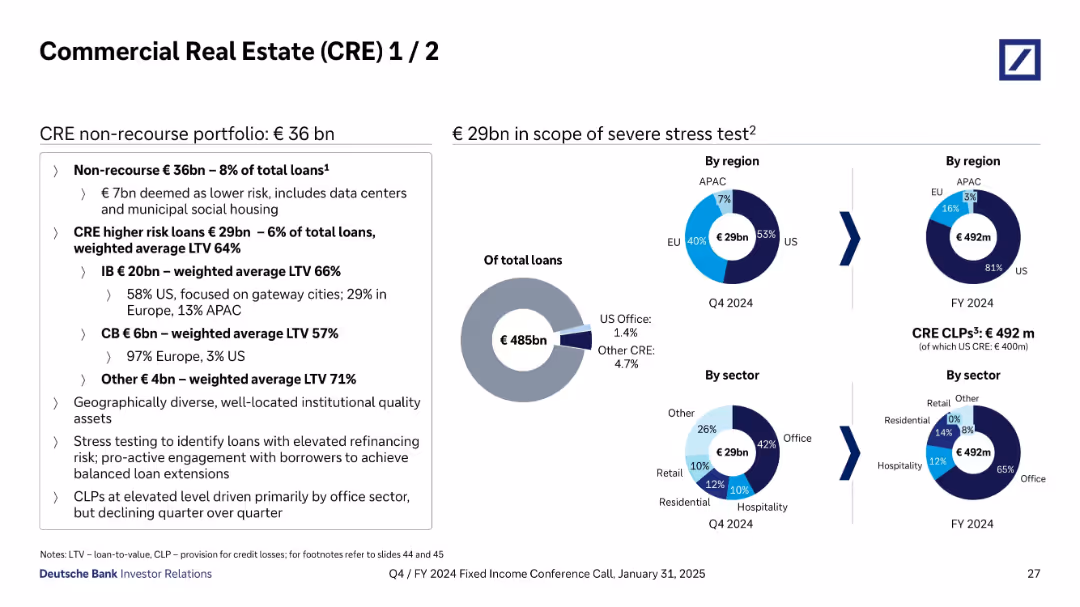
Split into two halves: left side has a text box with bullet points and headers, right side includes four donut charts showing loan data breakdowns by region and sector.
Risk Assessment and Management
Financial Services
Details Deutsche Bank’s €37bn CRE non-recourse portfolio, with breakdowns by loan category and LTVs. It highlights stress-tested loans (€30bn), regions (US, EU, APAC), and sectors (office, retail, hospitality). Emphasizes credit loss provisions and stress testing.
CRE, LTV, Stress Test, Loan Breakdown, Region, Sector, Office, EU, US
false
Risk Assessment and Management
Financial Services financial-services
Mixed Chart
Deutsche Bank
View slide
This slide includes pie charts, a small table, and a text section outlining CRE loan details.
Financial Performance
Real Estate & Construction
Analyzes commercial real estate loan segments and associated investment data, likely used in real estate market analysis or investment strategy sessions.
CRE, Loans, Investment Grade, Real Estate Analysis
false
Financial Performance
Real Estate & Construction real-estate-and-construction
Mixed Chart
Goldman Sachs
View slide
Features multiple pie charts and lists detailing the composition and risk assessment of commercial real estate loans.
Risk Assessment and Management
Real Estate & Construction
Dedicated to commercial real estate (CRE) loan analysis, this slide provides detailed insights into loan values, risk categories, and geographic distribution. It is tailored for real estate investors, financial analysts, and risk managers, focusing on assessing the risk profile, market trends, and financial health of the CRE portfolio. It also includes data on non-recourse loans and exposure under stress test conditions.
CRE, Risk Assessment, Real Estate Investment, Loan Analysis, Stress Testing
false
Risk Assessment and Management
Real Estate & Construction real-estate-and-construction
Multiple Chart
Deutsche Bank
View slide
A slide with multiple data presentations: bar graphs and a line graph, along with text explanations.
Risk Assessment and Management
Financial Services
This slide discusses commercial real estate (CRE) loan portfolios, risk management, and market competition. It's used for financial analysis and risk assessment in real estate banking.
CRE, Risk Management, Portfolio, Loans, Market, Banking, Real Estate, Analysis
false
Risk Assessment and Management
Financial Services financial-services
Multiple Chart
JP Morgan
View slide
This slide includes three images representing different banking services, each with a text description and bullet points outlining key aspects.
Strategic Planning
Financial Services
Highlights strategic approaches in community development, real estate, and commercial term lending banking, suitable for discussions on long-term strategic planning in real estate finance.
CRE, Strategic Planning, Real Estate Finance, Banking, Community Development, Term Lending
false
Strategic Planning
Financial Services financial-services
Table
JP Morgan
View slide
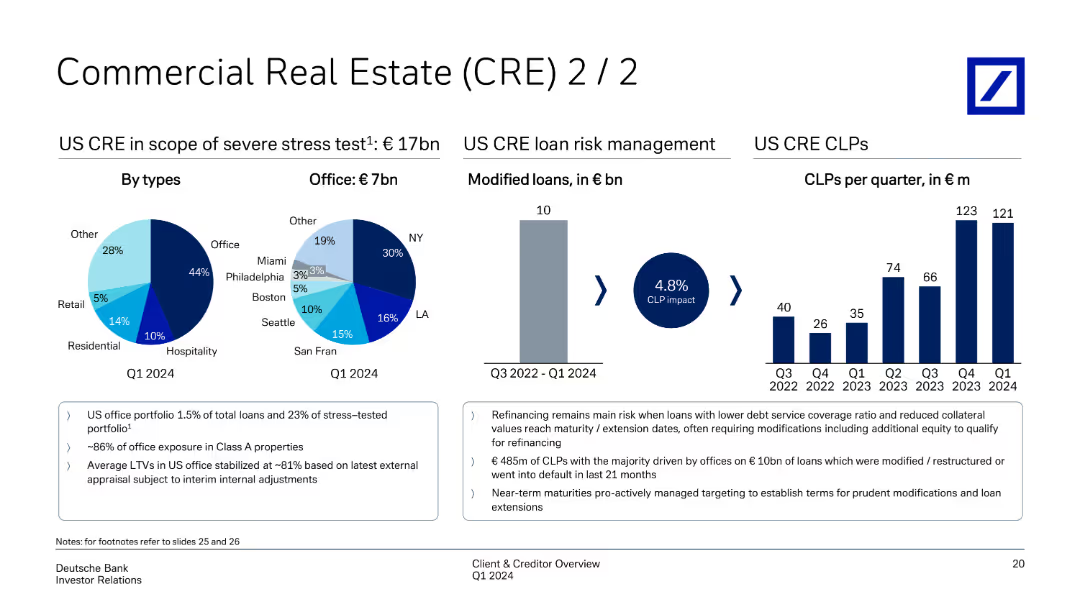
The slide presents several pie charts and a column chart detailing the types of CRE loans in the US by city and the quarterly changes in CLPs. It includes annotations for risk management strategies and impacts.
Risk Assessment and Management
Real Estate & Construction
Explores the dynamics of the U.S. CRE market, focusing on loan modifications, risk management practices, and recent trends in CLPs. Supports strategic decision-making in managing real estate portfolios, especially in understanding geographic and sector-specific risks.
CRE, US market, loan modifications, risk management, geographic risks, sector-specific risks, CLPs
false
Risk Assessment and Management
Real Estate & Construction real-estate-and-construction
Multiple Chart
Deutsche Bank
View slide
The slide features pie charts detailing CRE portfolio by region and sector, with key highlights on non-recourse and higher-risk loans.
Financial Performance
Financial Services
It provides an overview of Deutsche Bank's commercial real estate portfolio, focusing on non-recourse and higher-risk loans by region and sector.
CRE, commercial real estate, portfolio, non-recourse, higher-risk loans, region, sector, Deutsche Bank
false
Financial Performance
Financial Services financial-services
Multiple Chart
Deutsche Bank
View slide
A scatter plot chart comparing CRE criticized asset ratios to CRE as a percentage of total loans. Includes a table detailing asset ratios over time.
Market Analysis and Trends
Real Estate & Construction
The slide compares the criticized asset ratios of CRE portfolios relative to peers, showing trends over several quarters.
CRE, criticized asset ratio, peer comparison, scatter plot, market analysis, asset ratio trend, real estate
false
Market Analysis and Trends
Real Estate & Construction real-estate-and-construction
Mixed Chart
Goldman Sachs
View slide
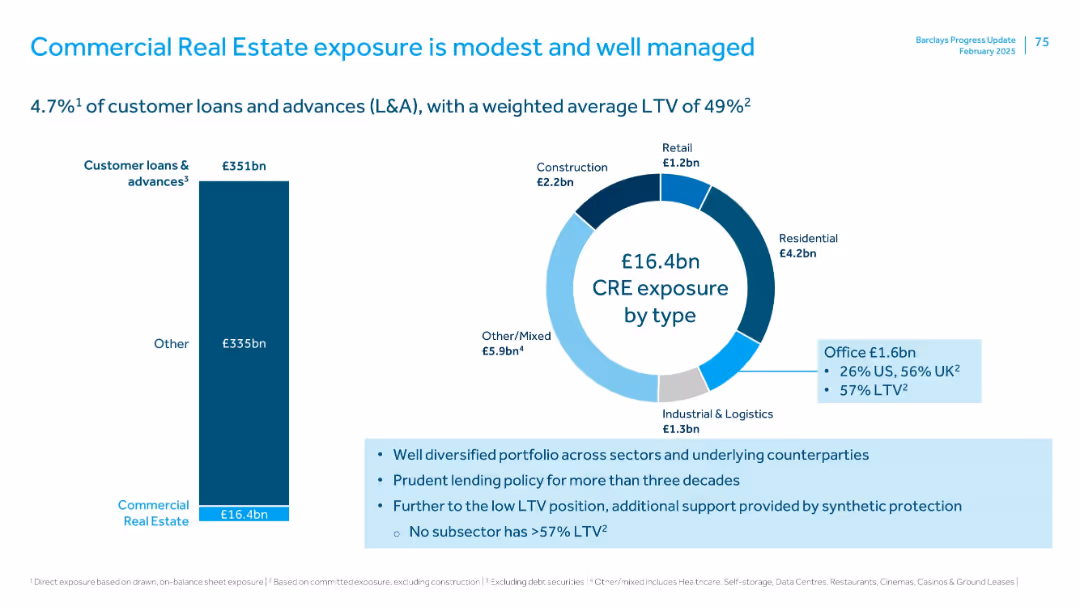
Two-panel layout with bar chart on the left and a donut chart on the right. Text box summary beneath with bullet points. Barclays branding.
Risk Assessment and Management
Financial Services
Highlights that CRE exposure accounts for 4.7% of customer loans and is well diversified. A breakdown of exposure by property type is shown. Notes low LTV ratios and synthetic protection as risk mitigation.
CRE, exposure, LTV, property type, diversification, risk, office, loans
false
Risk Assessment and Management
Financial Services financial-services
Multiple Chart
Barclays
View slide
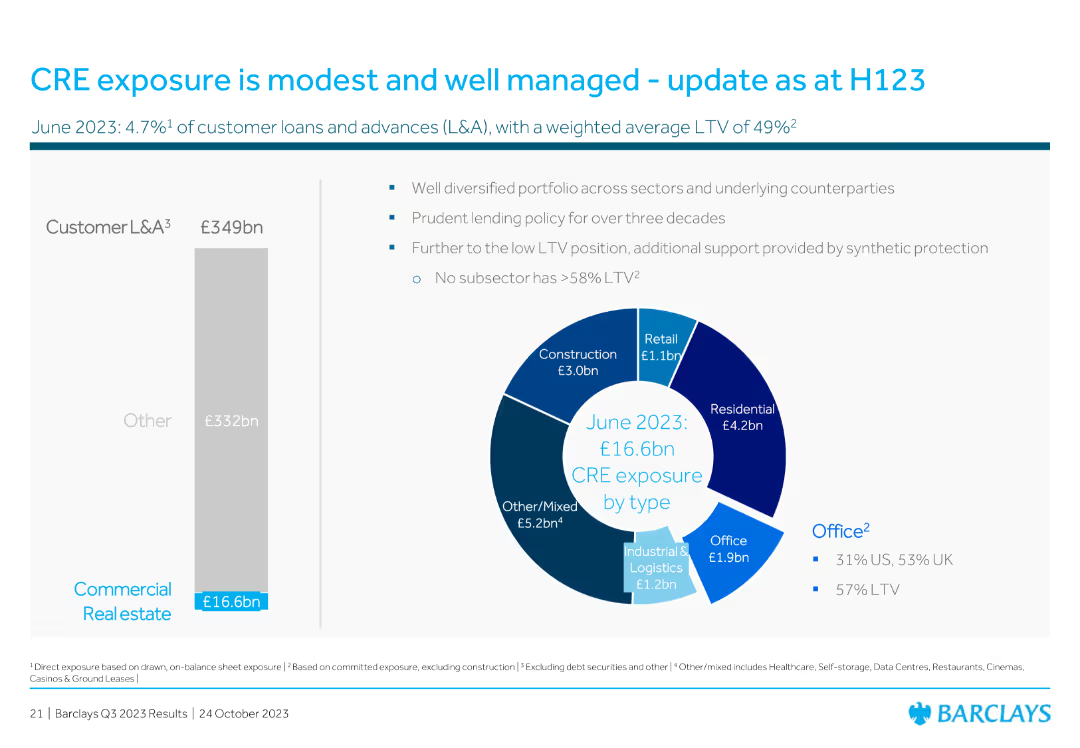
Features a pie chart illustrating CRE exposure by type and a vertical bar chart showing customer loans and advances. The layout is straightforward and data-centric.
Risk Assessment and Management
Real Estate & Construction
The slide discusses the modest and well-managed exposure to Commercial Real Estate (CRE), with detailed breakdowns of exposure types and prudent lending policies.
CRE, exposure, real estate, customer loans, advances, prudent lending, portfolio, diversification
false
Risk Assessment and Management
Real Estate & Construction real-estate-and-construction
Multiple Chart
Barclays
View slide
Includes pie charts and a column chart showcasing types of real estate and financial risk assessments. Detailed annotations aid in understanding.
Investment Analysis
Real Estate & Construction
Further analysis of the CRE investment risks and modifications for loan recovery, important for strategic real estate management.
CRE, investment risks, loan management, real estate, strategic planning
false
Investment Analysis
Real Estate & Construction real-estate-and-construction
Multiple Chart
Deutsche Bank
View slide
Featuring pie charts and a vertical column chart, this slide visualizes the CRE portfolio by region and sector, and investment exposures by type. The design is straightforward, using different colors for various categories.
Investment Analysis
Real Estate & Construction
This slide details the distribution and risk management of a commercial real estate portfolio, emphasizing geographic diversity and sponsorship strength. It's particularly useful for discussions on sector-specific investments and risk assessments in real estate markets.
CRE, investment, real estate, risk management
false
Investment Analysis
Real Estate & Construction real-estate-and-construction
Multiple Chart
Deutsche Bank
View slide
The slide features multiple icon-based indicators representing key business aspects, such as lending, investment, and innovation, accompanied by column charts reflecting loan origination metrics. Layout is well-organized with a clear division between text and graphical data.
Financial Performance
Financial Services
This slide discusses JPMorgan's strategic positioning in commercial real estate, emphasizing innovations and results in loan processing speed and investments.
CRE, lending, innovation, real estate, performance, investment, transparency, risk management, digital delivery
false
Financial Performance
Financial Services financial-services
Mixed Chart
JP Morgan
View slide
This slide offers a mix of pie charts and bar charts, showcasing the CRE portfolio distribution by loan type and region, including specific risk assessments and loan values. Also includes textual data points on risk strategies and regional distributions.
Risk Assessment and Management
Real Estate & Construction
Focuses on the commercial real estate loan portfolio, analyzing risk distribution and loan values across different regions and types. Useful for real estate investment risk management and strategic planning, providing insights into market conditions and potential stress scenarios.
CRE, loan distribution, risk management, real estate, regional analysis, loan values, stress scenarios
false
Risk Assessment and Management
Real Estate & Construction real-estate-and-construction
Multiple Chart
Deutsche Bank
View slide
Showcases a pie chart for the CRE portfolio by asset class and a line chart for CRE net charge-offs, along with textual commentary on market trends and risk management.
Risk Assessment and Management
Financial Services
Assesses the CRE loan portfolio's risk approach, emphasizing credit performance, loan quality, and focused asset class strategy, considering market trends and interest rate effects.
CRE, loan portfolio, risk discipline, JPMC, credit performance, loan quality, asset class strategy, market trends
false
Risk Assessment and Management
Financial Services financial-services
Multiple Chart
JP Morgan
View slide
This slide includes pie charts and bar charts showing the CRE loan risk management and CLPs per quarter, with key highlights on stress tests.
Financial Performance
Financial Services
It discusses the management of Deutsche Bank's CRE loans, including stress test outcomes and risk management strategies for US CRE.
CRE, loan risk management, CLPs, stress test, risk strategies, US CRE, Deutsche Bank
false
Financial Performance
Financial Services financial-services
Multiple Chart
Deutsche Bank
View slide
Slide includes pie charts and a column chart representing CRE loan distribution by region and sector, accompanied by key risk management strategies.
Investment Analysis
Real Estate & Construction
Focuses on the bank's commercial real estate portfolio, analyzing loan distribution and discussing risk mitigation in real estate investments.
CRE, loans, risk management, real estate
false
Investment Analysis
Real Estate & Construction real-estate-and-construction
Multiple Chart
Deutsche Bank
View slide
Contains pie charts for CRE stress test results, column charts for loan modifications, and textual annotations.
Market Analysis and Trends
Financial Services
Details the scope of CRE under stress tests, loan risk management, and quarter-over-quarter changes in CRE loans and credit loss provisions. Used for financial trend analysis and risk management.
CRE, loans, stress test, risk management, Q3 2023
false
Market Analysis and Trends
Financial Services financial-services
Multiple Chart
Deutsche Bank
View slide
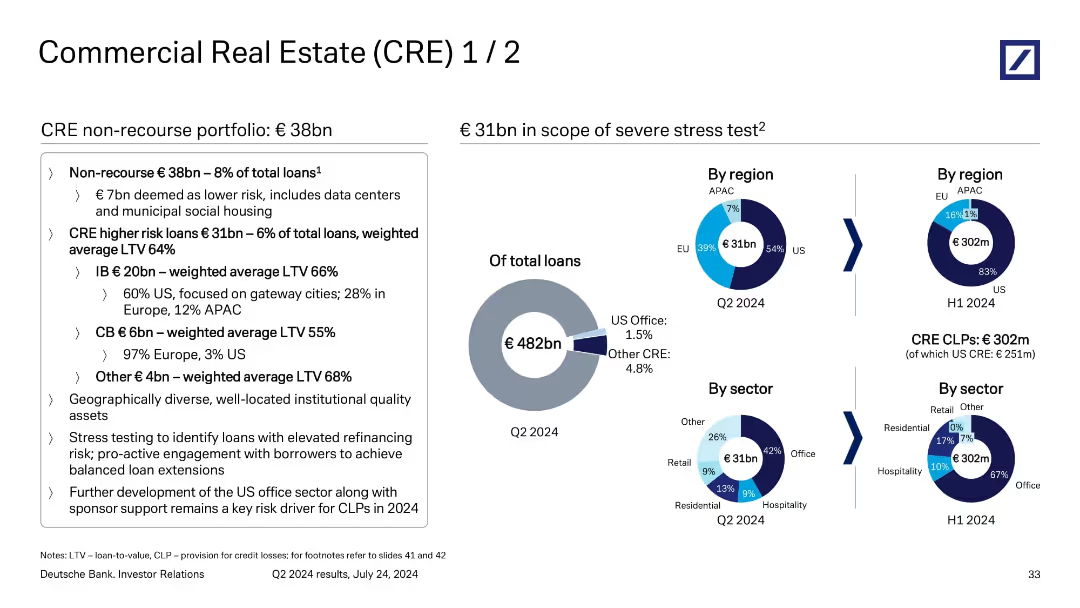
Balanced layout: text analysis on left, three donut/pie charts on right showing geographic and sector exposure to CRE loans.
Investment Analysis
Financial Services
The slide outlines Deutsche Bank’s €38bn non-recourse CRE loan portfolio, breaking down higher-risk segments by region and sector. It highlights a €31bn subset exposed to severe stress test conditions and discusses risk concentrations in the US office market. It also quantifies provisions (CLPs) related to CRE in H1 2024.
CRE, non-recourse loans, US office risk, CLPs, stress testing
false
Investment Analysis
Financial Services financial-services
Mixed Chart
Deutsche Bank
View slide
The slide includes pie charts showing the CRE portfolio's regional and sectoral distribution. It also details the non-recourse portfolio and higher risk loans with weighted average LTVs.
Risk Assessment and Management
Real Estate & Construction
Details the composition and risk profile of the CRE portfolio, including non-recourse and higher risk loans. It highlights geographical and sectoral diversification and weighted average loan-to-value ratios, indicating the bank's exposure and risk management in CRE.
CRE, non-recourse, LTV, portfolio distribution, risk management
false
Risk Assessment and Management
Real Estate & Construction real-estate-and-construction
Multiple Chart
Deutsche Bank
View slide
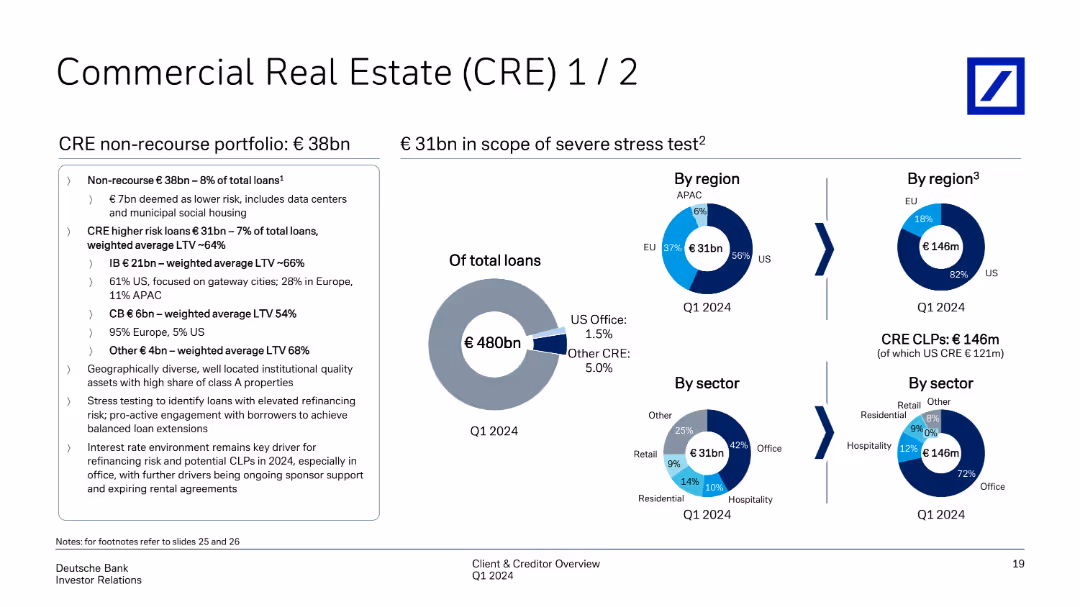
Infographic layout with CRE loan portfolio breakdown by region and sector; left side text box outlines portfolio quality and LTV statistics
Investment Analysis
Financial Services
Focuses on the €36bn non-recourse CRE portfolio, with €29bn undergoing stress tests. Breakdowns show regional and sectoral exposure, especially to US offices. Weighted average LTVs and CLPs are included, with comments on stress testing, refinancing risks, and borrower engagement strategies.
CRE, non-recourse, stress test, US office, LTV, portfolio exposure
false
Investment Analysis
Financial Services financial-services
Mixed Chart
Deutsche Bank
View slide
Multiple donut charts showing CRE stress testing exposure by region and sector; text box outlines risk mitigation and portfolio quality.
Risk Assessment and Management
Financial Services
Covers Deutsche Bank’s €37bn non-recourse CRE portfolio, with €30bn in stress testing. Portfolio is diversified by region and sector, with most risk in US office segment. Stress testing identifies refinancing risk, and Q3 2024 CRE CLPs total €409m, largely driven by US office exposure.
CRE, non-recourse, stress testing, US office, CLPs, risk, Deutsche Bank, Q3 2024
false
Risk Assessment and Management
Financial Services financial-services
Mixed Chart
Deutsche Bank
View slide
Displays pie charts and a column chart, using blue shades to show geographical and sector-based CRE data.
Risk Assessment and Management
Real Estate & Construction
Continues risk analysis of CRE, focusing on loan modifications and defaults, providing insights for financial strategy.
CRE, risk management, loans, defaults, modifications, stress test, US market, financial analysis
false
Risk Assessment and Management
Real Estate & Construction real-estate-and-construction
Multiple Chart
Deutsche Bank
View slide
Pie charts and column charts depict type distribution of US CRE in a stress test and historical data on modified loans.
Investment Analysis
Real Estate & Construction
Continues from previous slide, further analyzing US CRE risk management, highlighting stress-tested portfolios and loan modification trends.
CRE, risk management, stress test, US, loan modifications, investment, real estate
false
Investment Analysis
Real Estate & Construction real-estate-and-construction
Multiple Chart
Deutsche Bank
View slide
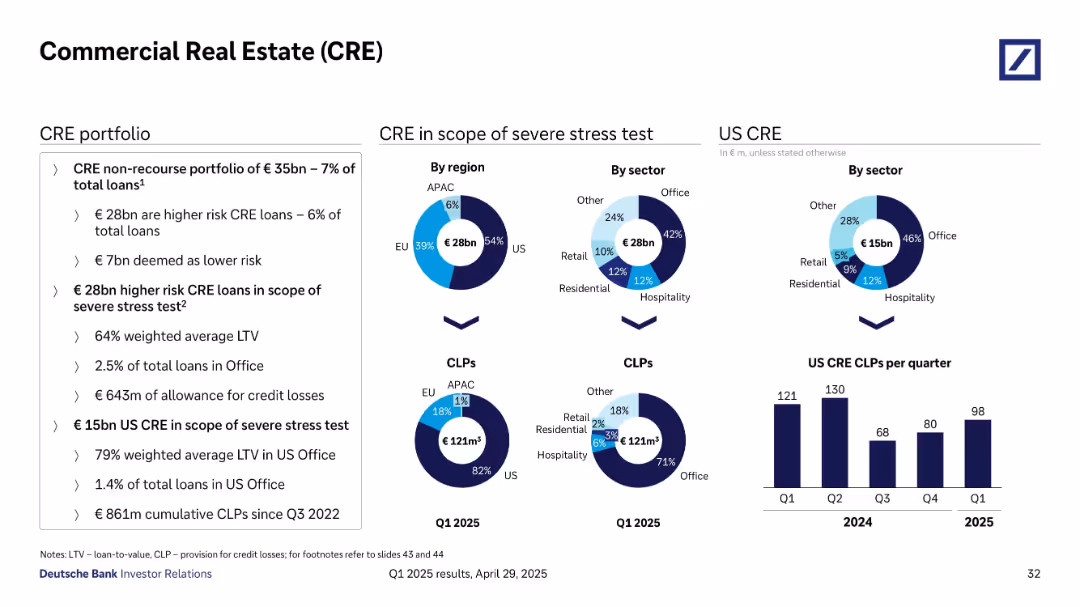
Multi-chart layout with pie charts and bar graphs analyzing CRE portfolio risk by region, sector, and loss provisioning (CLPs). Uses contrasting color schemes for segmentation.
Risk Assessment and Management
Real Estate & Construction
Deutsche Bank’s CRE exposure is analyzed, focusing on €28bn of higher-risk loans, stress testing, regional and sectoral distribution (especially US and Office sector), and provisions for credit losses. It also tracks quarterly trends in US CLPs, providing context on CRE risk concentration and mitigation strategies.
CRE, risk, CLP, stress test, loan-to-value, US exposure, sector analysis
false
Risk Assessment and Management
Real Estate & Construction real-estate-and-construction
Multiple Chart
Deutsche Bank
View slide
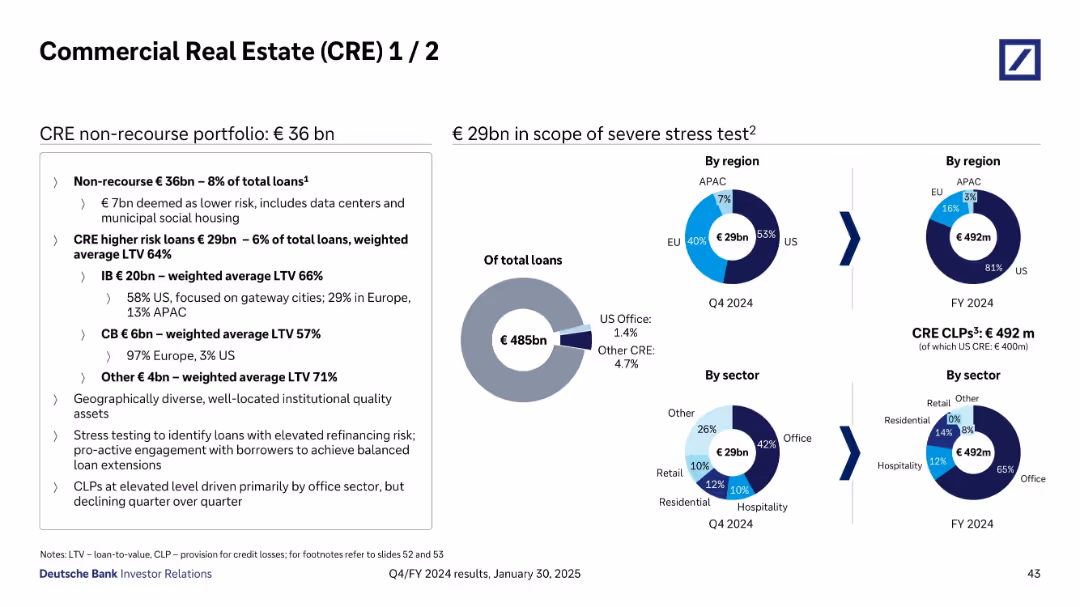
Split into two sections: left text box summarizing CRE portfolio composition; right side includes pie charts by region and sector and loan scope under stress test.
Risk Assessment and Management
Financial Services
Breaks down Deutsche Bank’s €36bn non-recourse CRE portfolio, highlighting €29bn in higher-risk loans and their geographic and sectoral distribution. Provides stress test scope and Credit Loss Provision data, notably focused on US office exposure.
CRE, stress test, LTV, CLPs, office loans, US exposure, EU, APAC, sectors
false
Risk Assessment and Management
Financial Services financial-services
Mixed Chart
Deutsche Bank
View slide
Features pie charts on CRE in severe stress tests, by types, and office distribution. It also shows a bar chart of modified loans and CLPs per quarter, indicating risk management actions.
Risk Assessment and Management
Real Estate & Construction
Explores CRE portfolio under stress scenarios, highlighting types and office distribution. The slide presents modified loans and CLPs, detailing risk management practices to handle potential defaults and refinancing risks within the CRE segment.
CRE, stress test, modified loans, CLPs, risk management
false
Risk Assessment and Management
Real Estate & Construction real-estate-and-construction
Multiple Chart
Deutsche Bank
View slide
Slide features two line charts tracking budget changes for customer relationship management and brand building over several years, indicating recent trends and future predictions.
Strategic Planning
Professional Services
Analyzing the budget trends for customer relationship management and brand building, the slide shows increasing investment in these areas.
CRM, brand building, budgets, trends, planning
false
Strategic Planning
Professional Services professional-services
Single Chart
Deloitte
Previous
Loading...
Hold On!
We are searching in our database
If nothing, comes up, please try different filters!
Column Chart
Heatmap
Chevron
Org Chart
Infographic
Callouts
Timeline
List
Graphic
Picture
Process Flow
Diagram
Paragraph
Map
Table
Framework
Subtitle
Takeaway Box
Icon
Other Chart
Radar Chart
Waterfall Chart
Mekko Chart
Pie Chart
Scatter Plot
Line Chart
Bar chart
Bullet points
Create a FREE account to continue browsing
Receive Instant Access to 1,000+ slides from companies like McKinsey, Google, and Goldman Sachs
First Name
Last Name
Email
Password
I agree to all
Terms & Privacy Policy
Thank you! Your submission has been received!
Oops! Something went wrong while submitting the form.
Have an account?
Sign in
Upgrade to PRO to Save slides
Advanced Search and Filters
Access to 15,000+ slides
Access to Category Pages
Save/Bookmark Slides
PowerPoint Template Library
Pick a Plan
MONTHLY
$12/month
Billed every month, Cancel anytime.
YEARLY
$9/year
Billed $108 annually, Cancel anytime.
Checkout for $12/month
Checkout for $108/yr
Secured by Stripe | AES-256 bit encryption