My Account
My Slides
Search by Category
Templates
View All Templates
Download Template Slides
Leave Feedback
Login
Logout
Get Started
Browse all Slides
Browse all Slides
Create a FREE Account
Instant access to 1,000+ real slides from top companies like McKinsey, BCG, Goldman Sachs, Google and many more!
First Name
Last Name
Email
Password
I agree to all
Terms & Privacy Policy
Thank you! Your submission has been received!
Oops! Something went wrong while submitting the form.
Have an account?
Sign in
Spark Your Next Big Idea with New Presentation Templates
VIEW ALL Templates
Welcome,
Welcome
PRO
Show Featured Only
Checkbox 8
Companies
Mckinsey
Bain
BCG
EY
Deloitte
Accenture
PwC/Strategy&
JP Morgan
Goldman Sachs
Morgan Stanley
Citigroup
Deutsche Bank
Barclays
LEK
KPMG
Kearney
Oliver Wyman
Booz Allen Hamilton
Gartner
IPSOS
Nielsen
Slide type
Text Only
Linear Flow
Vertical Flow
Single Chart
Header Horizontal
Mixed Chart
Header Vertical
Pillar
Multiple Chart
Graphic
Agenda
Title
Table
Framework
Industry
Technology & Software
Artificial Intelligence
Financial Services
Retail & E-commerce
Consumer Goods
Industrial & Manufacturing
Transportation & Logistics
Telecommunications
Real Estate & Construction
Hospitality & Tourism
Professional Services
Education & Training
Media & Entertainment
Agriculture & Food Production
Healthcare & Pharmaceuticals
Environmental Services & Sustainability
Government & Public Sector
Use Case
Mergers and Acquisitions
Performance Metrics and KPIs
Client Case Studies
Competitive Landscape
Corporate Finance and Valuation
Product and Service Analysis
Customer and Market Segmentation
Organizational Structure and Change
Industry Overview
Regulatory and Compliance
Risk Assessment and Management
Investment Analysis
Organizational Structure and Change
Human Resources and Talent Management
Financial Performance
Market Analysis and Trends
Sales and Business Development
Human Resources and Talent Management
Clear all
Thank you! Your submission has been received!
Oops! Something went wrong while submitting the form.
Tag
View slide
Text and symbolic representations explaining the roles of the CRO in AI implementation and risk management.
Risk Assessment and Management
Technology & Software
Highlights the dual role of CROs in enabling and overseeing AI adoption in risk management.
CRO, AI implementation, risk management, roles
false
Risk Assessment and Management
Technology & Software technology-and-software
Header Vertical
PwC/Strategy&
View slide
Comparative analysis with a table showing top 10 CRO risk priorities from 2012 to 2022, alongside a bar chart of top risk priorities for the next 12 months.
Risk Assessment and Management
Financial Services
This slide presents a comprehensive view of changing CRO risk priorities over a decade, emphasizing cybersecurity and credit risk as top concerns for the coming year.
CRO, Risk Priorities, Cybersecurity, Credit Risk, Analysis
false
Risk Assessment and Management
Financial Services financial-services
Mixed Chart
EY
View slide
The slide has a large number "05" and a bar chart. The right side lists ways CROs expect their roles to evolve, while the left provides an overview of the CRO's changing role.
Strategic Planning
Financial Services
This slide explains the evolving role of CROs in the insurance industry, highlighting future expectations and the importance of strategic risk management.
CRO, risk management, insurance, role evolution, strategic planning
false
Strategic Planning
Financial Services financial-services
Mixed Chart
EY
View slide
The slide combines text and a column chart, depicting the alignment between CROs and boards on key risk management priorities, including cybersecurity risk and business model risk.
Strategic Planning
Financial Services
It illustrates the alignment of risk management priorities between CROs and boards, focusing on cybersecurity and business model risks. This slide is crucial for strategic planning and ensuring cohesive risk management strategies across leadership levels.
CROs, boards, risk management, alignment, cybersecurity, business model
false
Strategic Planning
Financial Services financial-services
Multiple Chart
EY
View slide
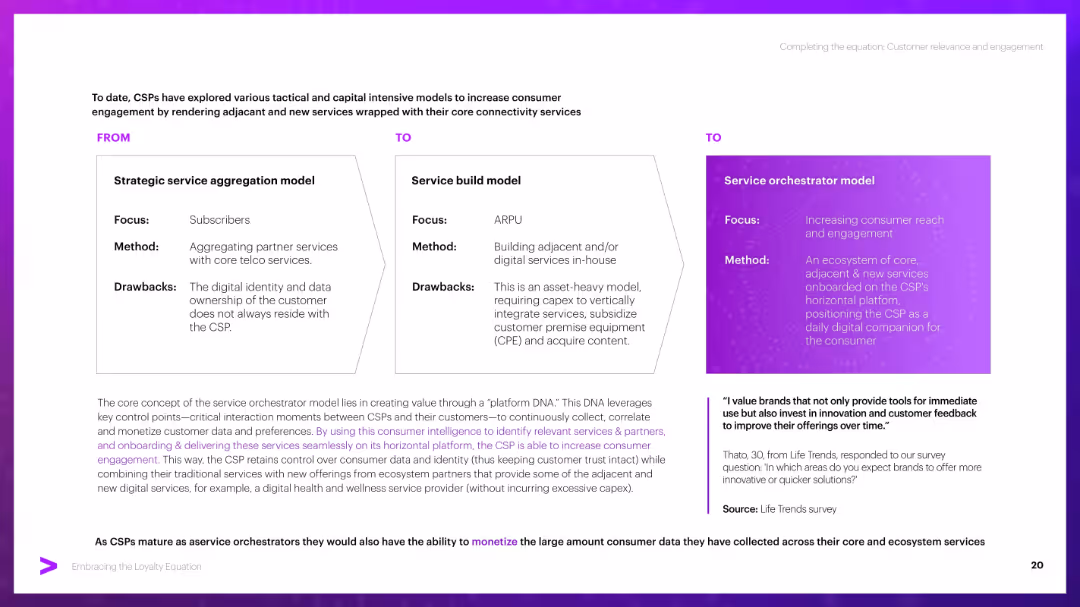
Three-column "FROM–TO–TO" visual structure with boxed content. Bottom has a paragraph block and a quote with purple highlights. Consistent use of purple theme and gradient for emphasis.
Strategic Planning
Telecommunications
Compares three CSP service models: aggregation, service build, and orchestrator. Emphasizes the orchestrator model’s benefit in owning data and driving engagement via a horizontal platform, providing tailored, adjacent services to customers.
CSP models, aggregation, platform DNA, engagement, monetization, orchestrator
false
Strategic Planning
Telecommunications telecommunications
Header Horizontal
Accenture
View slide
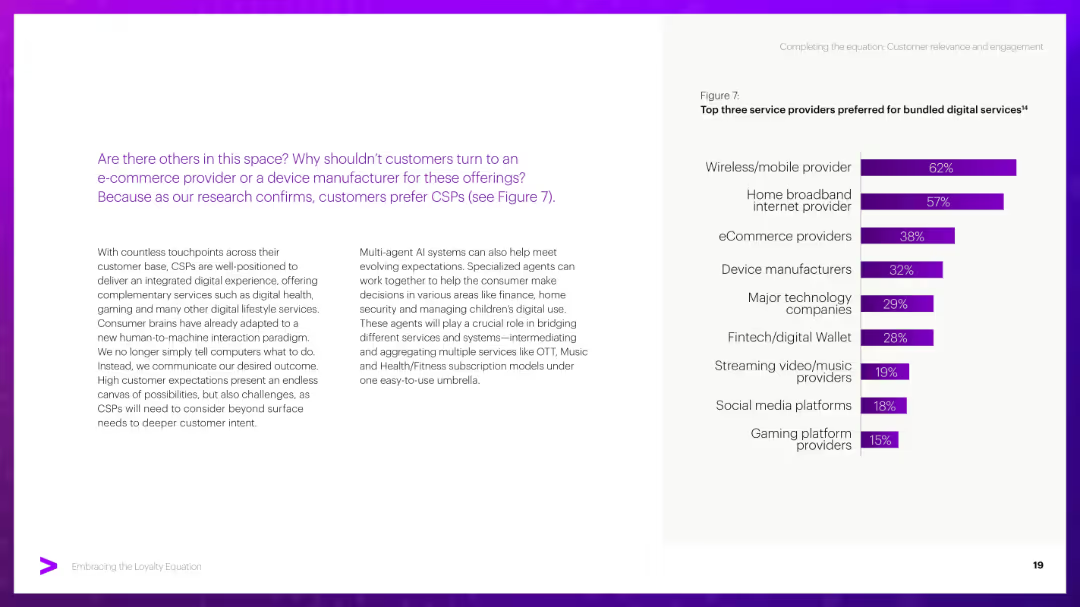
Split layout with a central question in purple, two text columns with paragraphs, and a horizontal bar chart on the right. The design maintains a clean white background with purple highlights.
Competitive Landscape
Telecommunications
Argues that although other service providers exist (e.g., eCommerce, tech firms), consumers still prefer CSPs. Includes data on preferred providers and discusses AI’s potential to integrate services and improve customer engagement.
CSPs, digital services, eCommerce, AI agents, consumer preference, integration
false
Competitive Landscape
Telecommunications telecommunications
Mixed Chart
Accenture
View slide
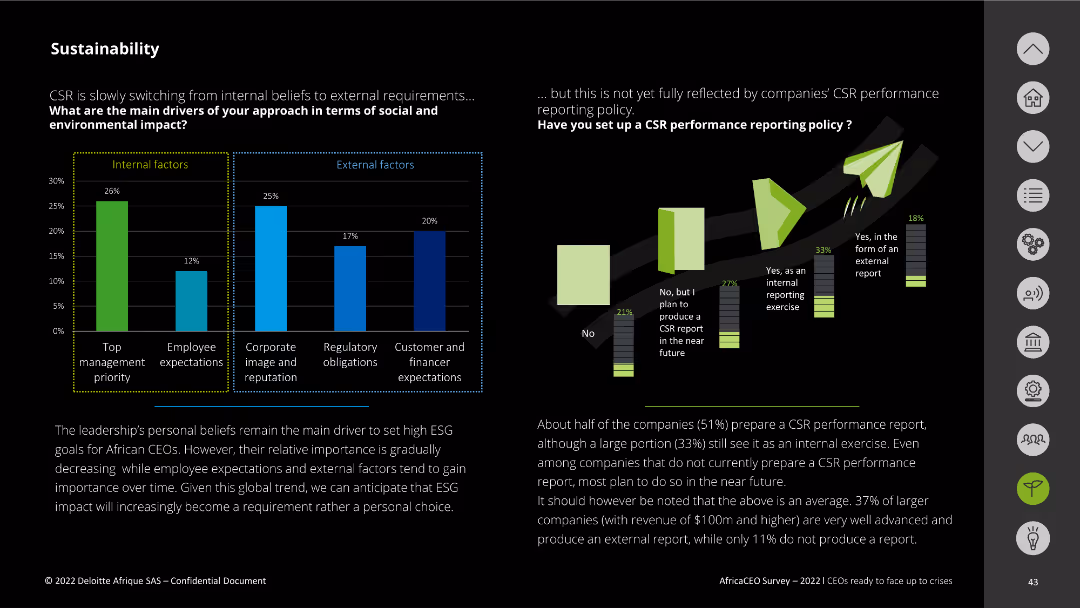
Featuring bar charts, this slide shows internal and external factors driving social and environmental impact, and CSR performance reporting policies.
Risk Assessment and Management
Environmental Services & Sustainability
It identifies key internal and external factors influencing social and environmental impact and the status of CSR performance reporting among companies.
CSR, internal factors, external factors, reporting policy, environmental impact
false
Risk Assessment and Management
Environmental Services & Sustainability environmental-services-and-sustainability
Multiple Chart
Deloitte
View slide
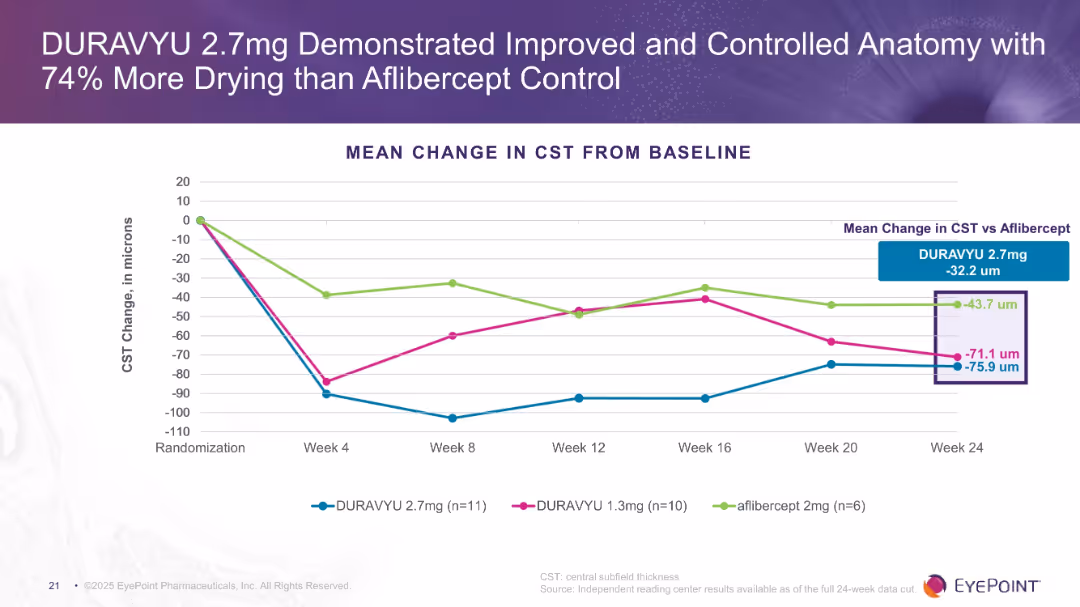
Line chart showing CST change in microns across treatment arms over 24 weeks. Clear visual comparison of drying effects. Purple theme consistent with previous slides.
Product and Service Analysis
Healthcare & Pharmaceuticals
The slide emphasizes anatomical control with DURAVYU 2.7mg, showing greater reduction in CST compared to aflibercept and DURAVYU 1.3mg. Indicates more efficient fluid reduction in the retina.
CST, drying, anatomical improvement, retina, DURAVYU, aflibercept
false
Product and Service Analysis
Healthcare & Pharmaceuticals healthcare-and-pharmaceuticals
Single Chart
Goldman Sachs
View slide
Diagram showing hierarchical structure with CTO, CEO, COO, and CFO.
Organizational Structure and Change
Professional Services
Defines the role and responsibilities of a Chief Transformation Officer within a corporate hierarchy.
CTO, roles, corporate, hierarchy, leadership
false
Organizational Structure and Change
Professional Services professional-services
Diagram
McKinsey
View slide
Content slide with three icons and descriptions: Person-Level, In-Session, and Modernized. Each section details different aspects of CTV ad optimization.
Technology and Digital Transformation
Media & Entertainment
Describes the unique features of Nielsen Streaming Signals, focusing on person-level optimization, session data, and modern privacy measures.
CTV, ad optimization, Nielsen, person-level, in-session, modernized
false
Technology and Digital Transformation
Media & Entertainment media-and-entertainment
Header Vertical
Nielsen
View slide
A column chart showing total usage of the TV screen by various viewing activities in January 2021 and January 2022, with color-coded categories.
Market Analysis and Trends
Media & Entertainment
The slide highlights the increasing share of connected TV (CTV) and time-shifting in total TV screen usage, reflecting changes in viewing habits over the past year.
CTV, television, usage, viewing habits, trends
false
Market Analysis and Trends
Media & Entertainment media-and-entertainment
Mixed Chart
Nielsen
View slide
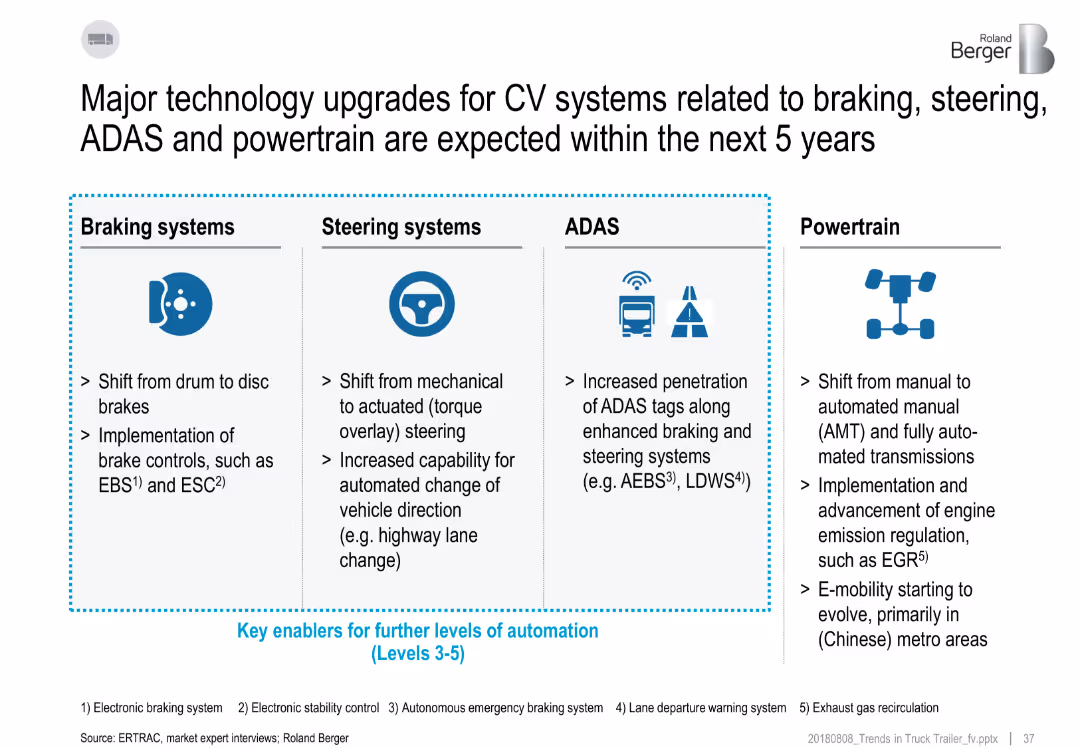
4-column layout detailing advancements in braking, steering, ADAS, and powertrain systems; includes icons and bullet points
Technology and Digital Transformation
Industrial & Manufacturing
This slide outlines expected advancements in commercial vehicle systems over five years. Braking will shift to disc systems, steering will become actuated, ADAS will expand with automated features, and powertrains will move to automation and e-mobility. These are seen as enablers for higher vehicle automation levels.
CV systems, braking, steering, ADAS, powertrain, automation, trends, upgrades
false
Technology and Digital Transformation
Industrial & Manufacturing industrial-and-manufacturing
Pillar
Roland Berger
View slide
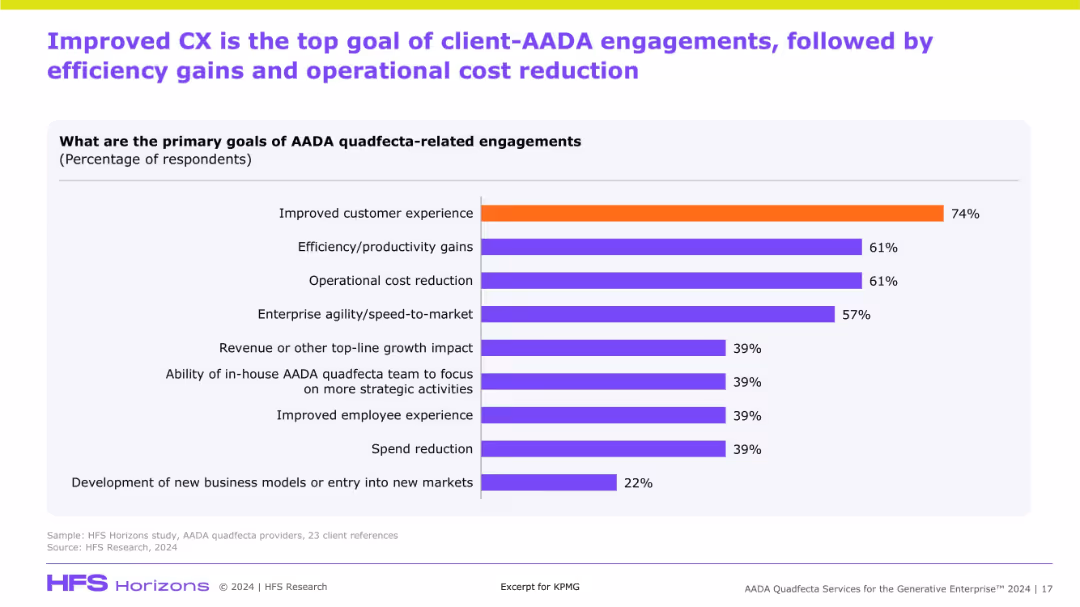
Horizontal bar chart showing top goals of AADA initiatives, ranked by percentage. Emphasizes customer experience, efficiency, and cost reduction.
Performance Metrics and KPIs
Artificial Intelligence
This slide summarizes client priorities in AADA initiatives, with customer experience ranked highest, followed by operational efficiency and cost reduction. It indicates the business outcomes driving adoption of AADA technologies.
CX, AADA, KPIs, cost reduction, efficiency, client goals, transformation, customer focus
false
Performance Metrics and KPIs
Artificial Intelligence artificial-intelligence
Single Chart
KPMG
View slide
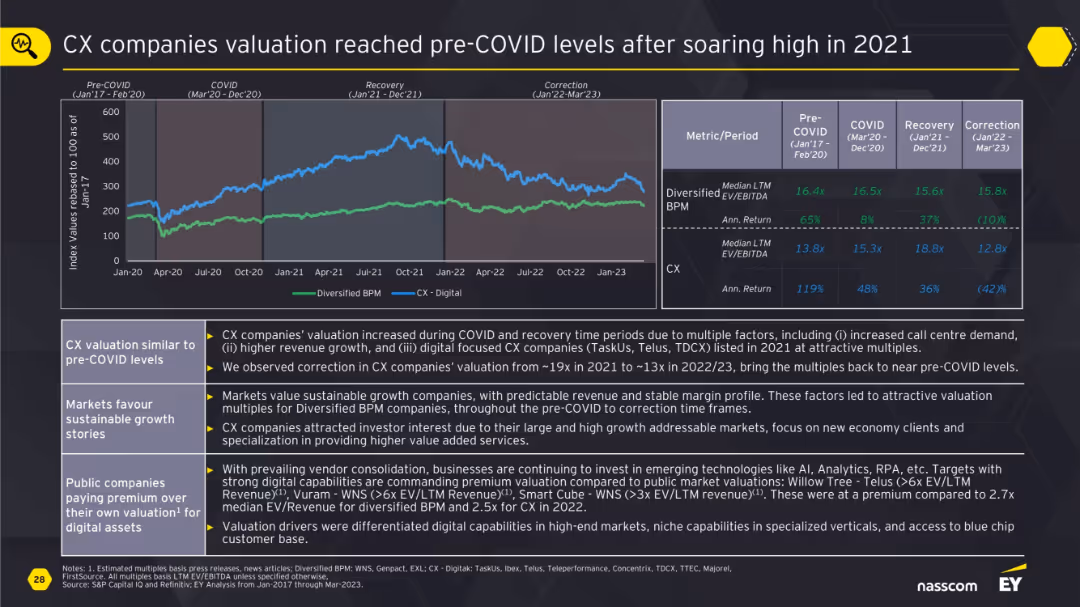
Line chart of Diversified BPM vs CX-Digital with a metrics table on valuation and returns over four phases; annotated analysis below.
Financial Performance
Professional Services
This slide shows how CX companies saw a valuation surge during COVID and recovery phases due to digital expansion and demand growth. By 2023, valuations corrected back to pre-COVID levels. Diversified BPM firms with stable margins maintained better valuation profiles, while CX companies still commanded premium due to niche digital capabilities.
CX, BPM, valuation, digital growth, COVID impact, returns, premium, public markets
false
Financial Performance
Professional Services professional-services
Mixed Chart
EY
View slide
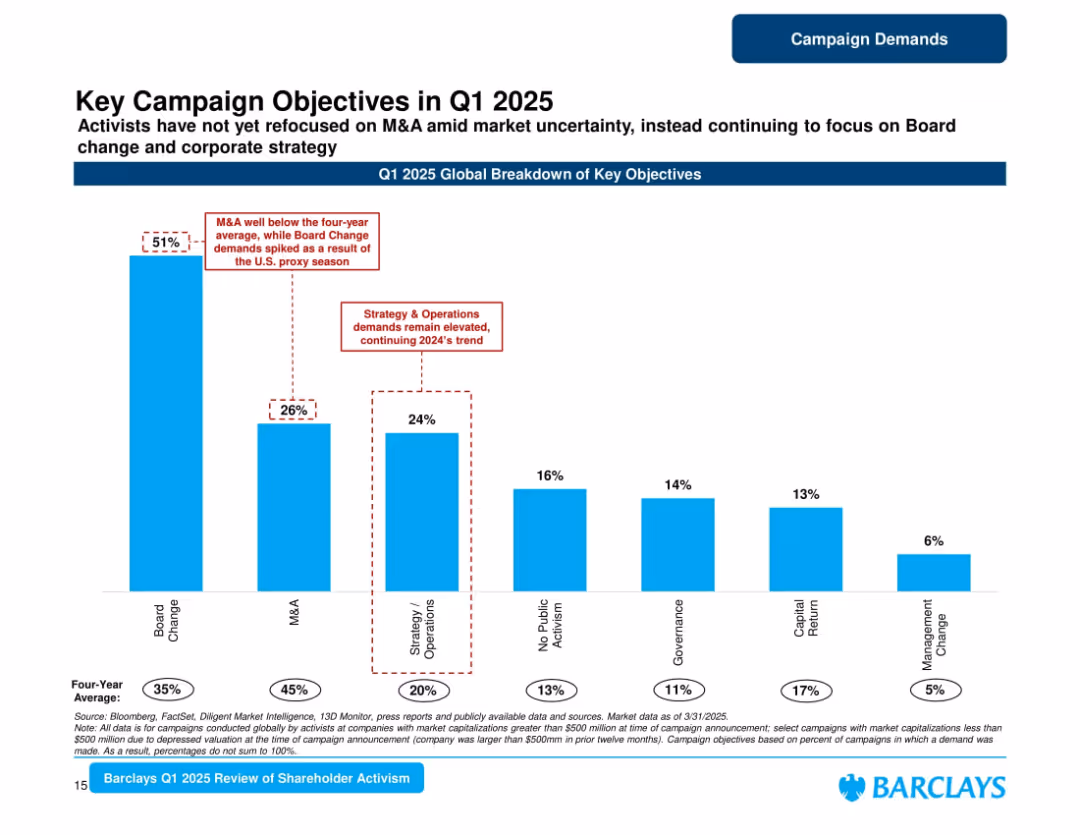
Tall vertical bar chart with annotated highlights and color-coded categories. Sparse layout with white background.
Strategic Planning
Financial Services
Highlights global activist campaign objectives in Q1 2025, with Board Change leading at 51%. M&A is down compared to average. Strategy & Operations and other categories are also tracked, with comparison to historical averages.
Campaigns, Objectives, Board Change, M&A, Strategy, Governance, 2025, Shareholder, Activism
false
Strategic Planning
Financial Services financial-services
Single Chart
Barclays
View slide
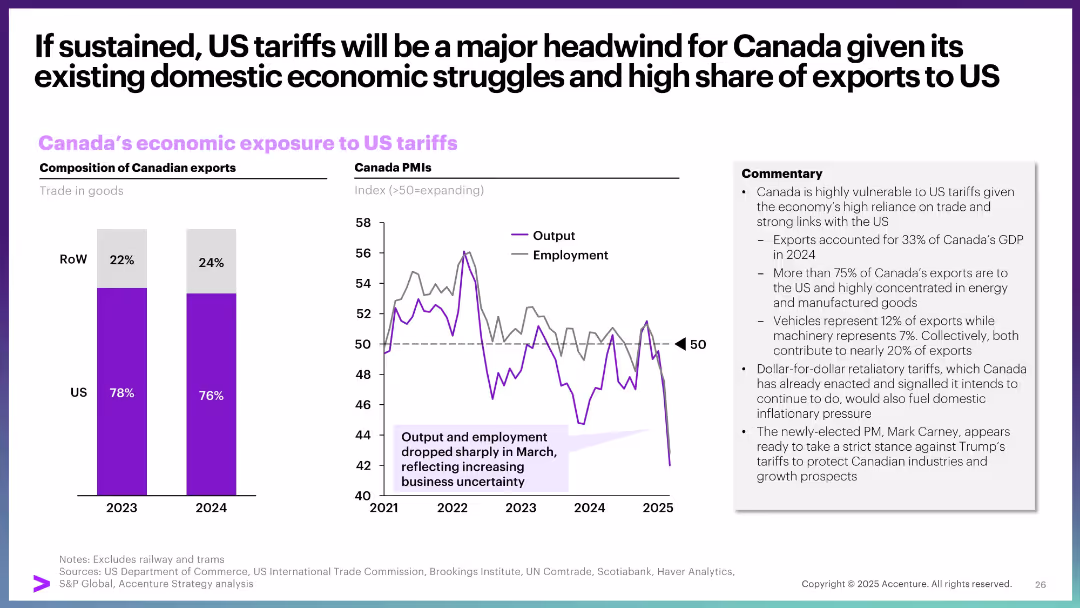
Left: bar chart of Canadian exports by destination. Right: line graph of Canada PMIs. Commentary box summarizes economic vulnerability.
Market Analysis and Trends
Government & Public Sector
This slide presents how US tariffs affect Canada, emphasizing high reliance on US trade. Canadian exports are heavily US-oriented, and economic indicators like PMIs show rising business uncertainty and declining performance, particularly in output and employment.
Canada, US tariffs, exports, PMI, economic impact, trade reliance, policy risk
false
Market Analysis and Trends
Government & Public Sector government-and-public-sector
Multiple Chart
Accenture
View slide
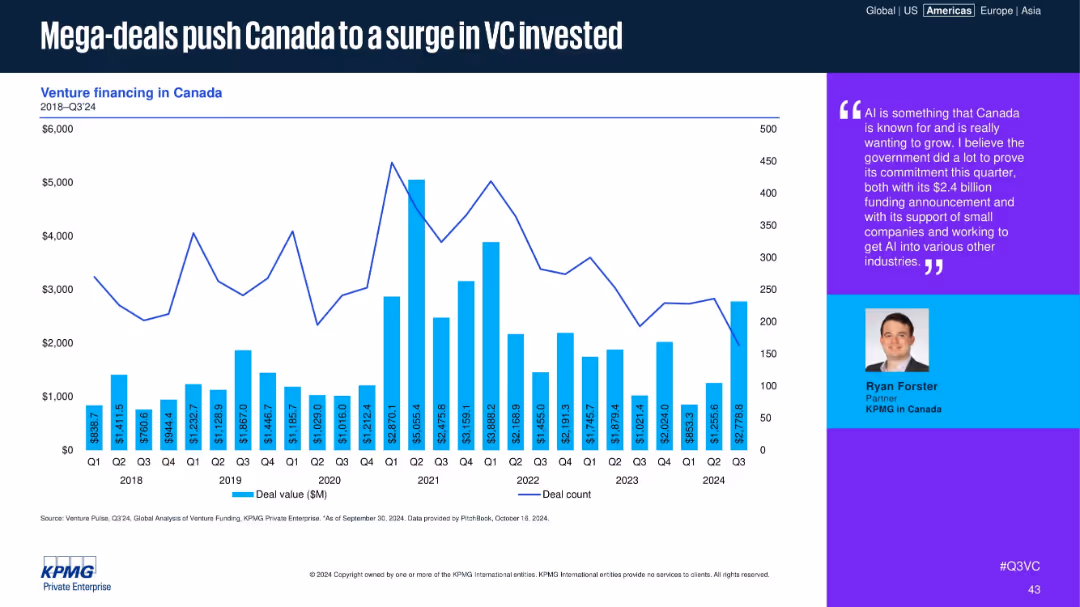
Bar and line graph of Canadian deal values and counts, with a text box quoting a KPMG partner.
Financial Performance
Financial Services
The chart shows quarterly Canadian VC deal activity, highlighting recent spikes due to mega-deals. A quote from a KPMG partner emphasizes Canada’s strategic investment in AI and the government's role in enabling ecosystem growth.
Canada, VC, mega-deals, AI, funding spike, government support, KPMG, deal value, ecosystem, investment
false
Financial Performance
Financial Services financial-services
Mixed Chart
KPMG
View slide
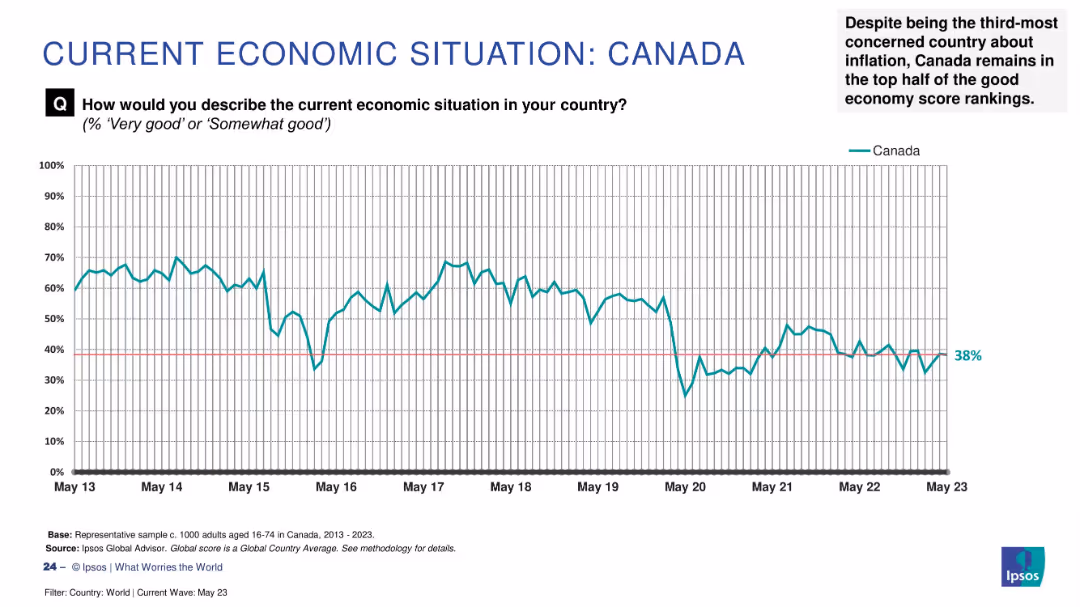
Line graph tracking Canada's economic sentiment (2013–2023); explanatory note in top right summarizes context.
Strategic Planning
Financial Services
Canada's “good economy” score stands at 38%, placing it in the upper half of the global ranking despite inflation concerns. The time-series chart shows fluctuations over the last decade, with a notable dip in May 2020. The narrative notes Canada’s resilience relative to other economies.
Canada, economic sentiment, Ipsos, inflation, public perception, resilience, global context, economic trend
false
Strategic Planning
Financial Services financial-services
Single Chart
IPSOS
View slide
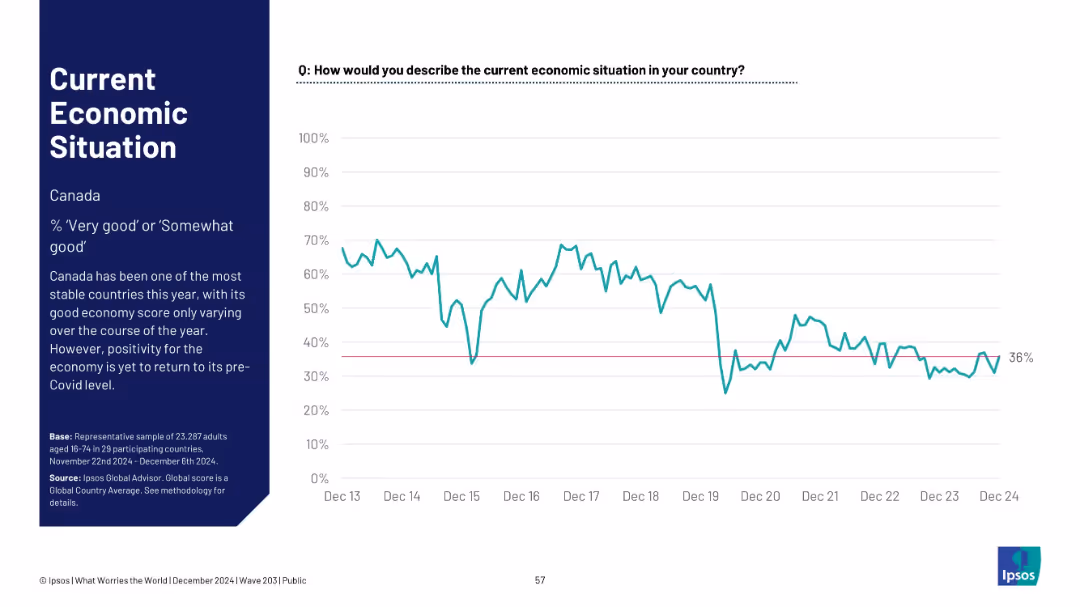
Time series chart with sidebar commentary; single line representing economic sentiment in Canada.
Market Analysis and Trends
Financial Services
Canada’s economic sentiment has remained stable throughout 2024, with current perception at 36%. However, sentiment remains below pre-COVID levels.
Canada, economic stability, Ipsos survey, long-term data, post-COVID comparison, macro sentiment, consistent trend
false
Market Analysis and Trends
Financial Services financial-services
Mixed Chart
IPSOS
View slide
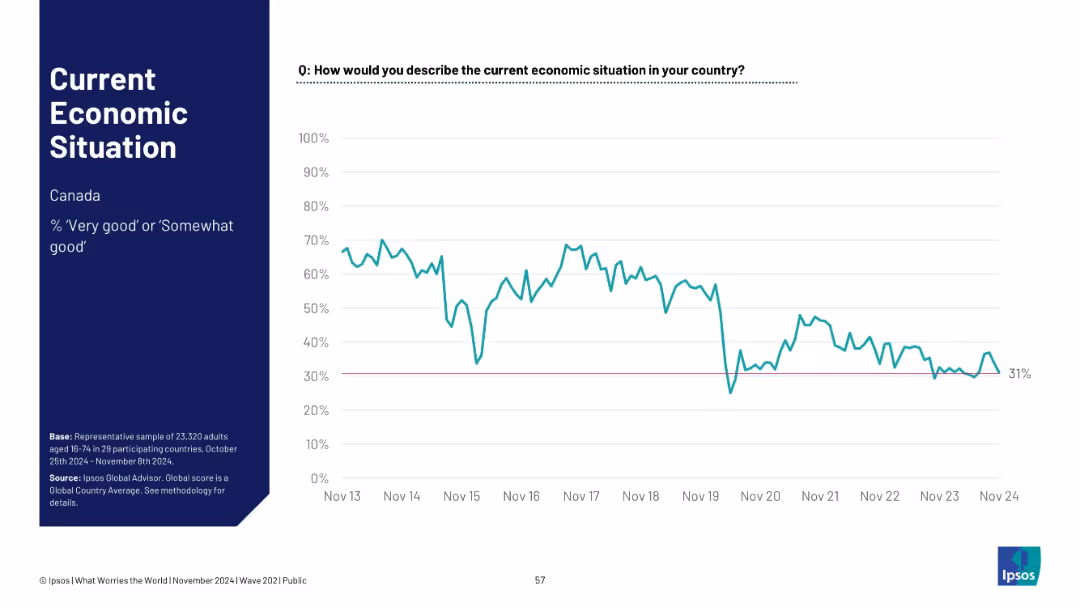
Single-country (Canada) line chart tracking positive economic sentiment since 2013; ends at 31%.
Financial Performance
Financial Services
Tracks Canadian public sentiment on the economy from 2013–2024. After high early optimism, sentiment declines and stabilizes below 40%, reflecting shifting economic realities such as inflation, housing, and employment factors.
Canada, economic trend, financial sentiment, Ipsos, time series, public opinion, macroeconomy, national outlook
false
Financial Performance
Financial Services financial-services
Single Chart
IPSOS
View slide
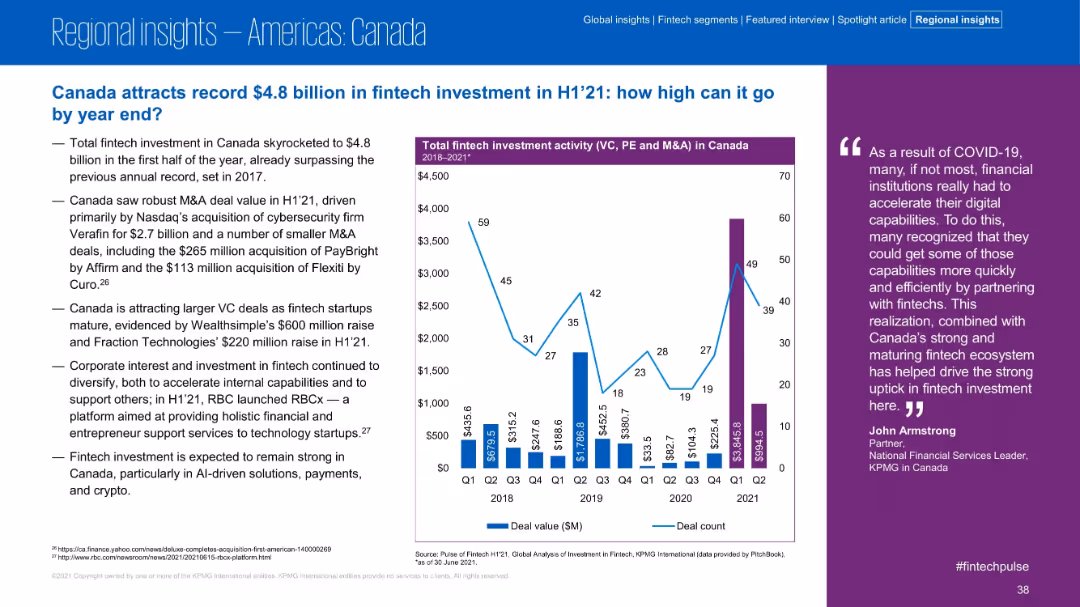
Left section contains text summary; right side bar and line chart shows deal value and count; consistent blue and purple color scheme
Market Analysis and Trends
Financial Services
Canadian fintech investment surged in H1 2021 to $4.8B, surpassing prior records. M&A and large VC deals contributed, such as Wealthsimple’s $600M raise. Corporate interest expanded with platforms like RBCx. The market is expected to remain strong due to maturing startups and digital transformation.
Canada, fintech, VC deals, Wealthsimple, RBCx, digital transformation, M&A, 2021 investment
false
Market Analysis and Trends
Financial Services financial-services
Mixed Chart
KPMG
View slide
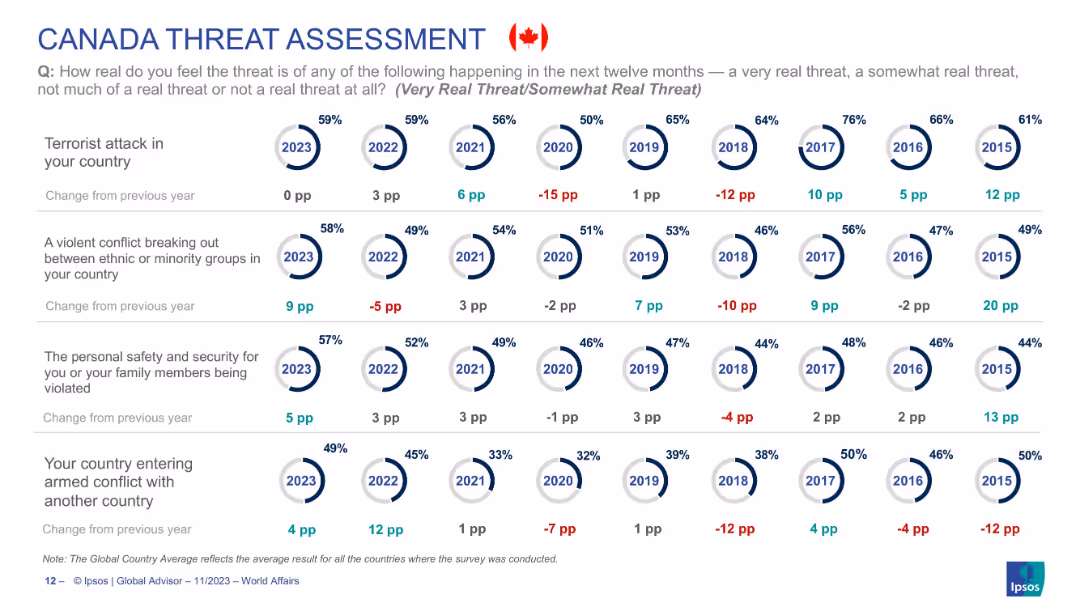
Continuation of Canadian-focused threat perception data, using the same circular format and year-over-year comparisons.
Risk Assessment and Management
Government & Public Sector
Covers additional Canadian threat perceptions: terrorism, ethnic conflict, personal safety, and war. Shows shifts over time with a noticeable rise in concern for ethnic conflict (+9pp). Highlights the Canadian public’s sentiment evolution toward both domestic and geopolitical threats.
Canada, public security, terrorism, ethnic tension, armed conflict, safety, national opinion, Ipsos
false
Risk Assessment and Management
Government & Public Sector government-and-public-sector
Single Chart
IPSOS
View slide
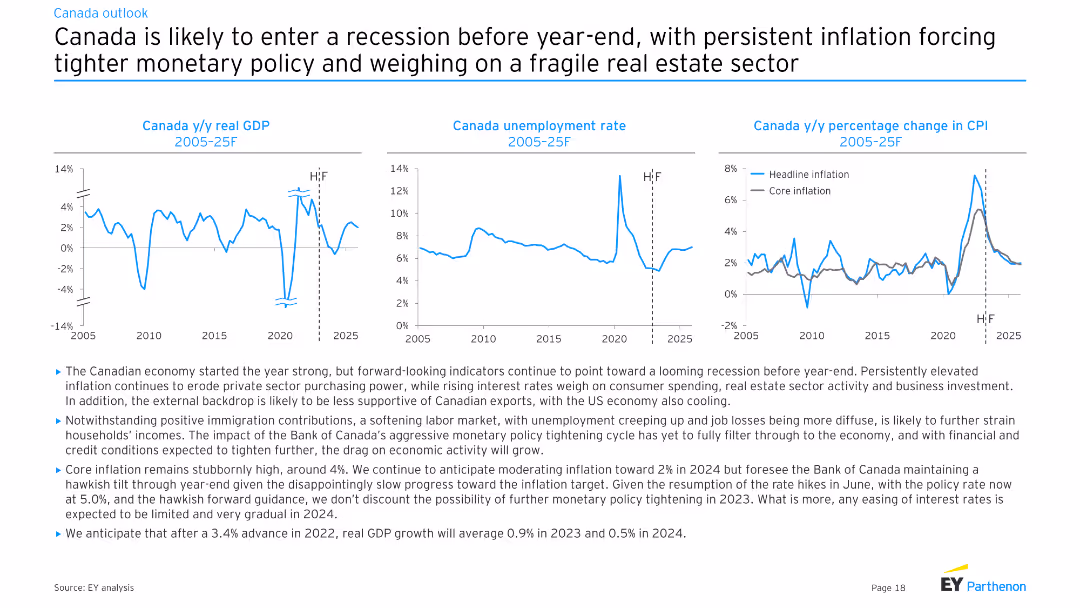
The slide features three line charts showing Canada’s y/y real GDP, unemployment rate, and y/y percentage change in CPI from 2005 to 2025F. The charts highlight both historical data and forecasts.
Market Analysis and Trends
Financial Services
This slide projects a looming recession for Canada by the end of the year, driven by persistent inflation and tighter monetary policy, with impacts on GDP, unemployment, and CPI.
Canada, recession, GDP, unemployment, inflation
false
Market Analysis and Trends
Financial Services financial-services
Multiple Chart
EY
View slide
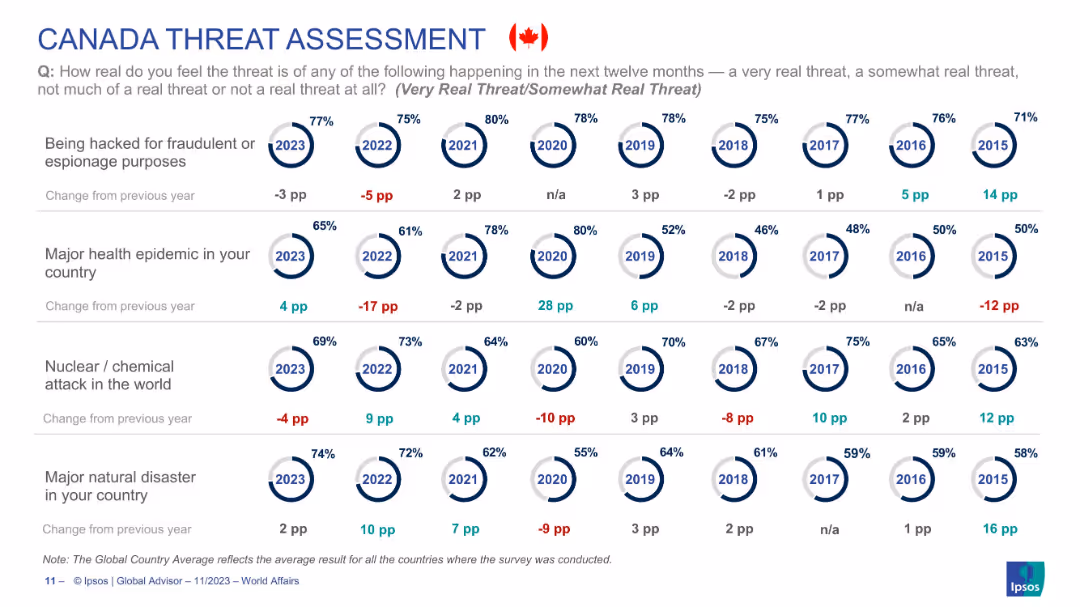
Circular year-wise risk perception visualization focused solely on Canadian public opinion across four threat types.
Risk Assessment and Management
Government & Public Sector
Reflects Canadians’ changing concern levels for hacking, health epidemics, nuclear/chemical attacks, and natural disasters from 2015–2023. Health epidemic threat rises 4pp in 2023, while hacking concerns decrease. The data highlights shifts in national sentiment toward global and domestic risks over time.
Canada, threat perception, epidemic, natural disaster, nuclear risk, cybersecurity, Ipsos, public opinion
false
Risk Assessment and Management
Government & Public Sector government-and-public-sector
Single Chart
IPSOS
View slide
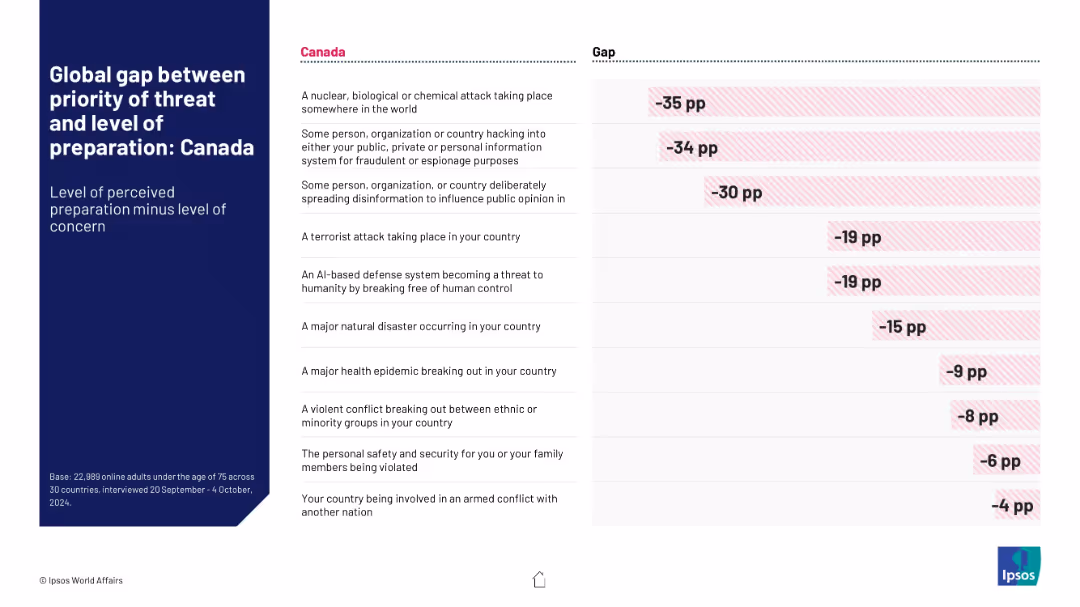
Same structure as 18836 but specific to Canada. Red-striped bars and values illustrate larger negative gaps compared to global averages.
Risk Assessment and Management
Government & Public Sector
Canadian-specific data revealing stark differences between perceived threat levels and government readiness. Largest gaps are seen in cyber threats and NBC events, indicating significant public skepticism.
Canada, threat perception, preparedness gap, hacking, disinformation, crisis readiness
false
Risk Assessment and Management
Government & Public Sector government-and-public-sector
Mixed Chart
IPSOS
View slide
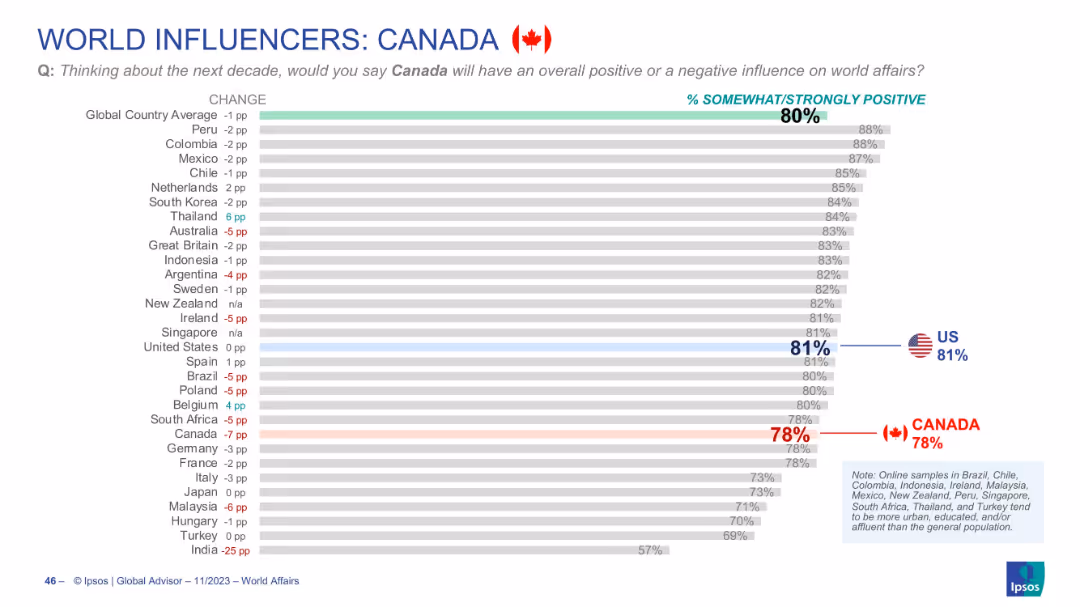
Horizontal bar chart with grey bars showing % positive views of Canada globally; country flags/icons and arrows
Market Analysis and Trends
Government & Public Sector
Shows global perceptions of Canada's influence on world affairs over the next decade. Canada scores 78% positive, slightly below the global average (80%) and U.S. (81%). Includes year-over-year change indicators.
Canada, world influence, perception, Ipsos, global views, public opinion, bar chart, positive rating, global affairs, trend
false
Market Analysis and Trends
Government & Public Sector government-and-public-sector
Single Chart
IPSOS
View slide
The slide includes three line charts showing Canada y/y real GDP (2012-25F), Canada unemployment rate (2012-25F), and Canada y/y CPI (2012-25F). The charts display historical data and future projections with clear labels and demarcations for important time points.
Market Analysis and Trends
Financial Services
The slide forecasts a slowdown in the Canadian economy through mid-2024, highlighting constraints due to elevated debt servicing costs and cost fatigue. It analyzes trends in GDP, unemployment, and CPI, discussing their implications for economic activity.
Canadian economy, GDP, unemployment, CPI, forecast
false
Market Analysis and Trends
Financial Services financial-services
Multiple Chart
EY
View slide
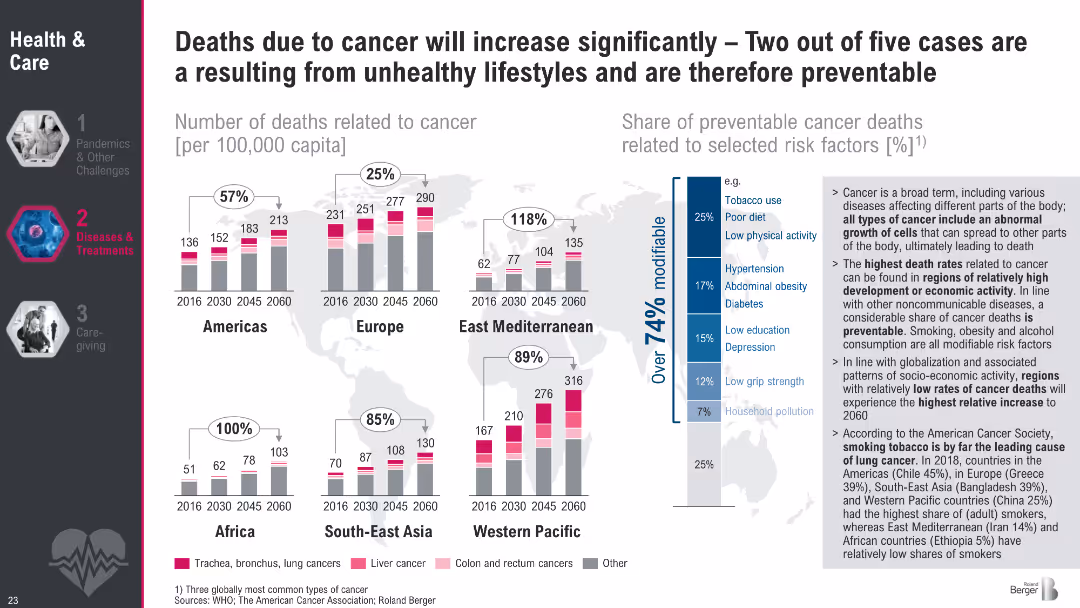
Regional bar charts showing cancer mortality trends (2016–2060) with breakdown by type. Right sidebar covers modifiable risk factors and smoking data.
Risk Assessment and Management
Healthcare & Pharmaceuticals
The slide forecasts a sharp increase in cancer-related deaths by 2060, particularly in regions undergoing development. Lung, liver, and colorectal cancers are the most common. It emphasizes that 40% of cases are preventable through risk factor reduction, including tobacco use and diet. The sidebar details regional disparities in cancer risk and prevention strategies.
Cancer, mortality, lung cancer, lifestyle risk, tobacco, future projections, global health
false
Risk Assessment and Management
Healthcare & Pharmaceuticals healthcare-and-pharmaceuticals
Multiple Chart
Roland Berger
View slide
The slide features column charts comparing ASEAN steel market supply and demand from 2021 to 2030, with projections on domestic capacity and import reliance reduction.
Strategic Planning
Industrial & Manufacturing
This slide analyzes how new domestic capacity expansions in ASEAN are projected to reduce the supply-demand gap and lower import reliance by 2030, with supporting data visualizations.
Capacity expansion, ASEAN, supply-demand, import reliance, 2030, projections, domestic supply, market analysis
false
Strategic Planning
Industrial & Manufacturing industrial-and-manufacturing
Single Chart
BCG
View slide
This slide features four colored circles representing "Capacity," "Cost," "Capability," and "Composition" with associated questions. The right side has detailed descriptions related to each element. Simple layout with minimal visuals.
Human Resources and Talent Management
Financial Services
The slide discusses key factors insurers consider for future workforce needs: capacity, cost, capability, and composition. It emphasizes strategic planning and workforce adaptability.
Capacity, Cost, Capability, Composition, Workforce Planning, Insurers, Strategic Objectives, Measurement, Future Workforce
false
Human Resources and Talent Management
Financial Services financial-services
Framework
EY
Previous
Loading...
Hold On!
We are searching in our database
If nothing, comes up, please try different filters!
Column Chart
Heatmap
Chevron
Org Chart
Infographic
Callouts
Timeline
List
Graphic
Picture
Process Flow
Diagram
Paragraph
Map
Table
Framework
Subtitle
Takeaway Box
Icon
Other Chart
Radar Chart
Waterfall Chart
Mekko Chart
Pie Chart
Scatter Plot
Line Chart
Bar chart
Bullet points
Create a FREE account to continue browsing
Receive Instant Access to 1,000+ slides from companies like McKinsey, Google, and Goldman Sachs
First Name
Last Name
Email
Password
I agree to all
Terms & Privacy Policy
Thank you! Your submission has been received!
Oops! Something went wrong while submitting the form.
Have an account?
Sign in
Upgrade to PRO to Save slides
Advanced Search and Filters
Access to 15,000+ slides
Access to Category Pages
Save/Bookmark Slides
PowerPoint Template Library
Pick a Plan
MONTHLY
$12/month
Billed every month, Cancel anytime.
YEARLY
$9/year
Billed $108 annually, Cancel anytime.
Checkout for $12/month
Checkout for $108/yr
Secured by Stripe | AES-256 bit encryption