My Account
My Slides
Search by Category
Templates
View All Templates
Download Template Slides
Leave Feedback
Login
Logout
Get Started
Browse all Slides
Browse all Slides
Create a FREE Account
Instant access to 1,000+ real slides from top companies like McKinsey, BCG, Goldman Sachs, Google and many more!
First Name
Last Name
Email
Password
I agree to all
Terms & Privacy Policy
Thank you! Your submission has been received!
Oops! Something went wrong while submitting the form.
Have an account?
Sign in
Spark Your Next Big Idea with New Presentation Templates
VIEW ALL Templates
Welcome,
Welcome
PRO
Show Featured Only
Checkbox 8
Companies
Mckinsey
Bain
BCG
EY
Deloitte
Accenture
PwC/Strategy&
JP Morgan
Goldman Sachs
Morgan Stanley
Citigroup
Deutsche Bank
Barclays
LEK
KPMG
Kearney
Oliver Wyman
Booz Allen Hamilton
Gartner
IPSOS
Nielsen
Slide type
Text Only
Linear Flow
Vertical Flow
Single Chart
Header Horizontal
Mixed Chart
Header Vertical
Pillar
Multiple Chart
Graphic
Agenda
Title
Table
Framework
Industry
Technology & Software
Artificial Intelligence
Financial Services
Retail & E-commerce
Consumer Goods
Industrial & Manufacturing
Transportation & Logistics
Telecommunications
Real Estate & Construction
Hospitality & Tourism
Professional Services
Education & Training
Media & Entertainment
Agriculture & Food Production
Healthcare & Pharmaceuticals
Environmental Services & Sustainability
Government & Public Sector
Use Case
Mergers and Acquisitions
Performance Metrics and KPIs
Client Case Studies
Competitive Landscape
Corporate Finance and Valuation
Product and Service Analysis
Customer and Market Segmentation
Organizational Structure and Change
Industry Overview
Regulatory and Compliance
Risk Assessment and Management
Investment Analysis
Organizational Structure and Change
Human Resources and Talent Management
Financial Performance
Market Analysis and Trends
Sales and Business Development
Human Resources and Talent Management
Clear all
Thank you! Your submission has been received!
Oops! Something went wrong while submitting the form.
Tag
View slide
This slide contains a column chart showing cement production and imports over time, along with bullet points summarizing key trends and statistics.
Market Analysis and Trends
Industrial & Manufacturing
Provides an analysis of the Australian cement industry's reliance on imports. Highlights trends in production and import levels, the impact of infrastructure projects, and future market growth projections.
Cement, imports, production, market trends, Australia
false
Market Analysis and Trends
Industrial & Manufacturing industrial-and-manufacturing
Mixed Chart
LEK
View slide
The slide includes a column chart displaying the ratio of direct to distributed traffic according to an alternative central approach, which considers any source within the last 5 steps and excludes subsequent visits. Detailed annotations included.
Market Analysis and Trends
Media & Entertainment
This slide explores the ratio of direct to distributed traffic using an alternative central approach, considering any source within the last 5 steps before reaching news articles and excluding subsequent visits, providing insights into traffic patterns.
Central Approach, Direct Traffic, Distributed Traffic, Column Chart, Traffic Ratio
false
Market Analysis and Trends
Media & Entertainment media-and-entertainment
Single Chart
IPSOS
View slide
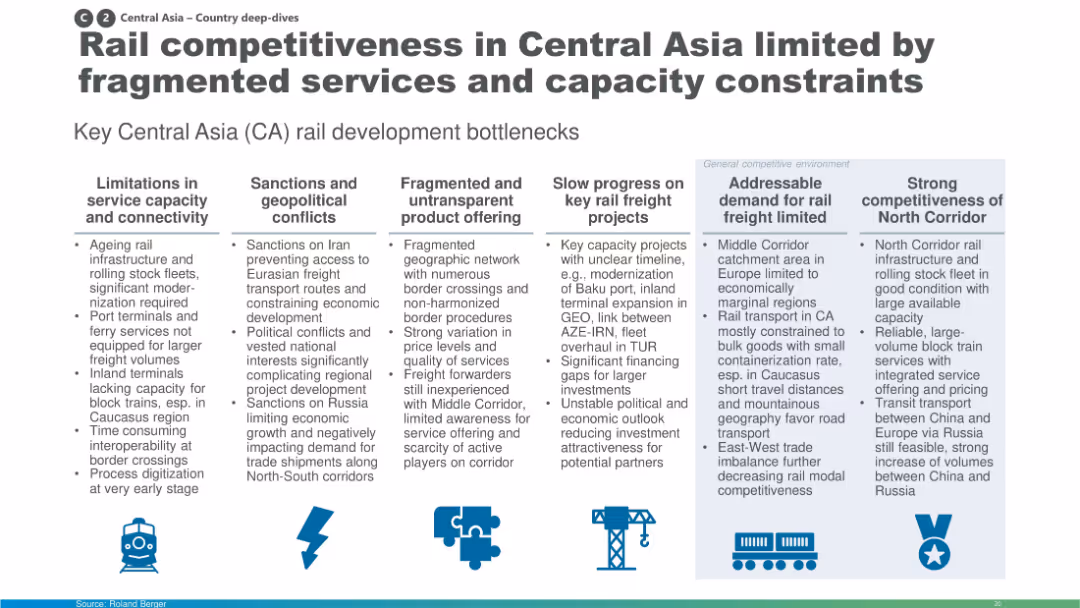
Column-based layout with icons and text boxes summarizing development bottlenecks like infrastructure limits, geopolitics, and fragmented offerings.
Market Analysis and Trends
Transportation & Logistics
The slide identifies major bottlenecks in Central Asia's rail freight development including outdated infrastructure, sanctions, non-transparent services, and weak demand. It also contrasts strong performance in the North Corridor. The insights are segmented under key thematic headers for clarity.
Central Asia, rail, infrastructure, connectivity, bottlenecks, sanctions, corridors
false
Market Analysis and Trends
Transportation & Logistics transportation-and-logistics
Pillar
Roland Berger
View slide
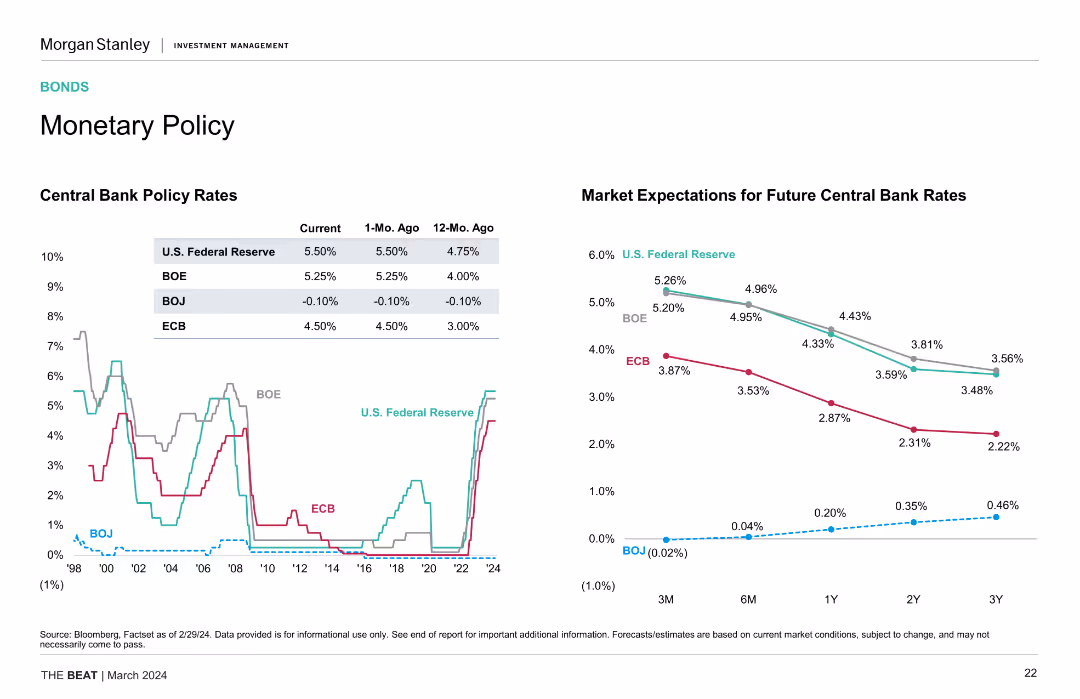
The slide features a line chart showing Central Bank Policy Rates and another chart showing Market Expectations for Future Central Bank Rates. Colors vary for different banks.
Market Analysis and Trends
Financial Services
The slide presents current, past, and expected future central bank rates for U.S. Federal Reserve, BOE, BOJ, and ECB, providing a comprehensive monetary policy overview.
Central Bank Rates, Monetary Policy, BOE, BOJ, ECB, U.S. Federal Reserve
false
Market Analysis and Trends
Financial Services financial-services
Multiple Chart
Morgan Stanley
View slide
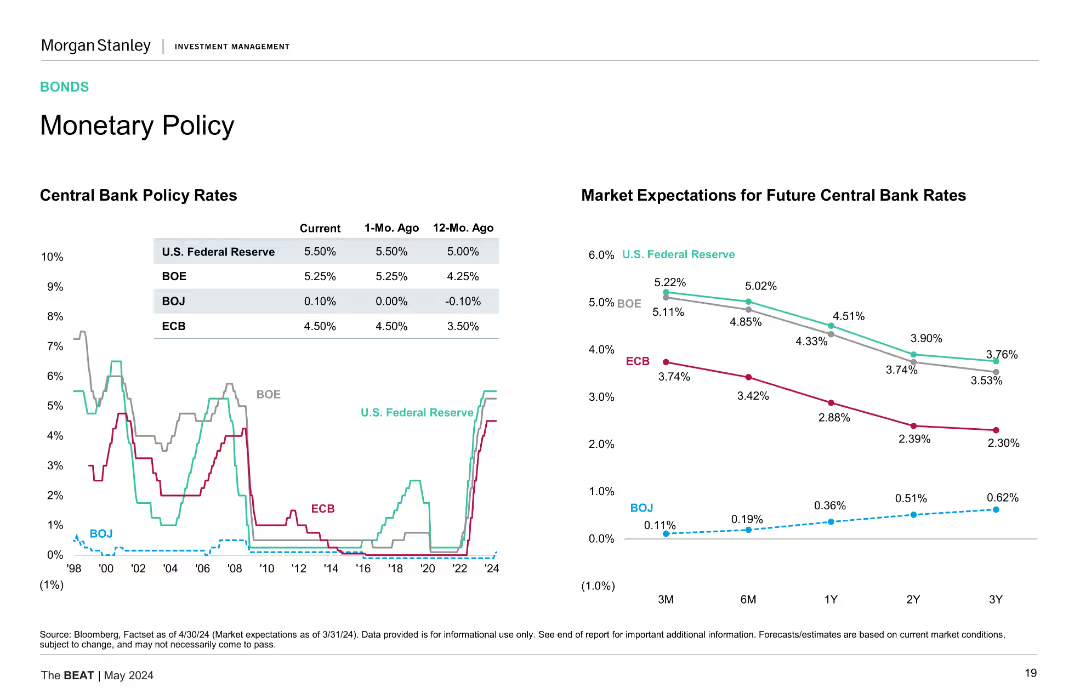
One table showing current policy rates of central banks and one line chart of market expectations for future central bank rates, illustrating rate changes and projections.
Strategic Planning
Financial Services
The slide presents current policy rates of major central banks and projects future rate changes, providing insights into monetary policy trends and market expectations.
Central Bank, Policy Rates, BOE, Fed, ECB, BOJ, Market Expectations, Monetary Policy Trends
false
Strategic Planning
Financial Services financial-services
Multiple Chart
Morgan Stanley
View slide
Features two line charts. The left chart shows central bank policy rates for the US Fed, BoE, BoJ, and ECB from 1998 to 2024. The right chart shows market expectations for future central bank rates over different time horizons.
Market Analysis and Trends
Financial Services
Discusses current and future central bank policy rates across major economies, emphasizing the impact on global financial markets and expectations for rate adjustments.
Central Bank, Policy Rates, Fed, BoE, BoJ, ECB, Market Expectations, Financial Markets, Global Economy
false
Market Analysis and Trends
Financial Services financial-services
Multiple Chart
Morgan Stanley
View slide
The slide portrays two line graphs, one depicting the mean and the other the median of central bank balance sheets relative to GDP, spanning over a century. The graphs show an increasing trend, particularly in recent years. The title, subtitle, and quote from the US Federal Reserve are also present.
Regulatory and Compliance
Financial Services
The slide examines central bank balance sheet trends and discusses the innovations in quantitative easing (QE) and Flexible Average Inflation Targeting (FAIT). It can serve to explain modern monetary policy tools and strategies, especially in response to economic crises.
Central Banks, Balance Sheets, GDP, Quantitative Easing, Inflation Targeting, Monetary Policy, Trends
false
Regulatory and Compliance
Financial Services financial-services
Single Chart
JP Morgan
View slide
The slide features a line chart plotting future expectations for central bank policy rates across the US, Eurozone, UK, and Japan. It has a white background with minimal distractions.
Investment Analysis
Financial Services
The slide offers a predictive analysis of central bank policy rates for key economies, likely aiding investors and financial planners in strategizing future investments and understanding the macroeconomic landscape influenced by central bank decisions.
Central Banks, Policy Rates, Predictive, US, Eurozone, UK, Japan, Finance
false
Investment Analysis
Financial Services financial-services
Single Chart
JP Morgan
View slide
Line chart showing historical central bank policy rates and another line chart showing market expectations for future central bank rates.
Market Analysis and Trends
Financial Services
Displays central bank policy rates over time for US, BOE, BOJ, and ECB, and future market expectations, aiding in understanding monetary policy trends.
Central bank, policy rates, future trends
false
Market Analysis and Trends
Financial Services financial-services
Multiple Chart
Morgan Stanley
View slide
This slide features a column chart breaking down the global foodservice market by ownership and geography for 2022. Different colors represent chains and independent establishments, with a yellow highlight on Italy.
Market Analysis and Trends
Hospitality & Tourism
This slide discusses the market share and growth of chain restaurants globally, emphasizing the significant growth driven by North America. It provides a geographical breakdown of market share for chains vs. independent establishments.
Chains, market share, growth, foodservice, geographical breakdown
false
Market Analysis and Trends
Hospitality & Tourism hospitality-and-tourism
Mixed Chart
Deloitte
View slide
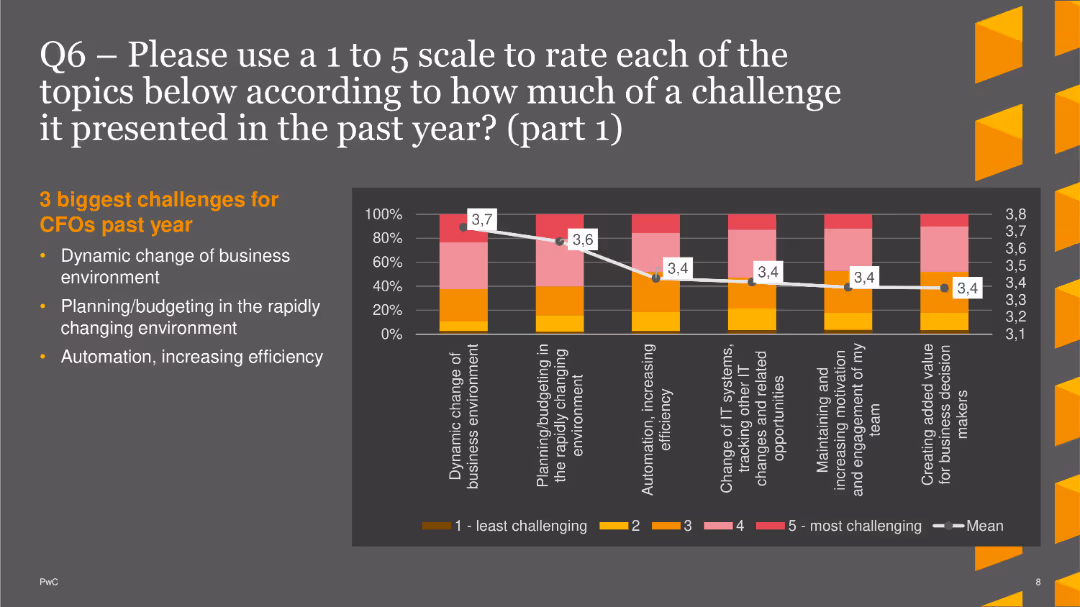
The slide displays a column chart rating the challenges faced by CFOs, including dynamic business changes and planning/budgeting.
Market Analysis and Trends
Financial Services
This slide shows the top three challenges for CFOs: dynamic business environment, planning/budgeting, and automation/efficiency, rated on a 1 to 5 scale.
Challenges, CFOs, Column Chart, PwC, Survey, 2022, Business Environment
false
Market Analysis and Trends
Financial Services financial-services
Mixed Chart
PwC/Strategy&
View slide
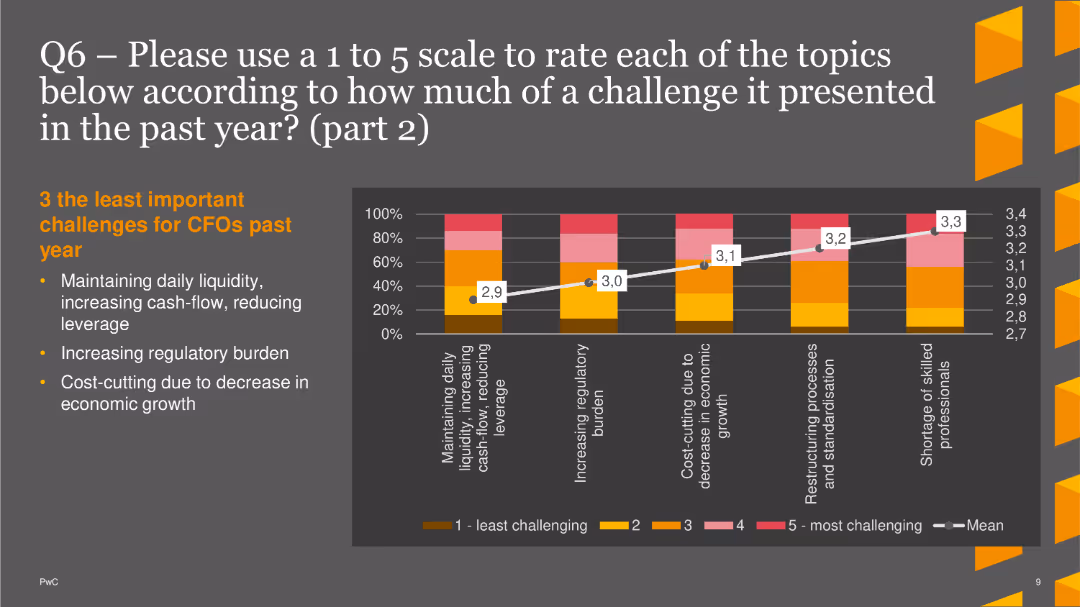
The slide features a column chart rating less significant challenges, such as maintaining liquidity and increasing regulatory burden.
Market Analysis and Trends
Financial Services
This slide highlights the least important challenges for CFOs: daily liquidity, regulatory burden, and cost-cutting, rated on a 1 to 5 scale.
Challenges, CFOs, Column Chart, PwC, Survey, 2022, Liquidity
false
Market Analysis and Trends
Financial Services financial-services
Mixed Chart
PwC/Strategy&
View slide
Showcases an oversized percentage figure emphasizing workforce planning, a pie chart on changes in business costs, and a column chart for perspectives on economic policy.
Operational Efficiency
Financial Services
Assesses ongoing business challenges like cost management and headcount planning, considering economic conditions and the corresponding fiscal policy stance from the Federal Reserve’s viewpoint.
Challenges, Costs, Workforce, Federal Reserve
false
Operational Efficiency
Financial Services financial-services
Multiple Chart
JP Morgan
View slide
The slide contains horizontal bar charts in a yellow background. It discusses challenges in food value chain partnerships.
Strategic Planning
Agriculture & Food Production
Highlights top challenges in establishing partnerships within the food value chain ecosystem, including network access and data sharing. Useful for strategic planning in sustainability and agriculture.
Challenges, Partnerships, Food Value Chain, Strategic Planning, Ecosystem
false
Strategic Planning
Agriculture & Food Production agriculture-and-food-production
Mixed Chart
Deloitte
View slide
Simplified flowchart with three main phases of change management: Installation, Realization, and Repeatability. Highlights key challenges at each stage with corresponding icons.
Organizational Structure and Change
Professional Services
Highlights the difficulties in achieving successful change management in organizations, focusing on the stages from strategy deployment to embedding new capabilities, and the common stalling points.
Change Management, Challenges, Organization, Strategy
false
Organizational Structure and Change
Professional Services professional-services
Linear Flow
Kearney
View slide
The slide presents a bar chart with arrows indicating percentage changes, focusing on practices like dedicating time to change management. It uses purple tones to differentiate total enterprise reinventors from transformers and optimizers.
Strategic Planning
Professional Services
Discusses the significance of communication in organizational change, focusing on the allocation of time, leadership communication, and skilling for effective delivery. The slide is a tool for analyzing the human aspects of organizational transformation and change management.
Change Management, Organizational Change, Leadership Communication, Skilling, Reinvention, Human Factors, Engagement Practices, Delivery Strategies
false
Strategic Planning
Professional Services professional-services
Multiple Chart
Accenture
View slide
The slide shows a line chart with four different colored dotted lines labeled as Technology, Individuals, Businesses, Public Policy. Each line shows an upward trend over time from the 1970s to today.
Market Analysis and Trends
Technology & Software
This slide depicts the varying rates of change and adoption in technology, individuals, businesses, and public policy over the years, illustrating how the future is unequally distributed. It could be used to discuss technology adoption patterns.
Change, Adoption, Technology, Policy, Trends
false
Market Analysis and Trends
Technology & Software technology-and-software
Single Chart
Deloitte
View slide
A mix of text and illustrative graphics depicting seamless integration of sales channels with customer-first view and adaptive strategies, including examples.
Strategic Planning
Professional Services
Urges a customer-first approach in channel strategy, focusing on integrated experiences and continual experimentation for cross-channel success.
Channel Strategy, Customer Experience, Cross-Channel Integration, Seamless Experience
true
Strategic Planning
Professional Services professional-services
Header Horizontal
BCG
View slide
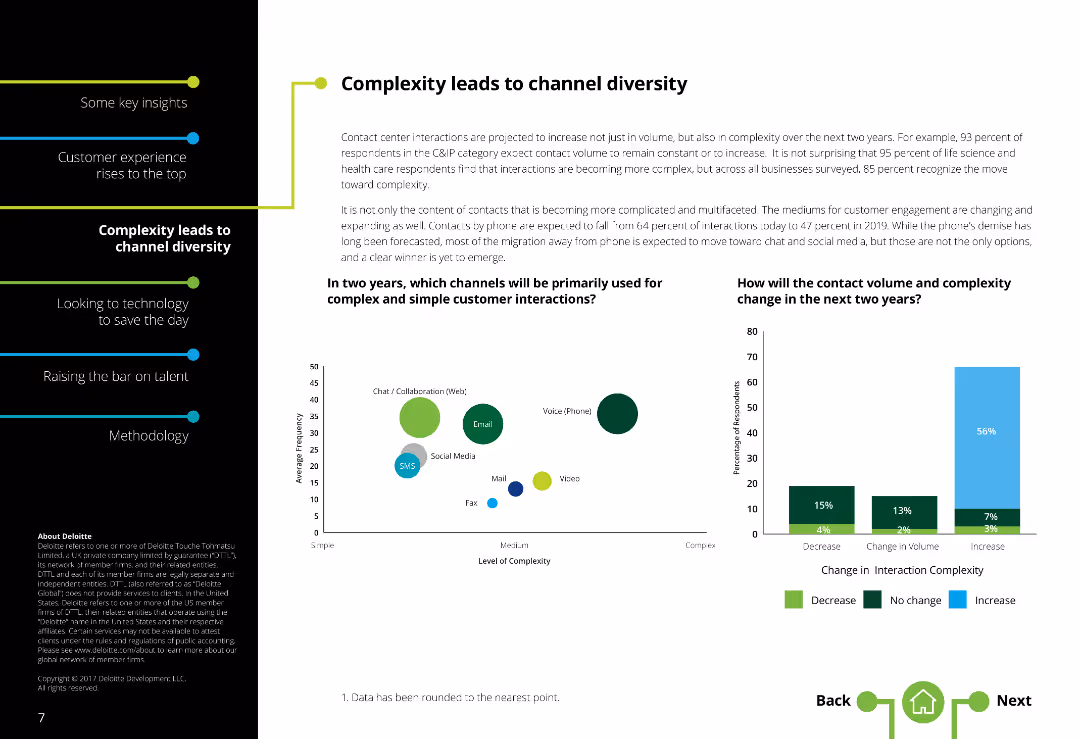
The slide features a two-column layout with text on the left and two column charts on the right. There is a moderate amount of text.
Market Analysis and Trends
Telecommunications
It addresses the increasing complexity in customer interactions and how contact channels are diversifying, with future projections for channel usage.
Channel diversity, Contact centers, Complexity, Communication channels, Customer interaction, Future projections
false
Market Analysis and Trends
Telecommunications telecommunications
Multiple Chart
Deloitte
View slide
Line chart showing the year-over-year growth of global personal luxury goods by channel from 2017 to 2023.
Strategic Planning
Consumer Goods
Examines the normalization of channel dynamics post-pandemic, focusing on retail, wholesale, and e-commerce.
Channel, Dynamics, Post-pandemic, Growth, Luxury
false
Strategic Planning
Consumer Goods consumer-goods
Mixed Chart
Kearney
View slide
A mixed chart showing the short- and long-term impacts of various marketing channels. The chart uses bars and lines to depict the effectiveness of channels like TV, social media, and print in driving sales and brand awareness.
Market Analysis and Trends
Media & Entertainment
This slide analyzes the effectiveness of different marketing channels in driving both short-term sales and long-term brand awareness. It highlights the impact of channels like TV, social media, and print on overall marketing effectiveness.
Channels, Impact, Marketing, Effectiveness, Sales
false
Market Analysis and Trends
Media & Entertainment media-and-entertainment
Mixed Chart
Nielsen
View slide
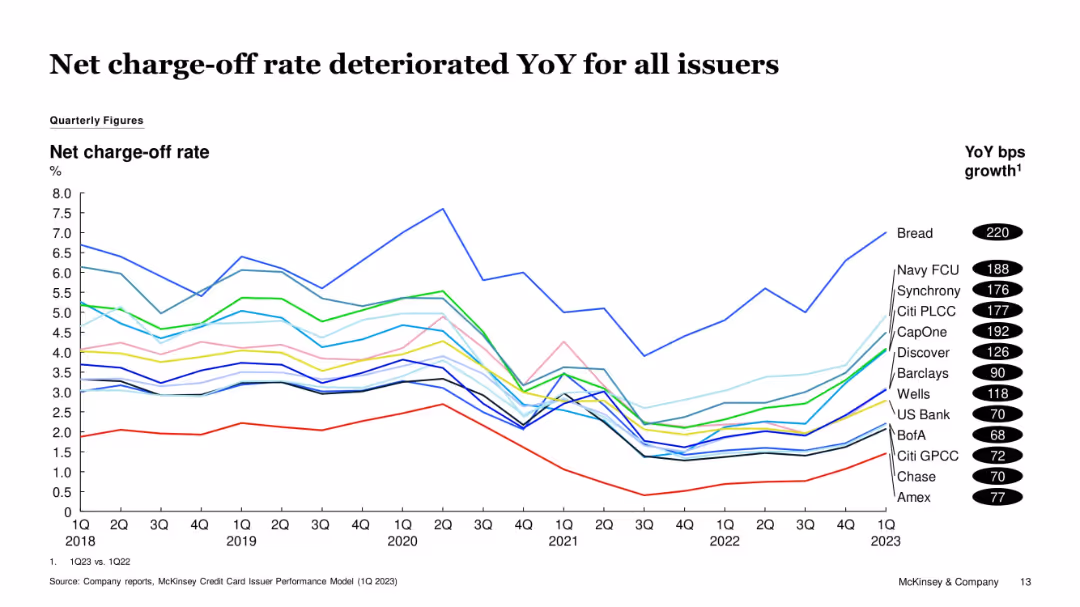
Multi-line chart displaying issuer-specific net charge-off rates from 1Q18 to 1Q23. YoY basis point growth values are shown in black ovals.
Risk Assessment and Management
Financial Services
The chart highlights a broad-based increase in credit card net charge-off rates YoY across issuers. Bread, Navy FCU, and CapOne experienced the most deterioration, suggesting growing borrower distress or looser underwriting.
Charge-offs, Credit Risk, YoY Growth, CapOne, Bread, Navy FCU, Credit Losses
false
Risk Assessment and Management
Financial Services financial-services
Single Chart
McKinsey
View slide
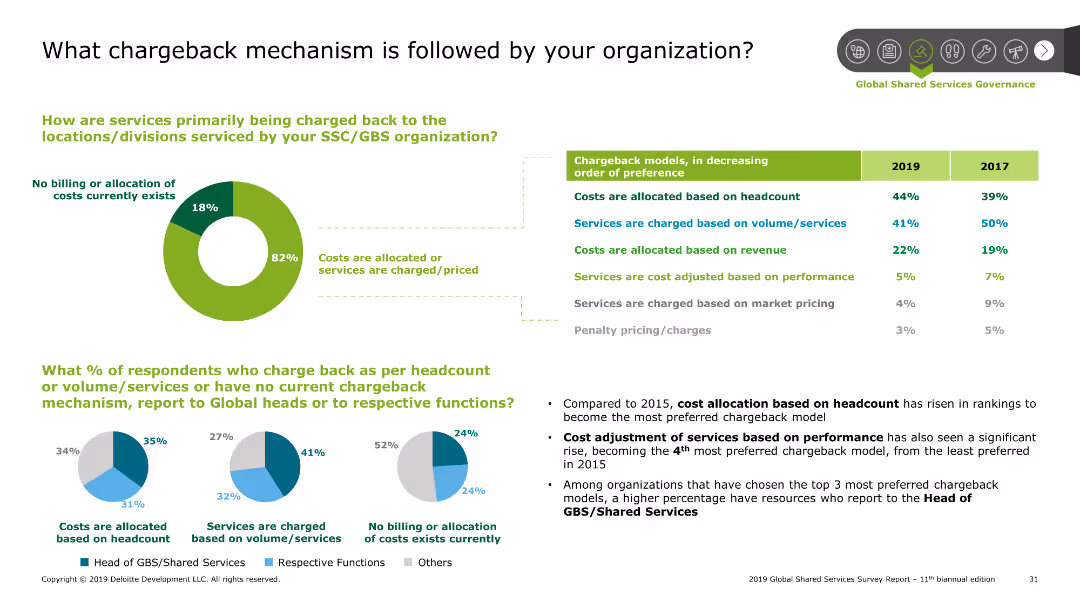
The slide includes pie charts and a table. The pie charts show chargeback methods and reporting structures. The table ranks chargeback models by preference.
Financial Performance
Professional Services
This slide analyzes the chargeback mechanisms used in organizations, with a comparison between 2017 and 2019 preferences. It also shows how costs are charged back to divisions.
Chargeback, cost allocation, financial performance, reporting
false
Financial Performance
Professional Services professional-services
Multiple Chart
Deloitte
View slide
A column chart showing the percentage of respondents in various countries who see the lack of charging stations as a primary concern for not considering EVs.
Market Analysis and Trends
Transportation & Logistics
This slide demonstrates the global concern over inadequate charging infrastructure, affecting consumer decisions against purchasing electric vehicles.
Charging stations, EV adoption, infrastructure, consumer concerns, global comparison
false
Market Analysis and Trends
Transportation & Logistics transportation-and-logistics
Single Chart
EY
View slide
Shows an iPhone screen displaying the Chase Offers℠ app interface and a circular diagram explaining the engagement cycle with four numbered points. The design is simple with a focus on the app and the cycle.
Client Case Studies
Financial Services
Discusses the success of the Chase Offers℠ program in its initial months, focusing on customer and merchant engagement and the benefits realized through this strategy.
Chase Offers, customer engagement, marketing strategy, merchant benefits, early success
false
Client Case Studies
Financial Services financial-services
Linear Flow
JP Morgan
View slide
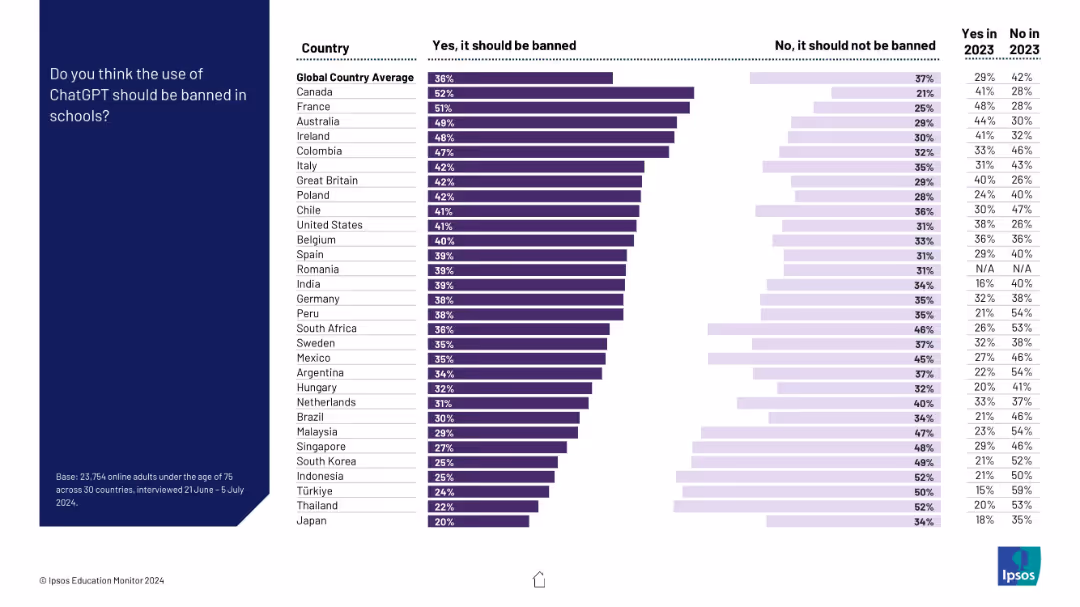
Vertical bar chart by country showing % support for banning ChatGPT in schools; ranked from most to least support
Regulatory and Compliance
Education & Training
The slide ranks countries by their support for banning ChatGPT in schools. Canada, France, and Australia top the list, while Japan and Thailand show the least support. Historical comparison with 2023 is also provided.
ChatGPT, AI in education, bans, country comparison, policy, 2024 vs 2023
false
Regulatory and Compliance
Education & Training education-and-training
Mixed Chart
IPSOS
View slide
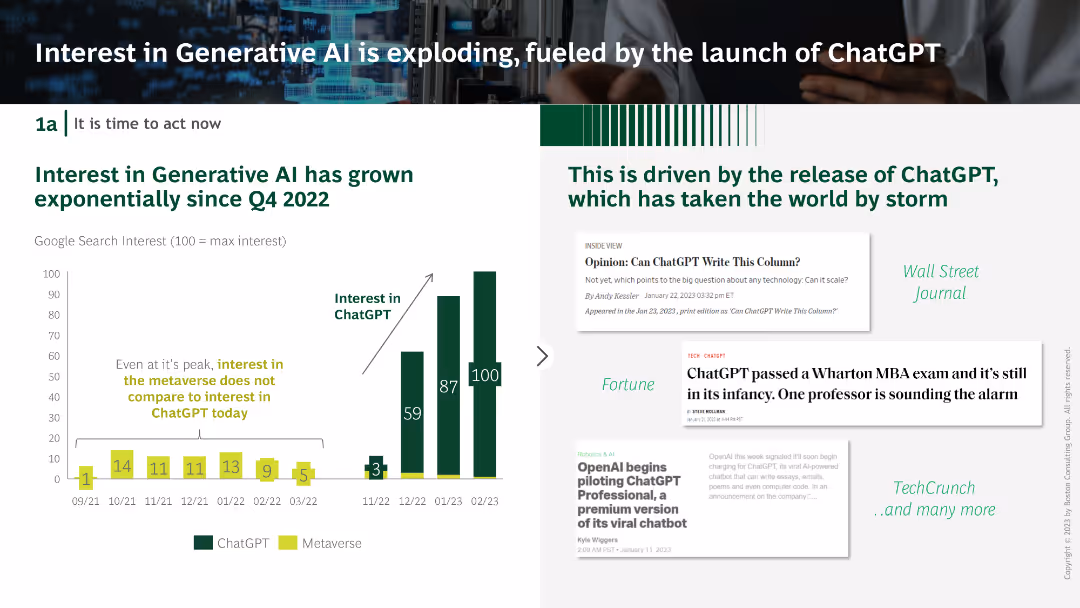
Column chart showing exponential growth in interest for ChatGPT since Q4 2022. Accompanied by quotes from various publications highlighting its impact.
Market Analysis and Trends
Technology & Software
The slide presents the rapid growth in interest for ChatGPT, driven by its launch, and includes media excerpts to emphasize its widespread influence.
ChatGPT, Generative AI, Interest growth, Market trends, Media impact
false
Market Analysis and Trends
Technology & Software technology-and-software
Mixed Chart
BCG
View slide
The slide features text, percentage data, and column charts showing the development of ChatGPT policies and discussions on generative AI risks at the executive level.
Regulatory and Compliance
Technology & Software
This slide discusses the development of acceptable use policies for ChatGPT and the board-level discussions on generative AI risks, including percentages of organizations with policies in place.
ChatGPT, Policies, IT Leaders, Generative AI, Risk Management
false
Regulatory and Compliance
Technology & Software technology-and-software
Multiple Chart
Gartner
View slide
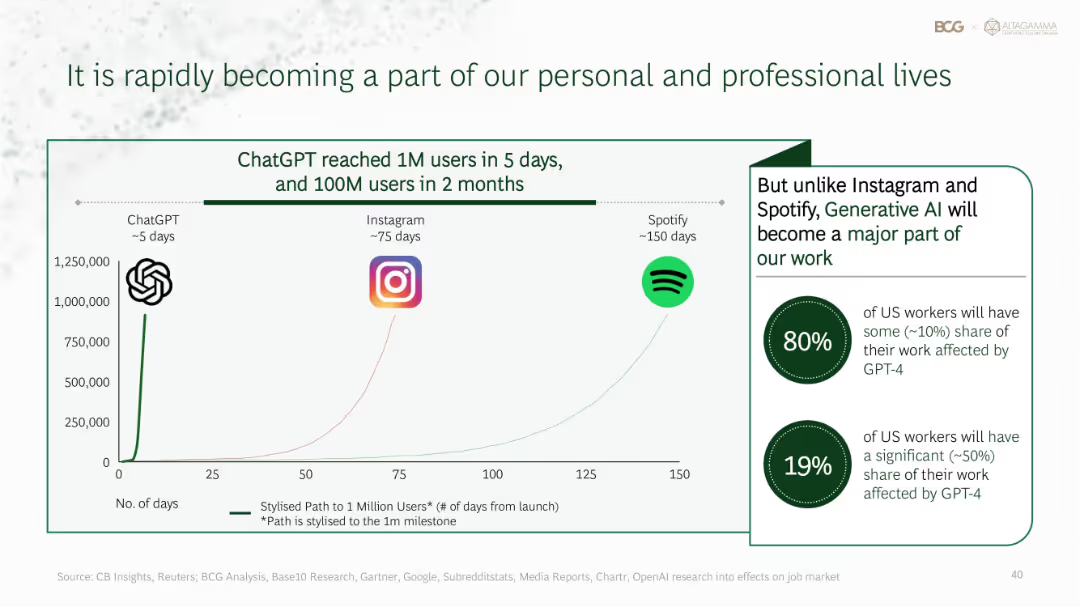
Graph comparing user growth of ChatGPT vs Instagram and Spotify; text block on generative AI's workplace impact
Technology and Digital Transformation
Artificial Intelligence
ChatGPT reached 1M users in 5 days and 100M in 2 months, outpacing Instagram and Spotify. Generative AI is expected to impact 80% of US workers, with 19% experiencing major transformation. The slide emphasizes GenAI’s integration into professional workflows.
ChatGPT, user growth, AI adoption, generative AI, workplace impact, digital transformation
false
Technology and Digital Transformation
Artificial Intelligence artificial-intelligence
Mixed Chart
BCG
View slide
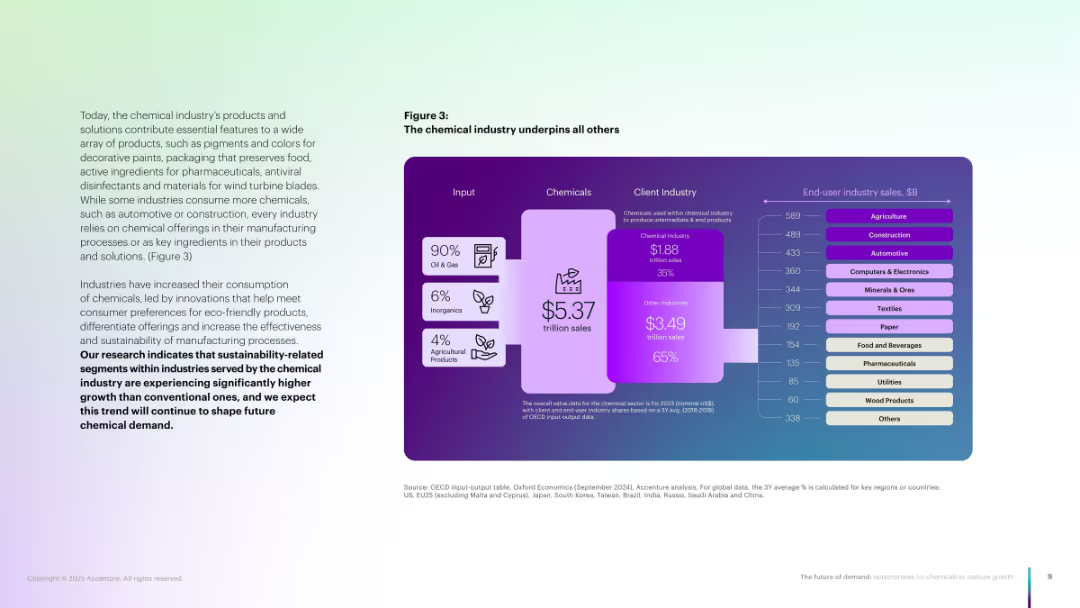
Sankey-style diagram showing input (Oil, Agri), chemical industry size, and downstream sectors.
Industry Overview
Industrial & Manufacturing
Demonstrates how the chemical industry supports multiple client sectors, highlighting its $5.37 trillion value chain. Shows inputs, economic value, and end-user industry sales, emphasizing sustainability-linked demand.
Chemical industry, value chain, sustainability, end-user industries
false
Industry Overview
Industrial & Manufacturing industrial-and-manufacturing
Mixed Chart
Accenture
Previous
Loading...
Hold On!
We are searching in our database
If nothing, comes up, please try different filters!
Column Chart
Heatmap
Chevron
Org Chart
Infographic
Callouts
Timeline
List
Graphic
Picture
Process Flow
Diagram
Paragraph
Map
Table
Framework
Subtitle
Takeaway Box
Icon
Other Chart
Radar Chart
Waterfall Chart
Mekko Chart
Pie Chart
Scatter Plot
Line Chart
Bar chart
Bullet points
Create a FREE account to continue browsing
Receive Instant Access to 1,000+ slides from companies like McKinsey, Google, and Goldman Sachs
First Name
Last Name
Email
Password
I agree to all
Terms & Privacy Policy
Thank you! Your submission has been received!
Oops! Something went wrong while submitting the form.
Have an account?
Sign in
Upgrade to PRO to Save slides
Advanced Search and Filters
Access to 15,000+ slides
Access to Category Pages
Save/Bookmark Slides
PowerPoint Template Library
Pick a Plan
MONTHLY
$12/month
Billed every month, Cancel anytime.
YEARLY
$9/year
Billed $108 annually, Cancel anytime.
Checkout for $12/month
Checkout for $108/yr
Secured by Stripe | AES-256 bit encryption