My Account
My Slides
Search by Category
Templates
View All Templates
Download Template Slides
Leave Feedback
Login
Logout
Get Started
Browse all Slides
Browse all Slides
Create a FREE Account
Instant access to 1,000+ real slides from top companies like McKinsey, BCG, Goldman Sachs, Google and many more!
First Name
Last Name
Email
Password
I agree to all
Terms & Privacy Policy
Thank you! Your submission has been received!
Oops! Something went wrong while submitting the form.
Have an account?
Sign in
Spark Your Next Big Idea with New Presentation Templates
VIEW ALL Templates
Welcome,
Welcome
PRO
Show Featured Only
Checkbox 8
Companies
Mckinsey
Bain
BCG
EY
Deloitte
Accenture
PwC/Strategy&
JP Morgan
Goldman Sachs
Morgan Stanley
Citigroup
Deutsche Bank
Barclays
LEK
KPMG
Kearney
Oliver Wyman
Booz Allen Hamilton
Gartner
IPSOS
Nielsen
Slide type
Text Only
Linear Flow
Vertical Flow
Single Chart
Header Horizontal
Mixed Chart
Header Vertical
Pillar
Multiple Chart
Graphic
Agenda
Title
Table
Framework
Industry
Technology & Software
Artificial Intelligence
Financial Services
Retail & E-commerce
Consumer Goods
Industrial & Manufacturing
Transportation & Logistics
Telecommunications
Real Estate & Construction
Hospitality & Tourism
Professional Services
Education & Training
Media & Entertainment
Agriculture & Food Production
Healthcare & Pharmaceuticals
Environmental Services & Sustainability
Government & Public Sector
Use Case
Mergers and Acquisitions
Performance Metrics and KPIs
Client Case Studies
Competitive Landscape
Corporate Finance and Valuation
Product and Service Analysis
Customer and Market Segmentation
Organizational Structure and Change
Industry Overview
Regulatory and Compliance
Risk Assessment and Management
Investment Analysis
Organizational Structure and Change
Human Resources and Talent Management
Financial Performance
Market Analysis and Trends
Sales and Business Development
Human Resources and Talent Management
Clear all
Thank you! Your submission has been received!
Oops! Something went wrong while submitting the form.
Tag
View slide
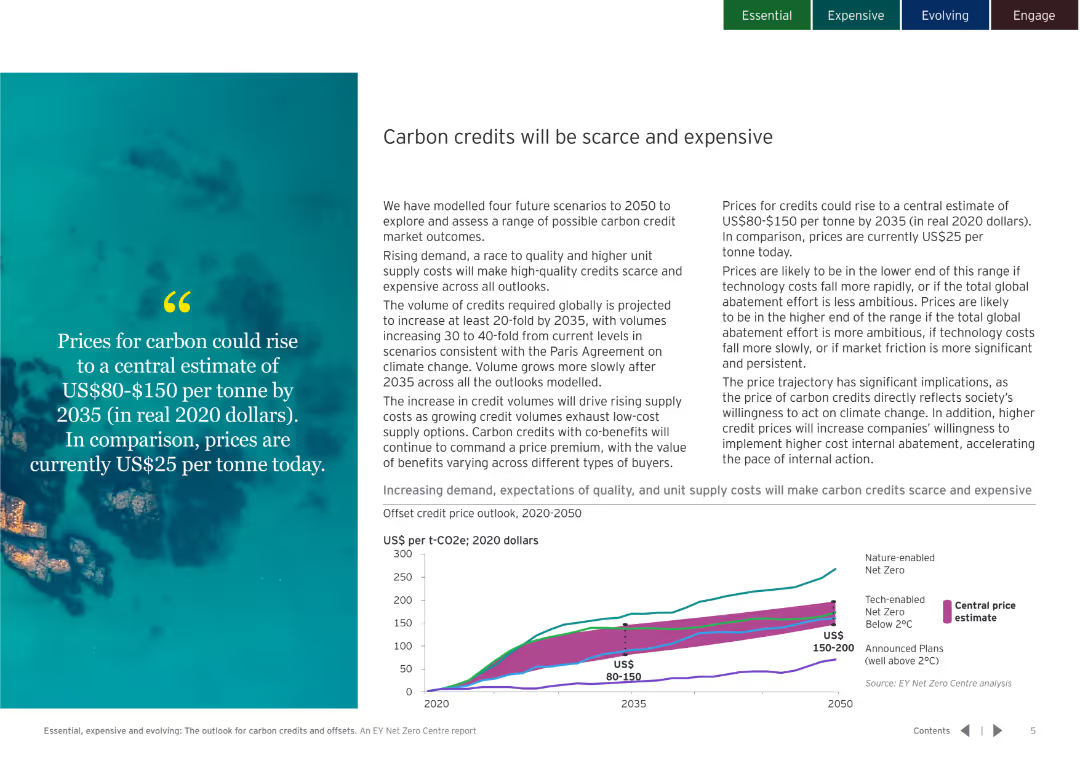
The slide combines text with an image and a line chart. The line chart shows projected carbon credit prices from 2020 to 2050 under different scenarios.
Strategic Planning
Environmental Services & Sustainability
It discusses the rising demand and costs for carbon credits by 2035, projecting prices to be between US$80-$150 per tonne. Emphasizes the importance of high-quality credits.
Carbon, credit, price, forecast, demand, 2035, scenario, cost, sustainability
false
Strategic Planning
Environmental Services & Sustainability environmental-services-and-sustainability
Mixed Chart
EY
View slide
This slide includes a collection of bar graphs, column charts, and key metric callouts arranged in a clean layout, with contrasting colors to highlight different data sets.
Financial Performance
Financial Services
Focused on the card franchise's industry leadership, the slide provides data on card sales, active accounts, and customer retention. Key figures show growth in sales volume and a sustained number 1 position in card outstandings.
Card Franchise, Industry Leadership, Sales Volume, Customer Retention, Financial Data
false
Financial Performance
Financial Services financial-services
Multiple Chart
JP Morgan
View slide
Features a split layout with half dedicated to card highlights including photos and logos, and the other half displaying line graphs comparing market performance. The design is sleek with a corporate color scheme.
Product and Service Analysis
Financial Services
Showcasing ongoing efforts to innovate in card products, the slide highlights new launches and market performance data. It notes the success in sales share and outstandings share, suggesting strong market engagement and strategic partnerships.
Card Products, Market Performance, Product Launch, Strategic Partnerships, Engagement
false
Product and Service Analysis
Financial Services financial-services
Multiple Chart
JP Morgan
View slide
A combination of cycle diagrams and column charts, this slide showcases financial growth metrics, such as sales volume and net revenue. It's visually balanced with clear demarcations between different sections and graphical elements.
Financial Performance
Financial Services
The slide describes the growth strategy and financial performance of a card franchise, with a focus on scaling, engaging, and deepening customer relationships. It’s intended for illustrating successful financial strategies and growth patterns within the industry.
Card franchise, Industry position, Sales volume, Net revenue, Financial growth, Strategy implementation
false
Financial Performance
Financial Services financial-services
Multiple Chart
JP Morgan
View slide
Displays a column chart showing growth in card revenue driven by lending, with a list of innovative strategies and products to the right.
Financial Performance
Financial Services
Illustrates the trend in card revenue growth at JPMorgan Chase, emphasizing innovation and customer borrowing needs.
Card revenue, lending, innovation, JPMorgan Chase, borrowing needs
false
Financial Performance
Financial Services financial-services
Mixed Chart
JP Morgan
View slide
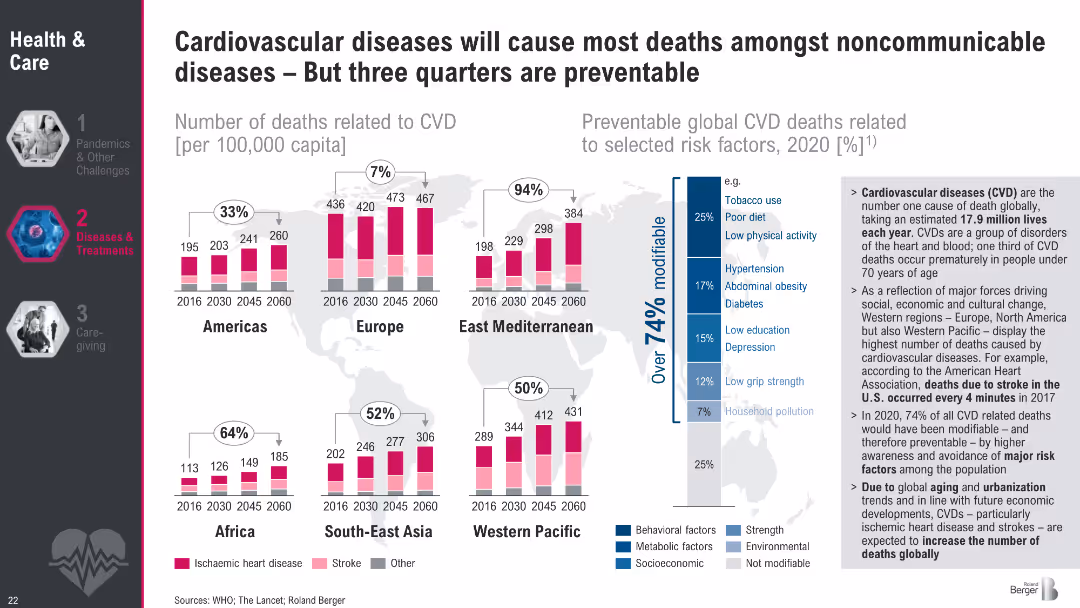
Regional bar charts showing trends in CVD mortality (2016–2060) with a stacked breakdown (ischemic, stroke, other). Sidebar includes a risk factor analysis.
Risk Assessment and Management
Healthcare & Pharmaceuticals
This slide presents CVD mortality trends across six global regions, identifying ischemic heart disease and stroke as leading causes. It emphasizes that over 74% of CVD deaths are preventable through modifiable risk factors like tobacco use, poor diet, and hypertension. The sidebar underlines the urgency of prevention and regional disparities in outcomes.
Cardiovascular disease, stroke, ischemic, mortality, preventable, risk factors, global health
false
Risk Assessment and Management
Healthcare & Pharmaceuticals healthcare-and-pharmaceuticals
Multiple Chart
Roland Berger
View slide
Displays rankings of proprietary card products, key partners logos, and column charts detailing purchase sales and EOP loans growth. Dominant colors are blue and grey.
Sales and Business Development
Financial Services
Discusses the leading positions of card products, showcases strategic partnerships, and presents growth data for purchase sales and EOP loans.
Cards, Partnerships, Growth, Rankings, No Fee, Cash Back, Retail Services
false
Sales and Business Development
Financial Services financial-services
Multiple Chart
Citigroup
View slide
The slide includes text explanations and a column chart showing areas where Gen Zs and Millennials feel they can influence their organization. The layout is balanced with text on the left and charts on the right.
Human Resources and Talent Management
Education & Training
The slide highlights the importance of values in career decisions for Gen Zs and Millennials, detailing areas where they feel empowered to influence organizational changes, including social issues, DEI, personal development, and sustainability efforts.
Career decisions, values, empowerment, Gen Z, Millennials, change
false
Human Resources and Talent Management
Education & Training education-and-training
Mixed Chart
Deloitte
View slide
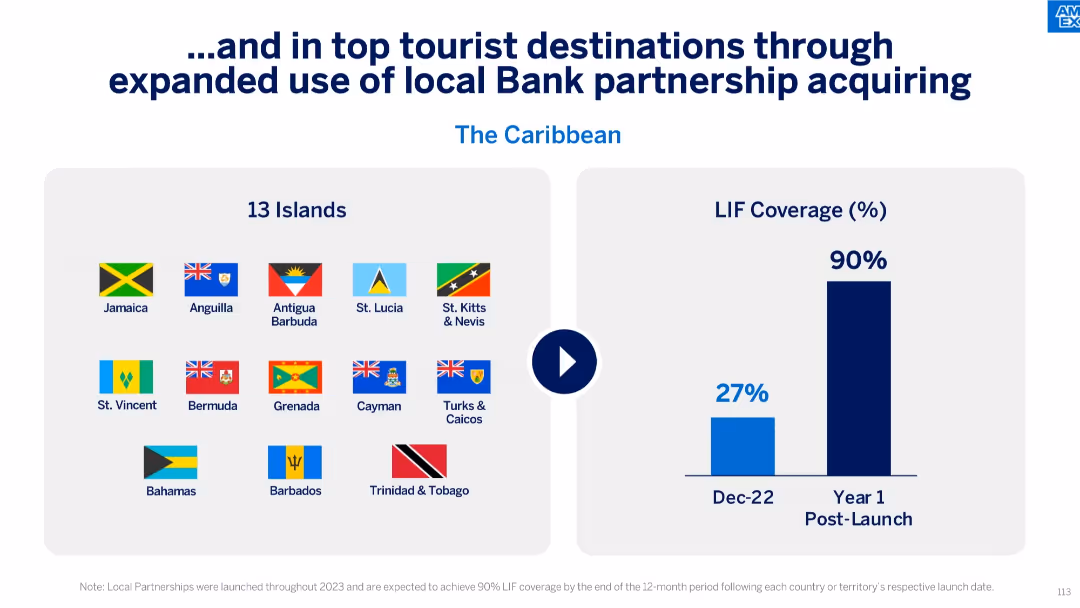
Split slide with country flags (left) and bar graph (right); left highlights 13 Caribbean islands, right shows LIF coverage growth.
Strategic Planning
Financial Services
This slide presents how expanded bank partnerships in the Caribbean are boosting LIF coverage. It emphasizes the growth from 27% coverage in Dec 2022 to a projected 90% within a year, covering 13 tourist-heavy islands.
Caribbean, bank partnerships, LIF growth, tourist destinations, Amex, merchant acquiring, coverage expansion, bar chart
false
Strategic Planning
Financial Services financial-services
Mixed Chart
McKinsey
View slide
The slide is divided into two vertical sections with headers in dark blue. Each section has a thematic icon and contains text blocks describing company case studies. Page number is at the bottom right.
Client Case Studies
Financial Services
This slide presents two case studies related to sustainable finance: one focusing on clean energy through a partnership with BlocPower, and the other on community empowerment with the National Urban League. The slide details the company's contributions and solutions, such as providing equity and debt financing, and is suitable for demonstrating the impact and scope of the presenter's sustainable finance initiatives in real-world applications.
Case Studies, Clean Energy, Community, Finance, Equity, Debt, Empowerment, Sustainability
false
Client Case Studies
Financial Services financial-services
Table
Goldman Sachs
View slide
Features logos of Athena, Chase.com, and ServiceNow with bullet points outlining improvements and efficiencies gained in each case. It highlights specific achievements such as cost reductions, enhanced customer support, and platform optimizations.
Technology and Digital Transformation
Technology & Software
Showcases technology-driven operational enhancements and cost efficiency improvements through three distinct case studies.
Case Study, Digital Strategy, Capacity, Performance, Cost Savings, Technology Platforms, Financial Services, Cloud-Native, Automation
false
Technology and Digital Transformation
Technology & Software technology-and-software
Pillar
JP Morgan
View slide
A dark-themed slide split into two halves, one detailing businesses involved, the other outlining solutions provided by the firm, complemented by a client testimonial.
Mergers and Acquisitions
Financial Services
A case study slide showcasing how the firm’s integrated solutions across various departments contributed to a client's success story.
Case Study, Solutions, Wealth, Investment, Asset, Management, Client, Testimonial
false
Mergers and Acquisitions
Financial Services financial-services
Table
Goldman Sachs
View slide
Logos and brief case studies of companies using AR in operations, including icons representing each industry.
Technology and Digital Transformation
Technology & Software
Highlights companies in different sectors that have leveraged AR for improvements in sales, training, manufacturing efficiency, and operational time.
Case studies, AR, sales, training, efficiency, innovation
false
Technology and Digital Transformation
Technology & Software technology-and-software
Header Vertical
McKinsey
View slide
Case studies of companies that have leveraged ML for significant operational improvements, with stats on impacts.
Technology and Digital Transformation
Technology & Software
Profiles the transformative impact of ML in three different companies, showing improvements in efficiency and operations.
Case study, ML, impact, efficiency, operational improvements
false
Technology and Digital Transformation
Technology & Software technology-and-software
Linear Flow
McKinsey
View slide
The slide shows a column chart displaying the growth in Global Alternatives AUM with predictions up to 2027, complemented by bullet points discussing industry dynamics on the side. The color blue is used to represent data points effectively against the dark background.
Client Case Studies
Financial Services
Highlights a case study on the collaboration between global banking and market sectors to show growth opportunities, suitable for illustrating market expansion and client base growth.
Case study, banking, market growth
false
Client Case Studies
Financial Services financial-services
Mixed Chart
Goldman Sachs
View slide
The slide contains a mix of text, pie charts, and infographics. The layout is structured into sections including an analysis of business cases, development sources, and risks.
Strategic Planning
Government & Public Sector
This slide presents a case study for Indonesia’s planned new capital, using a five-case model to analyze its strategic, financial, commercial, economic, and management cases.
Case study, green city, inclusive, smart, capital, strategic planning, Indonesia, development, financial, risks
false
Strategic Planning
Government & Public Sector government-and-public-sector
Single Chart
BCG
View slide
Contains column charts comparing caseloads, with a focus on color contrasts between red, brown, and beige to highlight differences among locations.
Regulatory and Compliance
Government & Public Sector
Presents a comparative analysis of the caseloads in different court locations and the trend in the number of case finalizations.
Caseload, courts, family law, applications, finalizations, judicial system, comparative analysis, trend
false
Regulatory and Compliance
Government & Public Sector government-and-public-sector
Multiple Chart
PwC/Strategy&
View slide
An advanced slide featuring a column chart detailing the end-of-period notional value of cash flow hedges. The graph uses different shades to distinguish between floors, forward starting swaps, and existing swaps. Below the graph, a legend explains the colors used, and text boxes provide further information about swap protection and weighted average receive-fix rate. The design is simple and focuses on presenting the financial data clearly.
Risk Assessment and Management
Financial Services
The slide offers an overview of the company’s cash flow hedges strategy to protect net interest margin (NIM). It details the swap protection plans and their impact on financial stability, aiming to communicate to stakeholders the steps taken for risk mitigation in fluctuating interest rate environments.
Cash Flow Hedges, Net Interest Margin, Risk Mitigation, Financial Strategy, Swap Protection, Interest Rates, Financial Planning
false
Risk Assessment and Management
Financial Services financial-services
Single Chart
Morgan Stanley
View slide
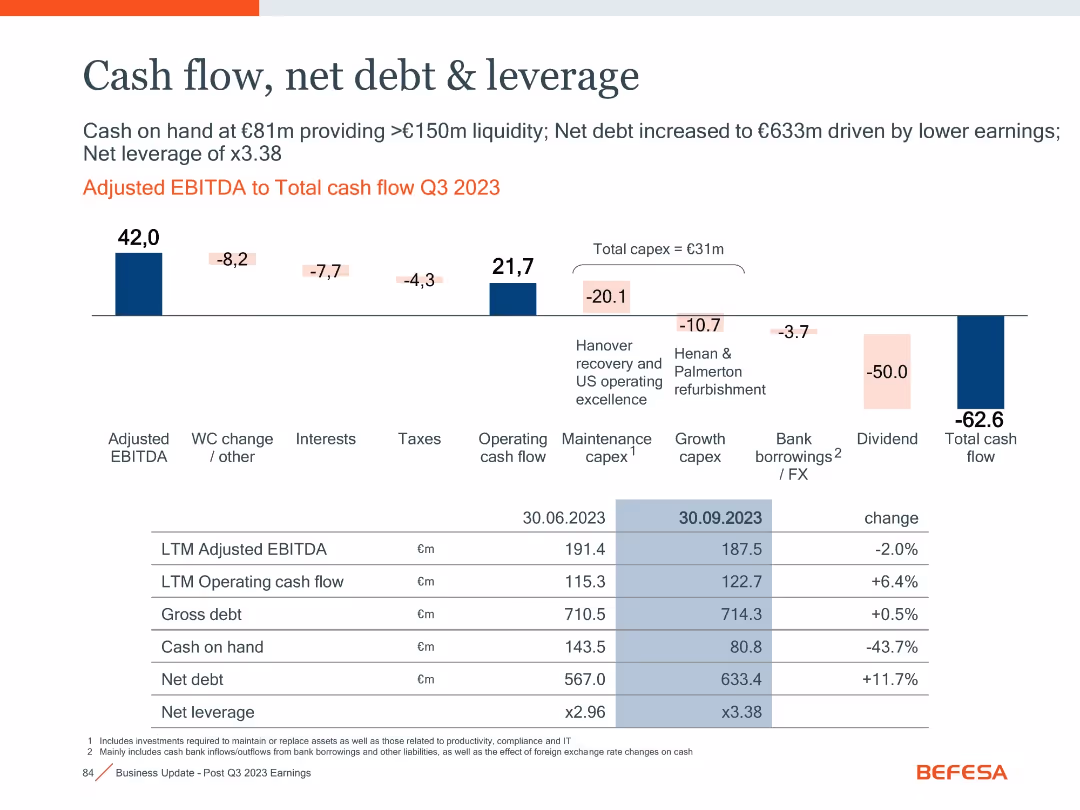
Horizontal waterfall chart and detailed financial metrics table
Financial Performance
Financial Services
The slide illustrates cash flow movement in Q3 2023, highlighting major components like capex, dividend payouts, and leverage metrics, with changes over time.
Cash Flow, Leverage, Net Debt, Capex, Dividend, EBITDA
false
Financial Performance
Financial Services financial-services
Mixed Chart
Goldman Sachs
View slide
The slide presents three interconnected 3D blocks in purple, highlighting key financial strategies: Dividend Growth, Share Repurchases, and Strong Cash Flow. Text overlays provide specific financial metrics and growth rates.
Financial Performance
Financial Services
Focuses on illustrating a company's financial strategy emphasizing dividend growth, share repurchases, and strong cash flow. Useful in analyzing financial health and strategic fiscal management.
Cash flow, Dividend, Share repurchases, CAGR, FCF
false
Financial Performance
Financial Services financial-services
Framework
Accenture
View slide
Column chart depicting cash flow improvement activities with bar lengths showing impact percentage, and pie charts indicating short-term and medium-term impact.
Financial Performance
Transportation & Logistics
This slide presents key cash flow improvement activities and their respective impacts on short and medium terms for medium cost control automotive manufacturing companies.
Cash flow, improvements, activities, short-term, medium-term, column chart, pie chart
false
Financial Performance
Transportation & Logistics transportation-and-logistics
Single Chart
EY
View slide
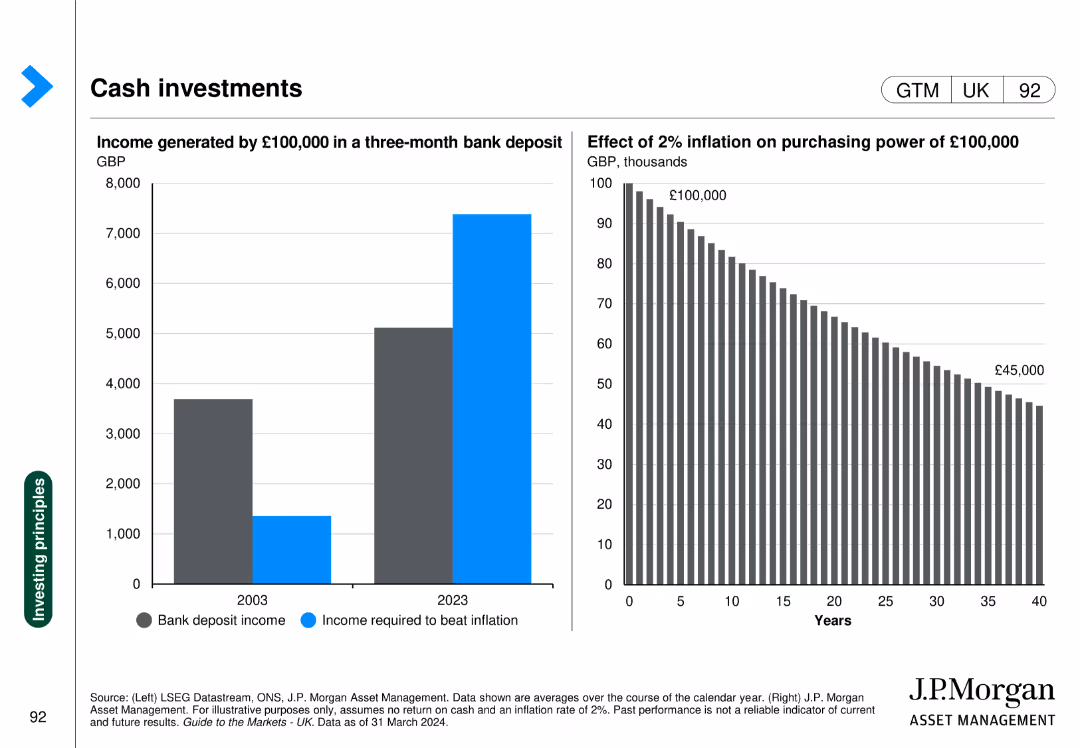
Two charts: one column chart showing income from bank deposits, another showing the impact of inflation on purchasing power.
Financial Performance
Financial Services
Highlights the change in income from bank deposits over time and the effect of inflation on money's value.
Cash investments, bank deposit, inflation, purchasing power, income
false
Financial Performance
Financial Services financial-services
Multiple Chart
JP Morgan
View slide
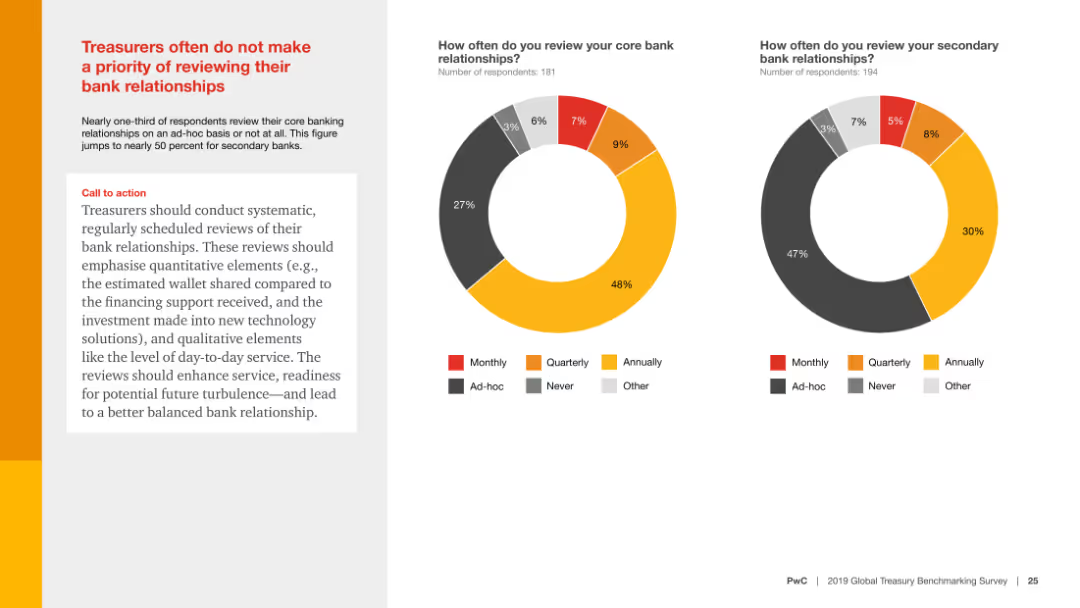
Contains a ring chart showing the percentage of cash visibility and text discussing optimization opportunities.
Financial Performance
Financial Services
Discusses the optimization opportunities for treasury cash management, highlighting the significance of visibility and the challenges in implementing connectivity solutions.
Cash management, optimization, visibility, treasury, connectivity
false
Financial Performance
Financial Services financial-services
Multiple Chart
PwC/Strategy&
View slide
This slide contains a column chart, representing different financial components, labeled from 1 to 5, in varying heights with different shades of blue. A key explains the elements as Cash & Cash Equivalents, Increase, and Decrease. Below the chart is an explanatory key with detailed notes.
Financial Performance
Financial Services
The slide is used for financial planning, depicting various stages such as current cash and equivalents, cash inflow from business operations, joint venture redemption, debt repayment, and expected funds for future investments. It's for presenting financial status and future funding strategies to stakeholders or investors.
Cash, EBITDA, Leverage, Investment, Growth, Finance, Redemption, Repayment, Liquidity, Planning
false
Financial Performance
Financial Services financial-services
Single Chart
Goldman Sachs
View slide
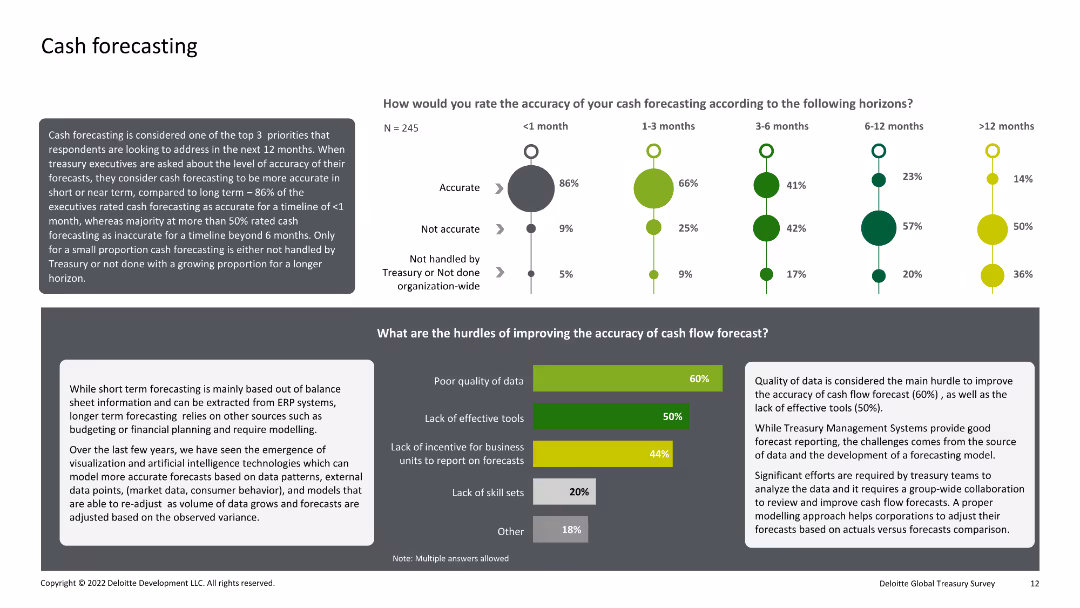
Combination of text, bar charts, and dot plots. The slide evaluates the accuracy of cash forecasting over different time horizons and identifies the main hurdles to improving forecasting accuracy.
Financial Performance
Financial Services
This slide analyzes the accuracy of cash forecasting within organizations over various time horizons and identifies key obstacles to improving this accuracy, such as poor data quality and lack of effective tools.
Cash, Forecasting, Accuracy, Hurdles, Improvement
false
Financial Performance
Financial Services financial-services
Multiple Chart
Deloitte
View slide
Features column charts detailing reserve releases and underlying reserve volatility for casualty insurance.
Risk Assessment and Management
Financial Services
Details the volatility in reserve releases for casualty at Lloyd's, highlighting specific lines such as General Liability and Directors & Officers insurance, with a focus on significant reserve changes.
Casualty, Reserves, Insurance, Volatility, Changes
false
Risk Assessment and Management
Financial Services financial-services
Multiple Chart
PwC/Strategy&
View slide
Stacked bar chart (left) with annotations and labels; icons and bullet list (right); gradient tones in therapy bars
Product and Service Analysis
Healthcare & Pharmaceuticals
This slide focuses on the cell and gene therapy market, forecasting rapid growth through 2026. It highlights opportunities in personalized medicine, long-lasting treatments, and potential cures. The chart breaks down sales by therapy type and projects strong annual growth in this emerging healthcare segment.
Cell Therapy, Gene Therapy, Innovation, Personalized Medicine, Forecast
false
Product and Service Analysis
Healthcare & Pharmaceuticals healthcare-and-pharmaceuticals
Mixed Chart
Roland Berger
View slide
The slide shows a line chart comparing cement import volumes in Australia, the US, and France, with a table summarizing import penetration rates.
Market Analysis and Trends
Industrial & Manufacturing
Examines the differences in cement import reliance between Australia, the US, and France. Highlights import growth trends and provides context on market reliance and supply chain factors.
Cement imports, Australia, US, France, market analysis
false
Market Analysis and Trends
Industrial & Manufacturing industrial-and-manufacturing
Mixed Chart
LEK
View slide
Displays a column chart showing cement and clinker import sources for Australia, the US, and France, along with a table of top import countries.
Market Analysis and Trends
Industrial & Manufacturing
Analyzes the sources of cement and clinker imports for Australia, the US, and France. Provides insights into regional dependencies and major import partners.
Cement imports, clinker, US, France, Australia
false
Market Analysis and Trends
Industrial & Manufacturing industrial-and-manufacturing
Mixed Chart
LEK
View slide
The slide features a flow diagram illustrating the concrete manufacturing process from raw materials to the finished product. Each stage is accompanied by relevant images and descriptive text, with a clear visual hierarchy.
Industry Overview
Industrial & Manufacturing
Describes the process of cement production, highlighting the stages from limestone and clay to concrete. Explains the importance of clinker and the industry's move towards more sustainable practices.
Cement, clinker, concrete, manufacturing, sustainability
false
Industry Overview
Industrial & Manufacturing industrial-and-manufacturing
Linear Flow
LEK
Previous
Loading...
Hold On!
We are searching in our database
If nothing, comes up, please try different filters!
Column Chart
Heatmap
Chevron
Org Chart
Infographic
Callouts
Timeline
List
Graphic
Picture
Process Flow
Diagram
Paragraph
Map
Table
Framework
Subtitle
Takeaway Box
Icon
Other Chart
Radar Chart
Waterfall Chart
Mekko Chart
Pie Chart
Scatter Plot
Line Chart
Bar chart
Bullet points
Create a FREE account to continue browsing
Receive Instant Access to 1,000+ slides from companies like McKinsey, Google, and Goldman Sachs
First Name
Last Name
Email
Password
I agree to all
Terms & Privacy Policy
Thank you! Your submission has been received!
Oops! Something went wrong while submitting the form.
Have an account?
Sign in
Upgrade to PRO to Save slides
Advanced Search and Filters
Access to 15,000+ slides
Access to Category Pages
Save/Bookmark Slides
PowerPoint Template Library
Pick a Plan
MONTHLY
$12/month
Billed every month, Cancel anytime.
YEARLY
$9/year
Billed $108 annually, Cancel anytime.
Checkout for $12/month
Checkout for $108/yr
Secured by Stripe | AES-256 bit encryption