My Account
My Slides
Search by Category
Templates
View All Templates
Download Template Slides
Leave Feedback
Login
Logout
Get Started
Browse all Slides
Browse all Slides
Create a FREE Account
Instant access to 1,000+ real slides from top companies like McKinsey, BCG, Goldman Sachs, Google and many more!
First Name
Last Name
Email
Password
I agree to all
Terms & Privacy Policy
Thank you! Your submission has been received!
Oops! Something went wrong while submitting the form.
Have an account?
Sign in
Spark Your Next Big Idea with New Presentation Templates
VIEW ALL Templates
Welcome,
Welcome
PRO
Show Featured Only
Checkbox 8
Companies
Mckinsey
Bain
BCG
EY
Deloitte
Accenture
PwC/Strategy&
JP Morgan
Goldman Sachs
Morgan Stanley
Citigroup
Deutsche Bank
Barclays
LEK
KPMG
Kearney
Oliver Wyman
Booz Allen Hamilton
Gartner
IPSOS
Nielsen
Slide type
Text Only
Linear Flow
Vertical Flow
Single Chart
Header Horizontal
Mixed Chart
Header Vertical
Pillar
Multiple Chart
Graphic
Agenda
Title
Table
Framework
Industry
Technology & Software
Artificial Intelligence
Financial Services
Retail & E-commerce
Consumer Goods
Industrial & Manufacturing
Transportation & Logistics
Telecommunications
Real Estate & Construction
Hospitality & Tourism
Professional Services
Education & Training
Media & Entertainment
Agriculture & Food Production
Healthcare & Pharmaceuticals
Environmental Services & Sustainability
Government & Public Sector
Use Case
Mergers and Acquisitions
Performance Metrics and KPIs
Client Case Studies
Competitive Landscape
Corporate Finance and Valuation
Product and Service Analysis
Customer and Market Segmentation
Organizational Structure and Change
Industry Overview
Regulatory and Compliance
Risk Assessment and Management
Investment Analysis
Organizational Structure and Change
Human Resources and Talent Management
Financial Performance
Market Analysis and Trends
Sales and Business Development
Human Resources and Talent Management
Clear all
Thank you! Your submission has been received!
Oops! Something went wrong while submitting the form.
Tag
View slide
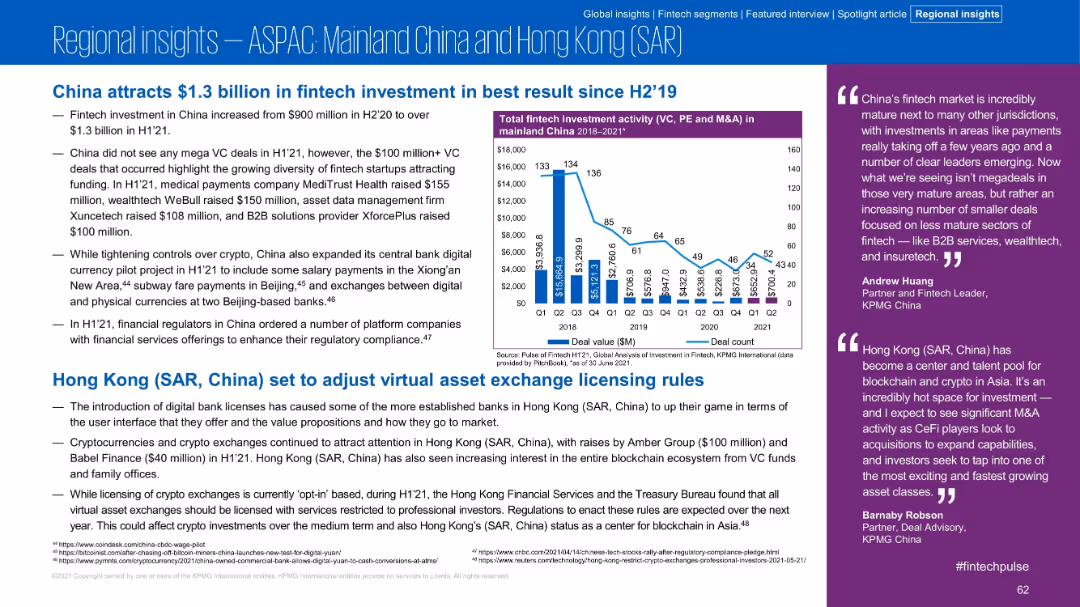
Text-based slide with one line chart, regional insights, and commentary from KPMG experts.
Market Analysis and Trends
Financial Services
Focused on Mainland China and Hong Kong, this slide outlines recent VC trends, strong fintech investment activity, and regulatory developments including crypto licensing. It emphasizes the absence of megadeals and the rise of smaller B2B plays.
China, Fintech, Investment, Licensing, Crypto, B2B, Regulations
false
Market Analysis and Trends
Financial Services financial-services
Mixed Chart
KPMG
View slide
Column charts depict China’s GDP growth rates across quarters for two years, highlighting expected growth due to policy changes.
Market Analysis and Trends
Transportation & Logistics
Analyzes the impact of China's economic policies and COVID-19 policy reversals on its GDP growth, with implications for global trade.
China, GDP growth, economic policy, COVID-19, global trade
false
Market Analysis and Trends
Transportation & Logistics transportation-and-logistics
Mixed Chart
Deutsche Bank
View slide
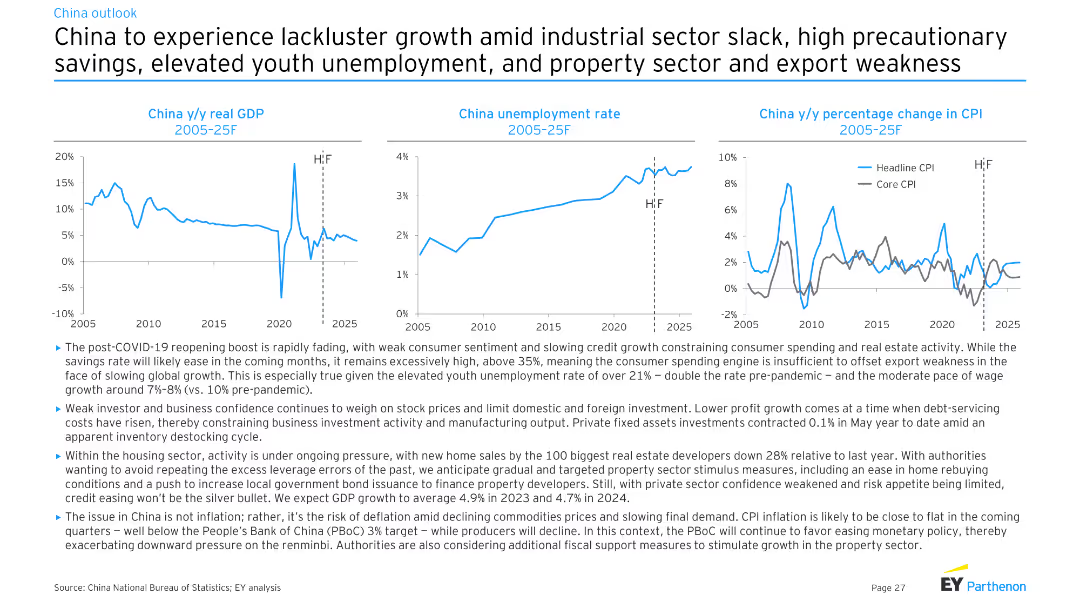
The slide includes three line charts showing China's y/y real GDP, unemployment rate, and y/y CPI from 2005 to 2025, with explanatory text.
Market Analysis and Trends
Financial Services
Analyzes China's economic challenges and prospects, including structural and cyclical factors affecting GDP, employment, and inflation.
China, GDP, Unemployment, CPI, Structural Headwinds
false
Market Analysis and Trends
Financial Services financial-services
Multiple Chart
EY
View slide
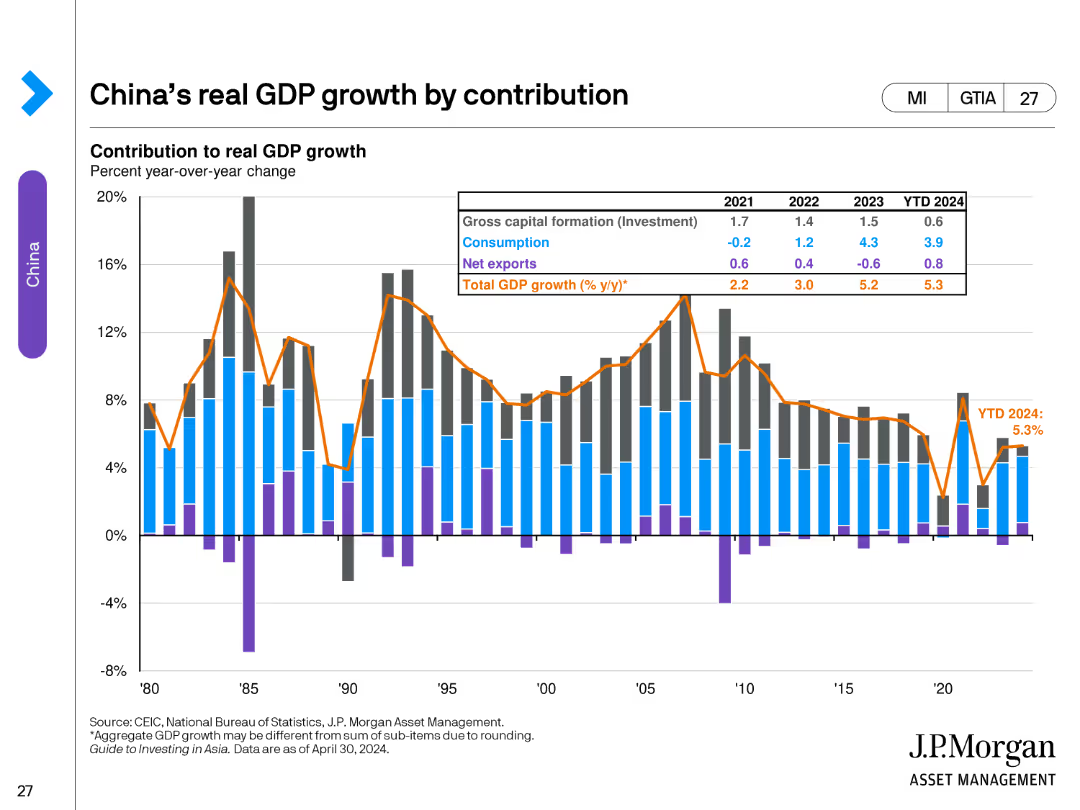
The slide contains a stacked bar chart showing the contribution to real GDP growth by gross capital formation, consumption, net exports, and total GDP growth from 1980 to 2024. A table summarizes year-over-year changes and projections for the near future.
Market Analysis and Trends
Financial Services
This slide analyzes the components of China's real GDP growth over several decades, highlighting the contributions of investment, consumption, and net exports. It provides a historical perspective and future projections of GDP growth rates.
China, GDP, growth, contribution, investment, consumption, net exports, projections, financial services, bar chart
false
Market Analysis and Trends
Financial Services financial-services
Single Chart
JP Morgan
View slide
Two column charts: one shows China's real GDP growth contributions by GDP growth and investment, and the other shows fixed asset investment by sector.
Market Analysis and Trends
Financial Services
This slide provides insights into the drivers of economic growth in China, highlighting contributions to GDP growth and sector-specific fixed asset investments. Used for market analysis and investment planning.
China, GDP, growth, investment, sectors
false
Market Analysis and Trends
Financial Services financial-services
Multiple Chart
JP Morgan
View slide
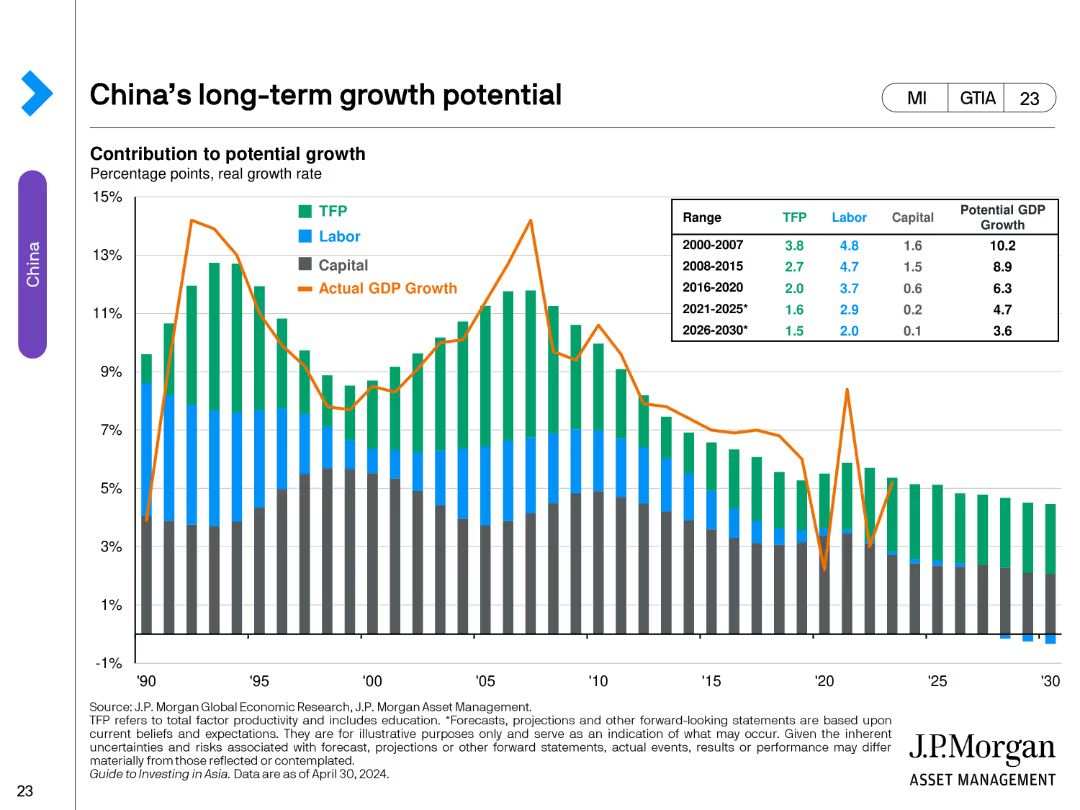
The slide contains a stacked bar chart showing the contribution to potential GDP growth in China from TFP, labor, and capital, alongside actual GDP growth from 1990 to 2030. The chart includes a table summarizing growth rates in various periods.
Market Analysis and Trends
Financial Services
This slide assesses China's long-term economic growth potential, breaking down contributions from total factor productivity (TFP), labor, and capital. It contrasts these with actual GDP growth over time, providing forecasts for future growth rates.
China, GDP, growth, potential, TFP, labor, capital, economic forecast, stacked bar chart, financial services
false
Market Analysis and Trends
Financial Services financial-services
Single Chart
JP Morgan
View slide
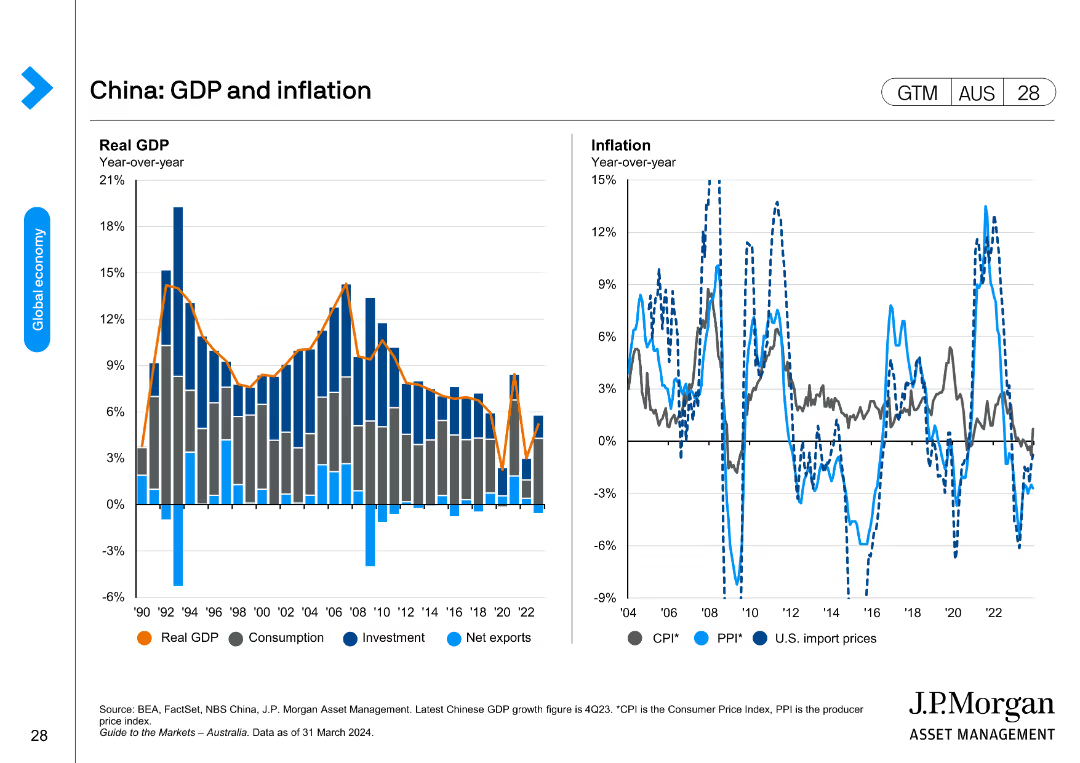
Two charts illustrating China's GDP growth by various components and inflation rates, comparing CPI, PPI, and U.S. import prices.
Market Analysis and Trends
Financial Services
The slide details China's economic performance, highlighting GDP growth and inflationary trends, with a focus on consumer and producer prices, and import dynamics.
China, GDP, inflation, CPI, PPI, import prices
false
Market Analysis and Trends
Financial Services financial-services
Multiple Chart
JP Morgan
View slide
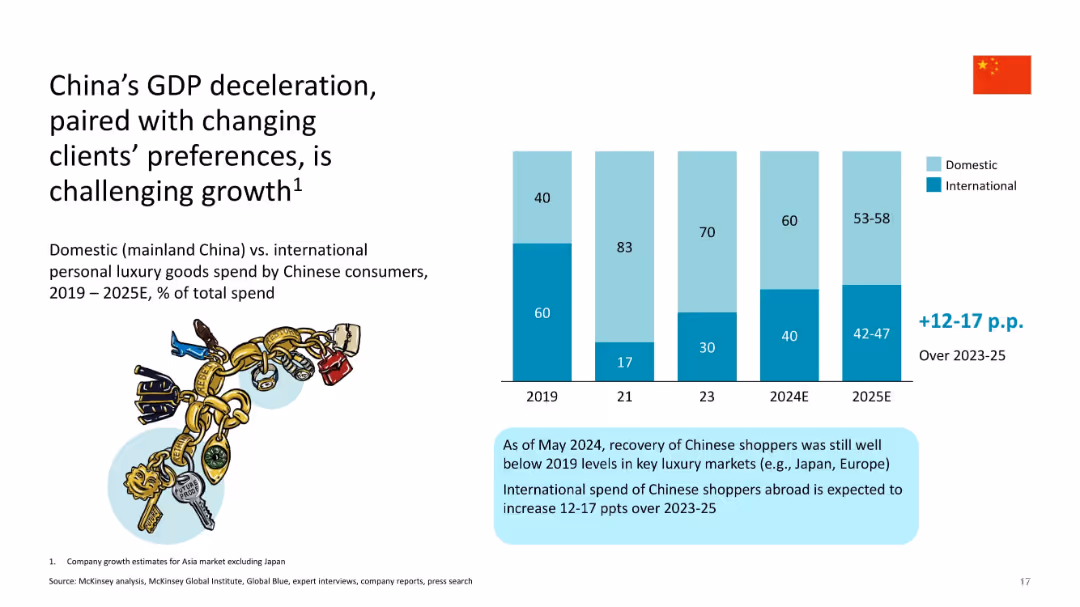
Split layout with text on left, bar chart on right; uses blue tones; Chinese flag and illustrated shopping bags
Market Analysis and Trends
Consumer Goods
Shows shift in Chinese consumer luxury spending from domestic to international markets due to GDP slowdown and evolving preferences; forecasts international spend increase of 12–17 percentage points from 2023–2025.
China, GDP, luxury spending, domestic vs international, consumer trends, 2025 forecast, preferences, growth challenge
false
Market Analysis and Trends
Consumer Goods consumer-goods
Mixed Chart
McKinsey
View slide
Three line charts illustrating China's y/y real GDP, unemployment rate, and y/y percentage change in CPI from 2005-25F. Moderate complexity, suitable for detailed economic analysis and forecasting.
Market Analysis and Trends
Financial Services
The slide forecasts China's economic growth, addressing challenges in the industrial sector, high savings rates, and export weakness. It discusses GDP trends, unemployment, and inflation projections, highlighting factors impacting growth.
China, GDP, unemployment, CPI, growth
false
Market Analysis and Trends
Financial Services financial-services
Multiple Chart
EY
View slide
A column chart comparing active weights of China/HK by category and domicile for US and non-US managers in different fund categories from Oct-22 to Jan-23.
Market Analysis and Trends
Financial Services
The slide analyzes the varying positions of China/HK in active weights across different managers and fund categories, highlighting significant differences.
China, HK, Fund Categories, Active Weights, Managers
false
Market Analysis and Trends
Financial Services financial-services
Multiple Chart
Morgan Stanley
View slide
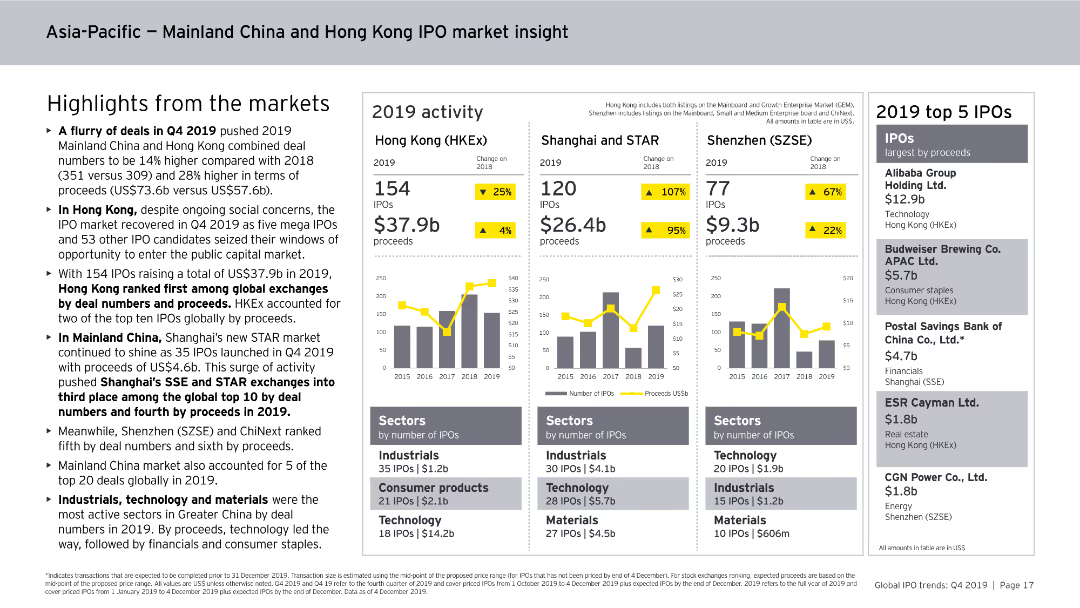
Includes column charts, data tables, and bullet points. The slide is visually detailed, focusing on IPO activities in Mainland China and Hong Kong for 2019.
Market Analysis and Trends
Financial Services
Provides insights into the IPO market activities in Mainland China and Hong Kong for 2019, highlighting major stock exchanges, sector performances, and the top IPOs by proceeds.
China, Hong Kong, IPO, market insight, 2019, trends
false
Market Analysis and Trends
Financial Services financial-services
Multiple Chart
EY
View slide
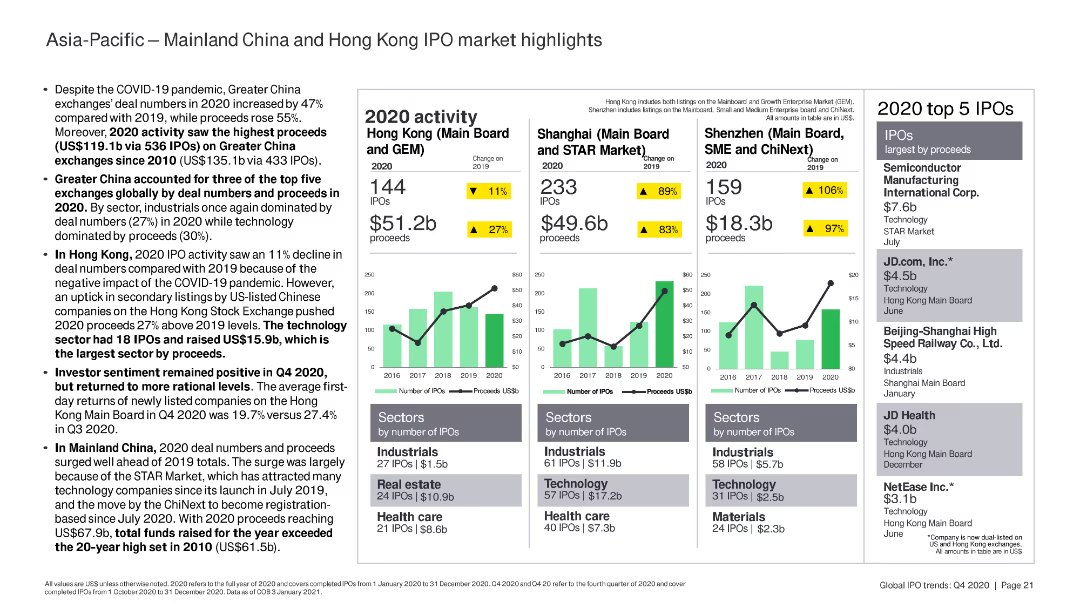
The slide features column charts and bar charts summarizing IPO activity in Mainland China and Hong Kong, highlighting key sectors and top IPOs by proceeds.
Market Analysis and Trends
Financial Services
The slide highlights IPO activity in Mainland China and Hong Kong in 2020, focusing on the performance of key stock exchanges, sectors, and top IPOs by proceeds.
China, Hong Kong, IPO, sectors, proceeds
false
Market Analysis and Trends
Financial Services financial-services
Multiple Chart
EY
View slide
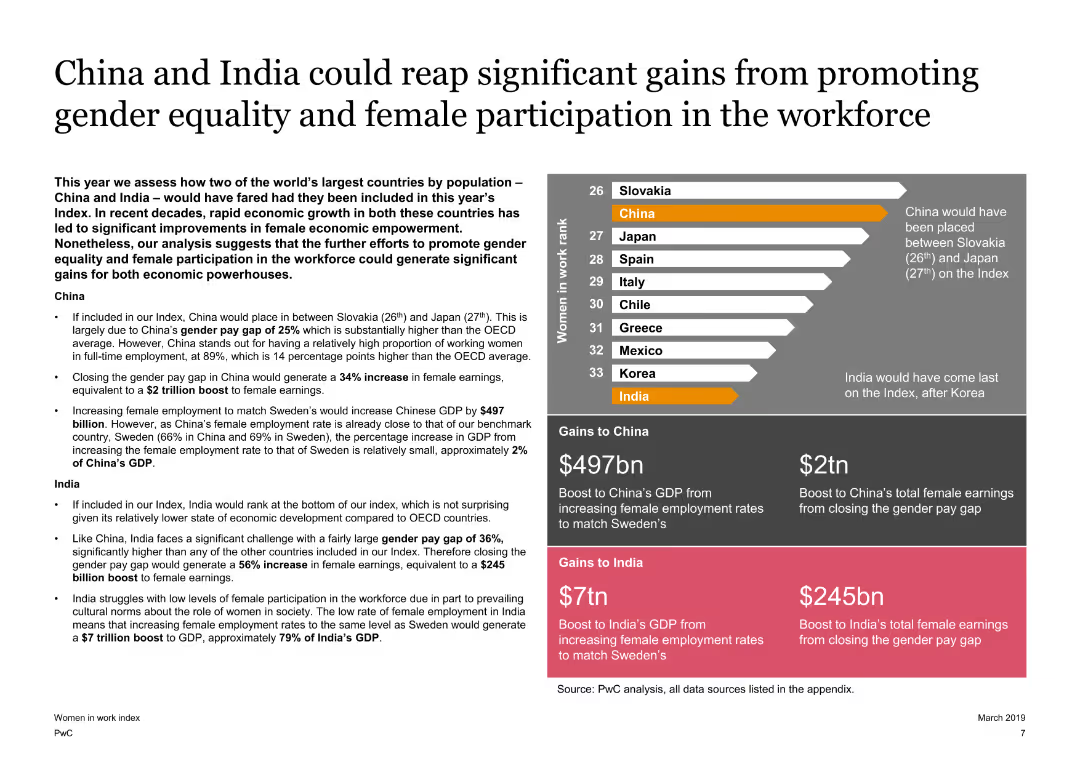
The slide presents a mix of text and a column chart comparing China and India’s potential gains from gender equality. It uses color coding to differentiate between the countries and their gains.
Market Analysis and Trends
Financial Services
It assesses the economic gains that China and India could achieve by promoting gender equality and increasing female workforce participation, highlighting potential GDP boosts.
China, India, Gender, Equality, Gains, Economy
false
Market Analysis and Trends
Financial Services financial-services
Mixed Chart
PwC/Strategy&
View slide
The slide shows line graphs comparing official and alternative measures of industrial production growth in China. The use of contrasting colors helps distinguish between the two data series.
Market Analysis and Trends
Industrial & Manufacturing
Provides an analysis of industrial production growth in China, contrasting official data with alternative sources. Useful for understanding the real economic situation in China and for investment or policy-making decisions.
China, Industrial Production, Economic Analysis, Growth, Data Sources
false
Market Analysis and Trends
Industrial & Manufacturing industrial-and-manufacturing
Single Chart
Deutsche Bank
View slide
The layout includes a bar graph labeled "FIGURE 5", textual analysis on the left, and quotes pertaining to the role of AI in skill development.
Market Analysis and Trends
Technology & Software
Focusing on China, the slide projects the future of work roles from 2017 to 2028, addressing the dominant employment sectors and the impact of automation on labor distribution.
China, Labor, Automation, Skills, Future
false
Market Analysis and Trends
Technology & Software technology-and-software
Mixed Chart
Accenture
View slide
Slide presents column charts and bullet points. The charts display luxury market projections for 2017 and 2025, emphasizing Chinese consumption. Red and gray colors differentiate data.
Market Analysis and Trends
Retail & E-commerce
This slide analyzes the future growth trends in the luxury goods market, focusing particularly on China's role. It highlights domestic versus international spending in the context of overall market growth.
China, Luxury Market, Growth, Consumption, Projections
false
Market Analysis and Trends
Retail & E-commerce retail-and-e-commerce
Multiple Chart
Bain
View slide
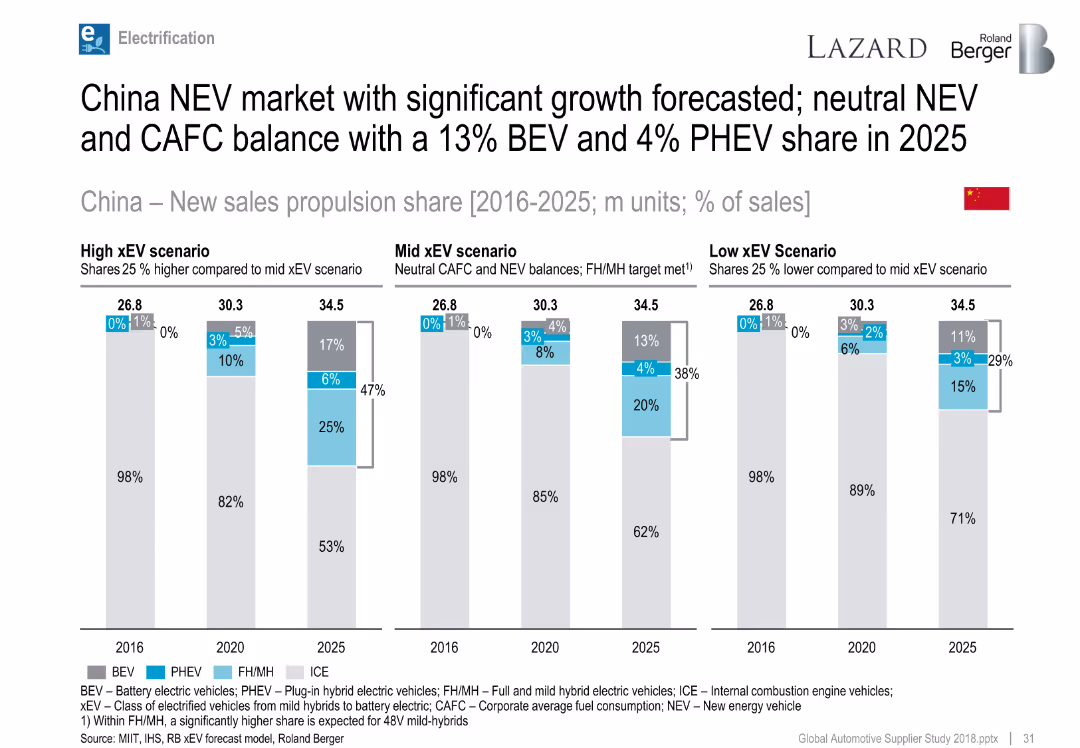
Bar charts for China propulsion share by year and scenario.
Market Analysis and Trends
Industrial & Manufacturing
Highlights strong forecasted growth for NEVs in China through 2025 under various xEV scenarios, with potential for up to 47% xEV share.
China, NEV, xEV scenarios, BEV, PHEV, electrification forecast
false
Market Analysis and Trends
Industrial & Manufacturing industrial-and-manufacturing
Single Chart
Roland Berger
View slide
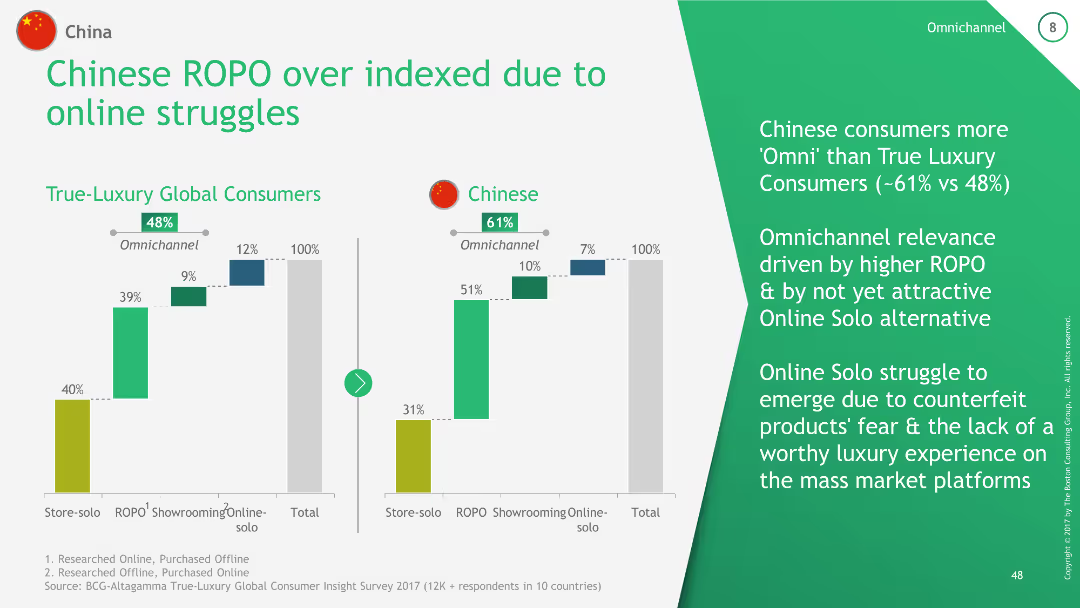
The slide includes a comparative column chart showing the ROPO (Research Online, Purchase Offline) index for True-Luxury Global Consumers and Chinese consumers. It compares the percentage of consumers engaging in omnichannel shopping versus online solo shopping.
Technology and Digital Transformation
Consumer Goods
This slide highlights the higher prevalence of ROPO behavior among Chinese consumers compared to global luxury consumers, indicating the challenges faced by online solo shopping due to counterfeit fears and lack of luxury experience on mass market platforms.
China, ROPO, omnichannel, luxury, online shopping
false
Technology and Digital Transformation
Consumer Goods consumer-goods
Multiple Chart
BCG
View slide
The slide uses a color scheme with gray and purple, featuring a centralized graphic representing China’s technology goals and four numbered segments with icons and brief descriptions around it. It contains moderate text and data visualizations like charts or graphs are not present.
Industry Overview
Technology & Software
This slide presents China's strategic focus in technology as outlined in their 14th Five-Year Plan, highlighting key imperatives to become a global digital powerhouse within the next five years. It breaks down the plan into four main objectives such as investment in digital infrastructure and enhancing education quality, aimed at fostering international collaboration and maintaining a policy of openness.
China, Technology, Five-Year Plan, Digital Powerhouse, Infrastructure, Education, Collaboration, Policy, Global Leader, Investment
false
Industry Overview
Technology & Software technology-and-software
Single Chart
Kearney
View slide
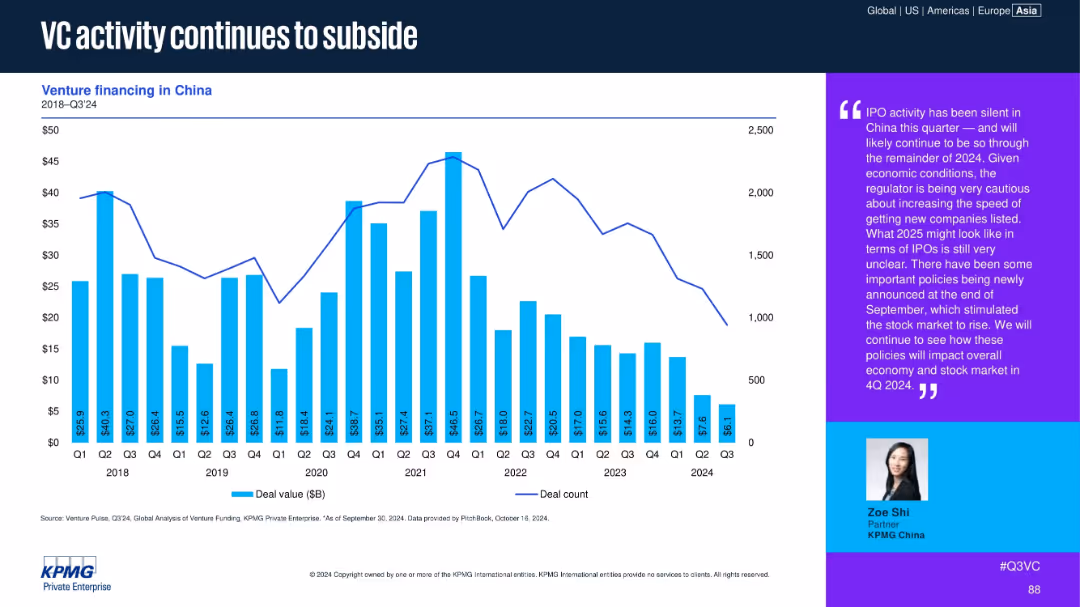
Bar and line chart showing venture financing in China from 2018 to Q3 2024, alongside qualitative commentary box.
Market Analysis and Trends
Financial Services
Venture activity in China continues to decline, with Q3 2024 showing minimal IPO activity and reduced deal counts. The commentary suggests regulatory caution and economic uncertainty are dampening VC dynamics, with a wait-and-see approach for the remainder of 2024.
China, VC activity, deal value, IPO slowdown, regulation, economic outlook
false
Market Analysis and Trends
Financial Services financial-services
Mixed Chart
KPMG
View slide
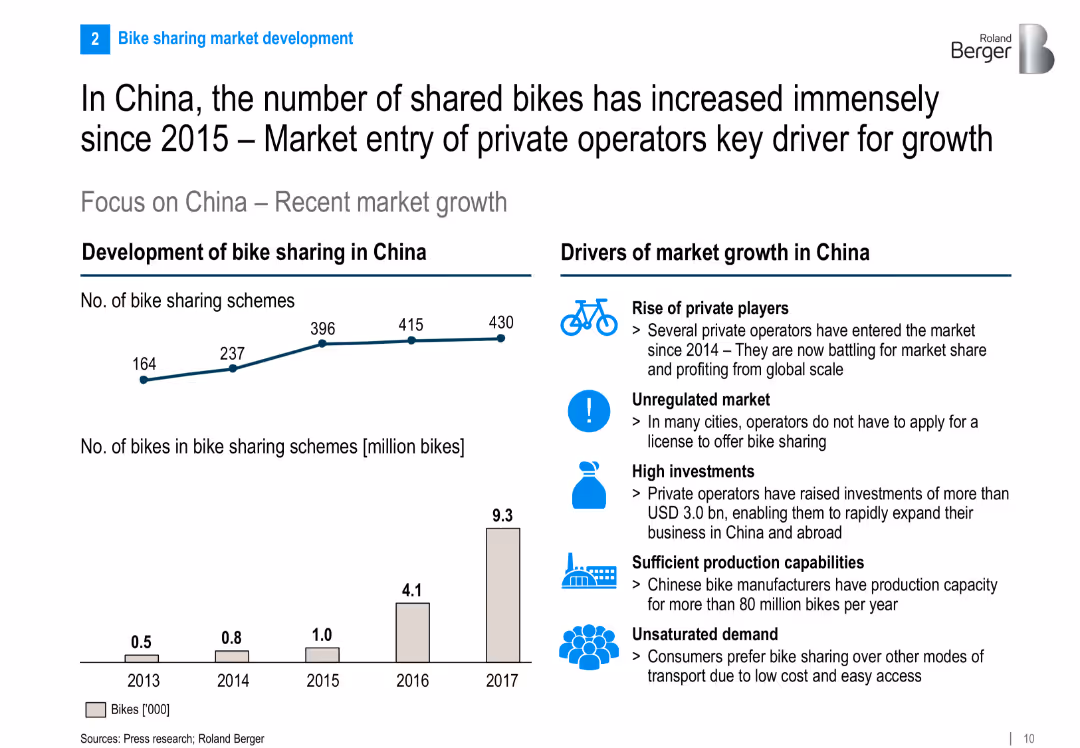
Split layout: line and bar graph for China's market development (2013–2017) and bulleted list of growth drivers on the right.
Strategic Planning
Transportation & Logistics
This slide analyzes the rapid rise of bike sharing in China, driven by private sector entry, high investments, unregulated markets, and demand. It shows quantitative growth in schemes and bikes and explains contributing factors.
China, bike sharing, market growth, private operators, investments, urban mobility, statistics
false
Strategic Planning
Transportation & Logistics transportation-and-logistics
Multiple Chart
Roland Berger
View slide
This slide presents two column charts and a line chart detailing China's labor force, export percentage, and consumer spending.
Market Analysis and Trends
Consumer Goods
Discusses China's changing economic landscape with a focus on shifting labor demographics and increasing consumer expenditures.
China, consumer spending, labor force, economic trends, exports
false
Market Analysis and Trends
Consumer Goods consumer-goods
Multiple Chart
Deutsche Bank
View slide
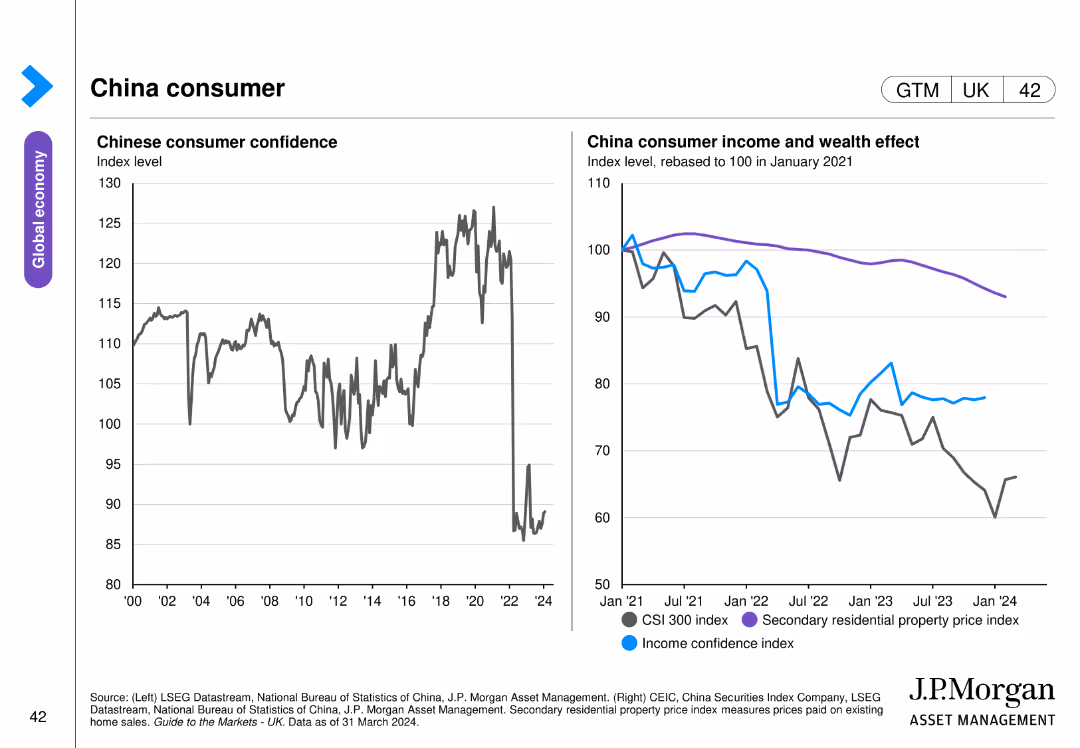
Two line charts: one shows Chinese consumer confidence index, and the other displays consumer income and wealth effect with CSI 300 index and secondary residential property price index.
Market Analysis and Trends
Financial Services
This slide focuses on consumer confidence and the income and wealth effect in China, comparing indices related to consumer behavior and property prices. Used for consumer market analysis and economic forecasting.
China, consumer, confidence, income, wealth
false
Market Analysis and Trends
Financial Services financial-services
Multiple Chart
JP Morgan
View slide
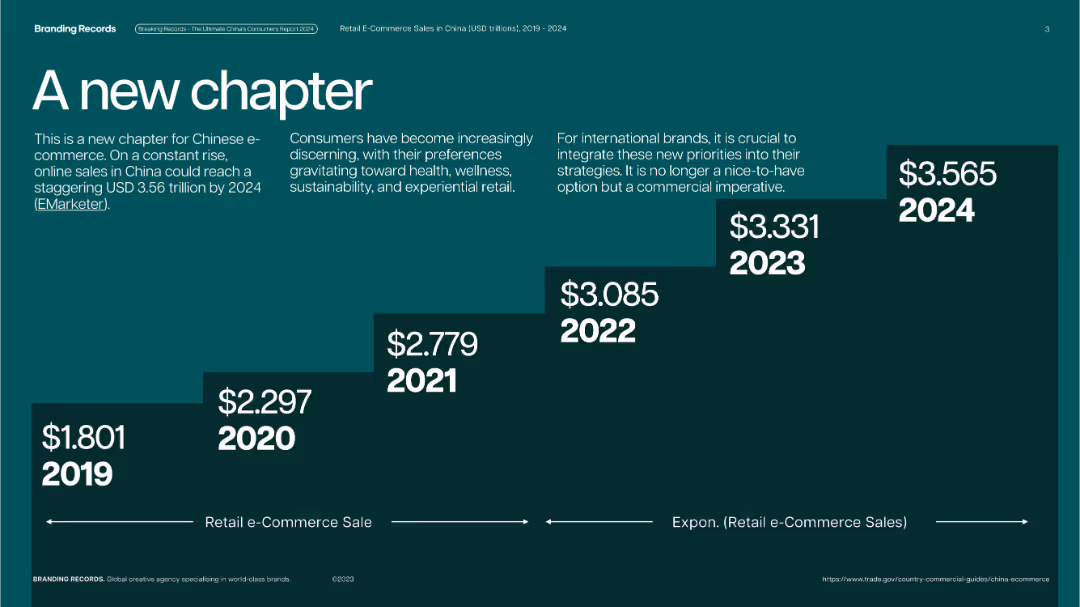
Dark green background with bold step chart design; each year shown on ascending blocks with white text.
Market Analysis and Trends
Retail & E-commerce
Highlights the continuous growth of retail e-commerce sales in China from 2019 to 2024, forecasting USD 3.565 trillion in 2024. It emphasizes evolving consumer preferences and urges brands to align with these shifts.
China, e-commerce, growth, retail, consumer trends, health, wellness, international
false
Market Analysis and Trends
Retail & E-commerce retail-and-e-commerce
Single Chart
McKinsey
View slide
Includes a line and column chart. The line chart tracks China's Manufacturing and Non-Manufacturing PMI, and the bar graph details monthly gambling revenues in Macau, indicating economic health and consumer behavior.
Market Analysis and Trends
Financial Services
Highlights China's economic strategies and outcomes in 2021, focusing on sectors like manufacturing and consumer spending. The slide provides insights into how policy shifts and economic activities influence broader economic stability and growth forecasts.
China, economic policy, PMI, consumer spending, economic growth
false
Market Analysis and Trends
Financial Services financial-services
Multiple Chart
Deloitte
View slide
The slide features two line charts. The left chart shows the share of GDP by sector (manufacturing, services, agriculture) from 1983 to 2023. The right chart shows total exports and imports as a percentage of GDP from 1983 to 2023.
Market Analysis and Trends
Financial Services
This slide examines China's economic transition, highlighting the changes in GDP composition by sector and trends in exports and imports over the last four decades. It illustrates the shift from manufacturing to services and the dynamics of trade.
China, economic transition, GDP, sector, exports, imports, manufacturing, services, agriculture, line chart
false
Market Analysis and Trends
Financial Services financial-services
Multiple Chart
JP Morgan
View slide
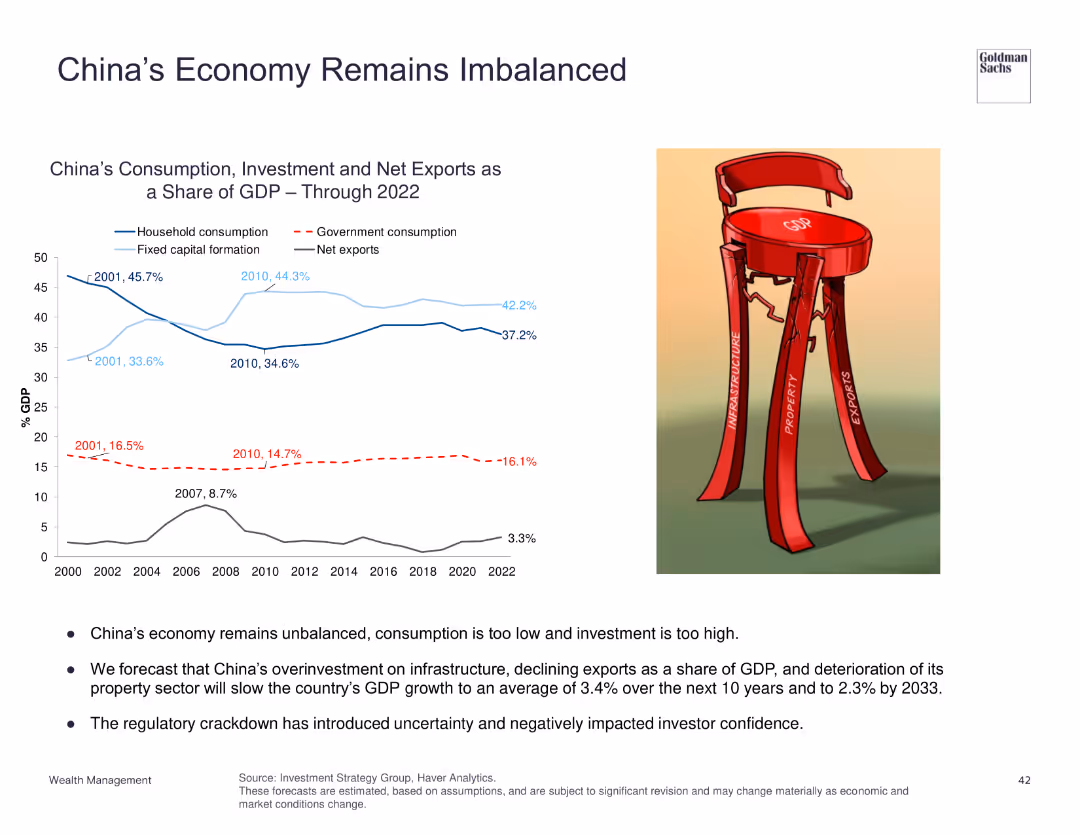
Line charts and an illustration of a broken stool to represent economic imbalance.
Market Analysis and Trends
Financial Services
Analyzes China's consumption, investment, and net exports as a share of GDP, highlighting economic imbalances and future forecasts.
China, economy, GDP, consumption, investment
false
Market Analysis and Trends
Financial Services financial-services
Mixed Chart
Goldman Sachs
View slide
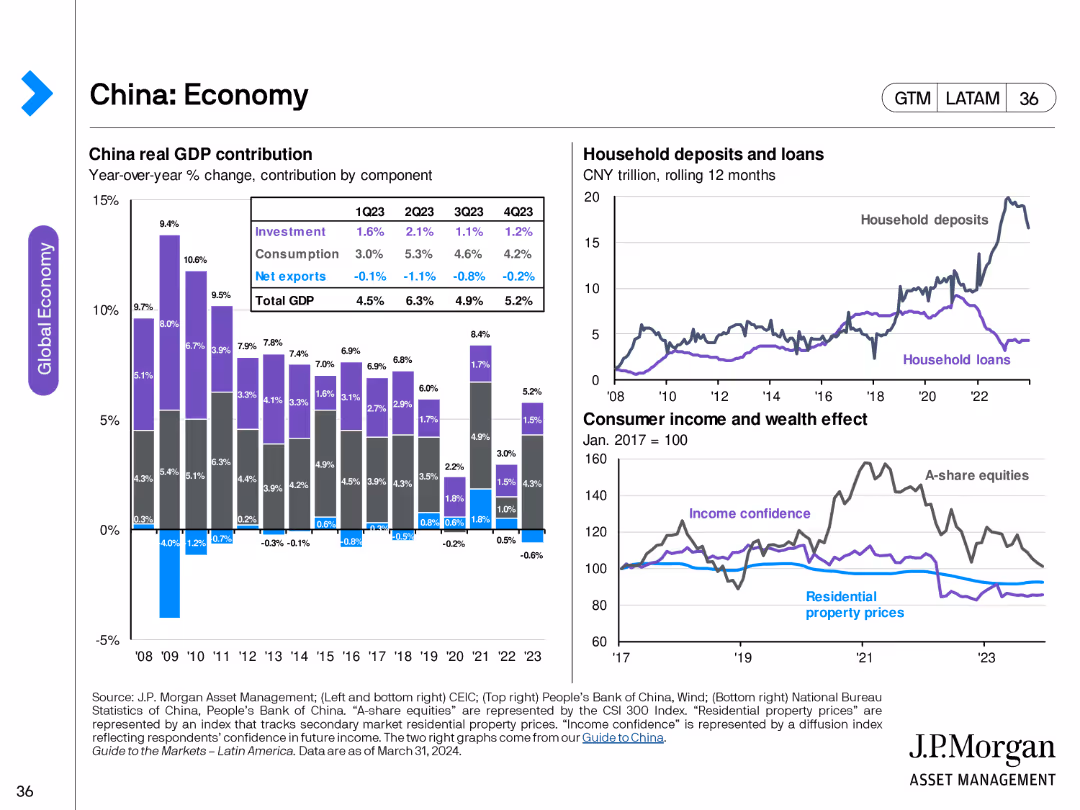
This slide includes stacked column charts showing China's real GDP contribution by component, and line charts displaying household deposits and loans, consumer income, and wealth effect.
Market Analysis and Trends
Financial Services
The slide analyzes China's economic components, including GDP contribution, household financial behavior, and consumer confidence, providing insights into economic health and trends in China.
China, economy, GDP, household deposits, household loans, consumer income, wealth effect, economic trends
false
Market Analysis and Trends
Financial Services financial-services
Multiple Chart
JP Morgan
View slide
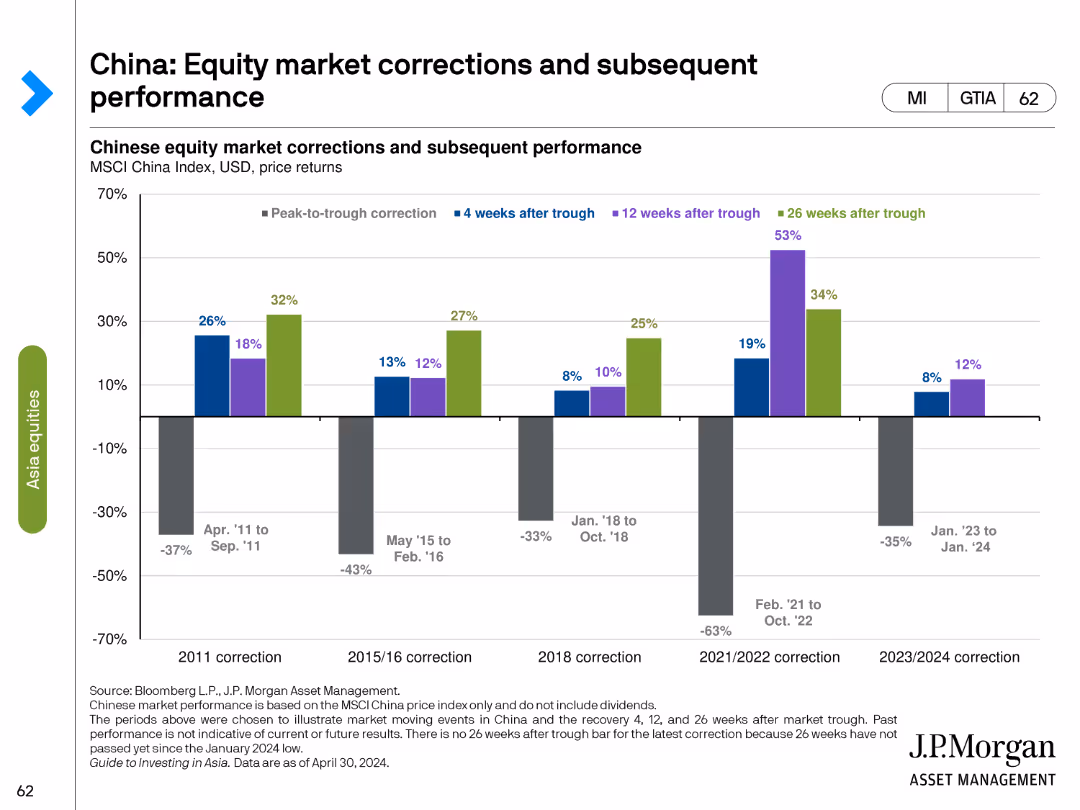
This slide includes a column chart showing peak-to-trough corrections and subsequent performance of the Chinese equity market. Different colors represent recovery periods of 4, 12, and 26 weeks after market trough.
Market Analysis and Trends
Financial Services
The slide shows the performance of Chinese equities during various correction periods, detailing the percentage drops and recovery patterns to analyze market resilience and investment opportunities post-correction.
China, equity market, corrections, performance, peak-to-trough, recovery, financial analysis, investment opportunities, market resilience, post-correction
false
Market Analysis and Trends
Financial Services financial-services
Single Chart
JP Morgan
View slide
This slide features two line charts. The first chart shows the MSCI China price-to-book ratio over time. The second chart displays MSCI China historical drawdowns in percentage terms.
Market Analysis and Trends
Financial Services
The slide analyzes the MSCI China price-to-book ratio and historical drawdowns, offering insights into market fluctuations and valuation trends.
China, equity, price-to-book ratio, drawdowns, MSCI, market analysis
false
Market Analysis and Trends
Financial Services financial-services
Multiple Chart
JP Morgan
Previous
Loading...
Hold On!
We are searching in our database
If nothing, comes up, please try different filters!
Column Chart
Heatmap
Chevron
Org Chart
Infographic
Callouts
Timeline
List
Graphic
Picture
Process Flow
Diagram
Paragraph
Map
Table
Framework
Subtitle
Takeaway Box
Icon
Other Chart
Radar Chart
Waterfall Chart
Mekko Chart
Pie Chart
Scatter Plot
Line Chart
Bar chart
Bullet points
Create a FREE account to continue browsing
Receive Instant Access to 1,000+ slides from companies like McKinsey, Google, and Goldman Sachs
First Name
Last Name
Email
Password
I agree to all
Terms & Privacy Policy
Thank you! Your submission has been received!
Oops! Something went wrong while submitting the form.
Have an account?
Sign in
Upgrade to PRO to Save slides
Advanced Search and Filters
Access to 15,000+ slides
Access to Category Pages
Save/Bookmark Slides
PowerPoint Template Library
Pick a Plan
MONTHLY
$12/month
Billed every month, Cancel anytime.
YEARLY
$9/year
Billed $108 annually, Cancel anytime.
Checkout for $12/month
Checkout for $108/yr
Secured by Stripe | AES-256 bit encryption