My Account
My Slides
Search by Category
Templates
View All Templates
Download Template Slides
Leave Feedback
Login
Logout
Get Started
Browse all Slides
Browse all Slides
Create a FREE Account
Instant access to 1,000+ real slides from top companies like McKinsey, BCG, Goldman Sachs, Google and many more!
First Name
Last Name
Email
Password
I agree to all
Terms & Privacy Policy
Thank you! Your submission has been received!
Oops! Something went wrong while submitting the form.
Have an account?
Sign in
Spark Your Next Big Idea with New Presentation Templates
VIEW ALL Templates
Welcome,
Welcome
PRO
Show Featured Only
Checkbox 8
Companies
Mckinsey
Bain
BCG
EY
Deloitte
Accenture
PwC/Strategy&
JP Morgan
Goldman Sachs
Morgan Stanley
Citigroup
Deutsche Bank
Barclays
LEK
KPMG
Kearney
Oliver Wyman
Booz Allen Hamilton
Gartner
IPSOS
Nielsen
Slide type
Text Only
Linear Flow
Vertical Flow
Single Chart
Header Horizontal
Mixed Chart
Header Vertical
Pillar
Multiple Chart
Graphic
Agenda
Title
Table
Framework
Industry
Technology & Software
Artificial Intelligence
Financial Services
Retail & E-commerce
Consumer Goods
Industrial & Manufacturing
Transportation & Logistics
Telecommunications
Real Estate & Construction
Hospitality & Tourism
Professional Services
Education & Training
Media & Entertainment
Agriculture & Food Production
Healthcare & Pharmaceuticals
Environmental Services & Sustainability
Government & Public Sector
Use Case
Mergers and Acquisitions
Performance Metrics and KPIs
Client Case Studies
Competitive Landscape
Corporate Finance and Valuation
Product and Service Analysis
Customer and Market Segmentation
Organizational Structure and Change
Industry Overview
Regulatory and Compliance
Risk Assessment and Management
Investment Analysis
Organizational Structure and Change
Human Resources and Talent Management
Financial Performance
Market Analysis and Trends
Sales and Business Development
Human Resources and Talent Management
Clear all
Thank you! Your submission has been received!
Oops! Something went wrong while submitting the form.
Tag
View slide
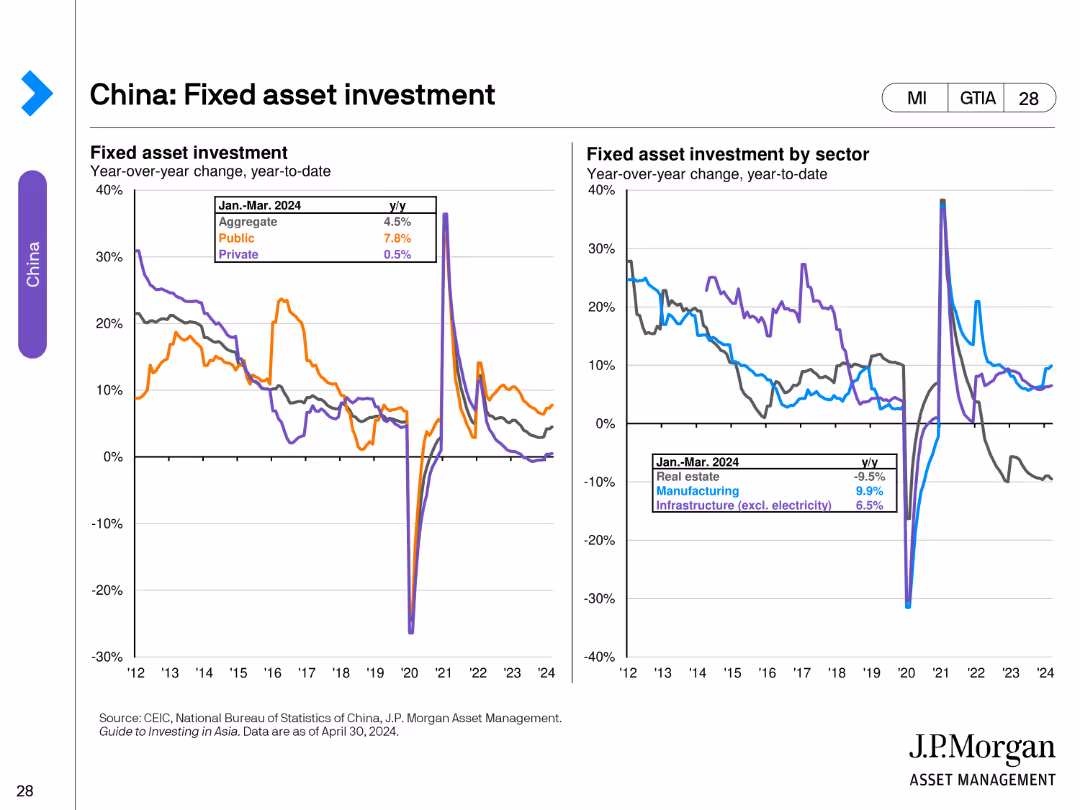
The slide features two line charts. The left chart shows year-over-year changes in fixed asset investment from January to March 2024, broken down by aggregate, public, and private investments. The right chart displays fixed asset investment by sector (real estate, manufacturing, infrastructure) from 2012 to 2024.
Market Analysis and Trends
Financial Services
This slide evaluates fixed asset investment trends in China, detailing the year-over-year changes and sector-specific investments. It compares public and private investment levels and the performance of various sectors over time.
China, fixed asset investment, public, private, sector, real estate, manufacturing, infrastructure, trends, line chart
false
Market Analysis and Trends
Financial Services financial-services
Multiple Chart
JP Morgan
View slide
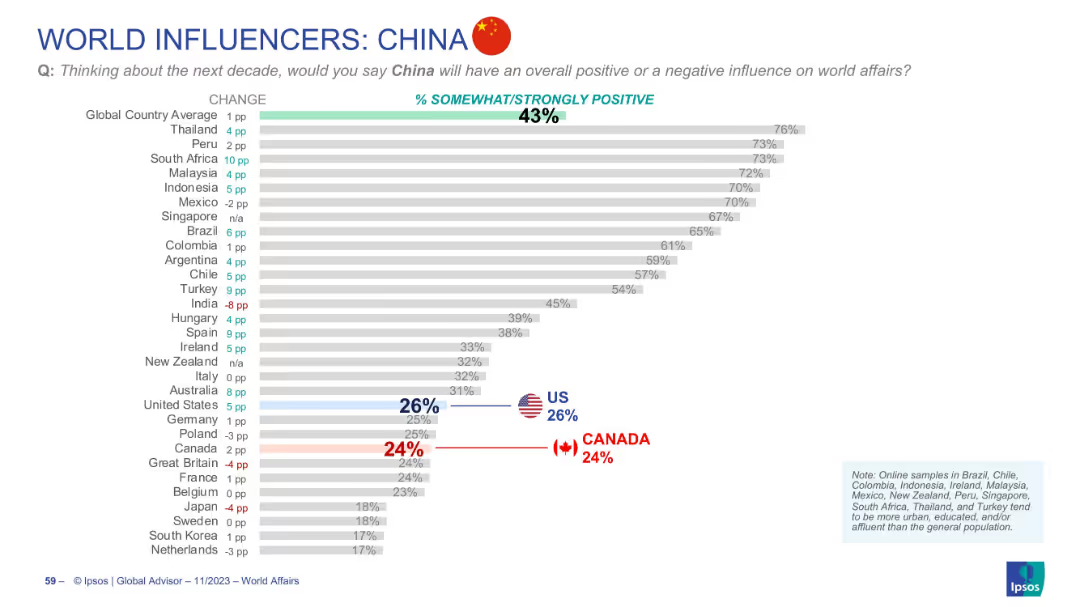
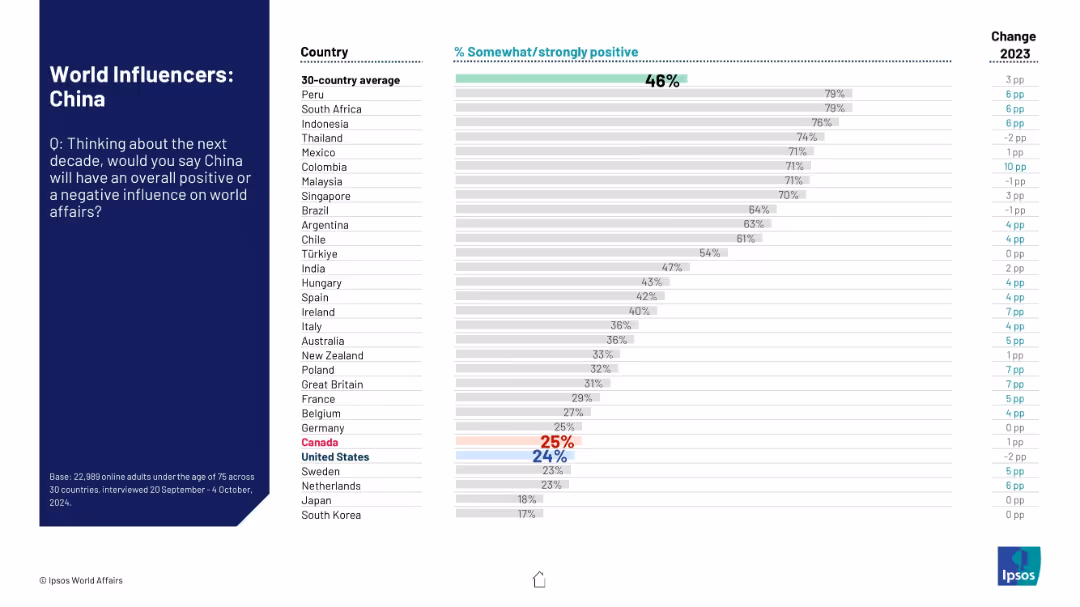
Horizontal bar graph of countries’ perceptions of China’s influence, with flags and large percentage markers for US and Canada.
Market Analysis and Trends
Government & Public Sector
This slide ranks global sentiment on China's influence over the next decade. The average positive view is 43%, with Southeast Asia showing high support. Western countries, especially Canada and the US, are much lower.
China, global influence, opinion, trends, perception, Ipsos, international relations, Asia
false
Market Analysis and Trends
Government & Public Sector government-and-public-sector
Single Chart
IPSOS
View slide
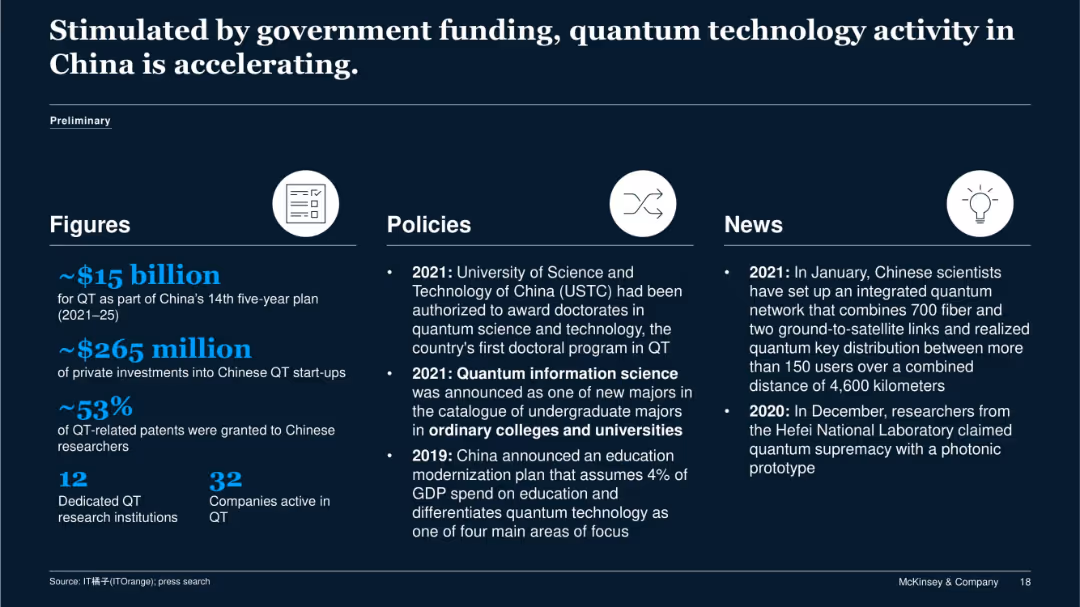
Three-column layout with icons and text for Figures, Policies, and News; dark background with bold blue and white fonts.
Strategic Planning
Government & Public Sector
The slide presents China’s major push in QT through $15B in government funding and $265M in private capital. It details policies enabling doctoral programs and education investments, and news of breakthrough achievements in quantum networks and photonic quantum supremacy.
China, government policy, QT, investment, research, education
false
Strategic Planning
Government & Public Sector government-and-public-sector
Pillar
McKinsey
View slide
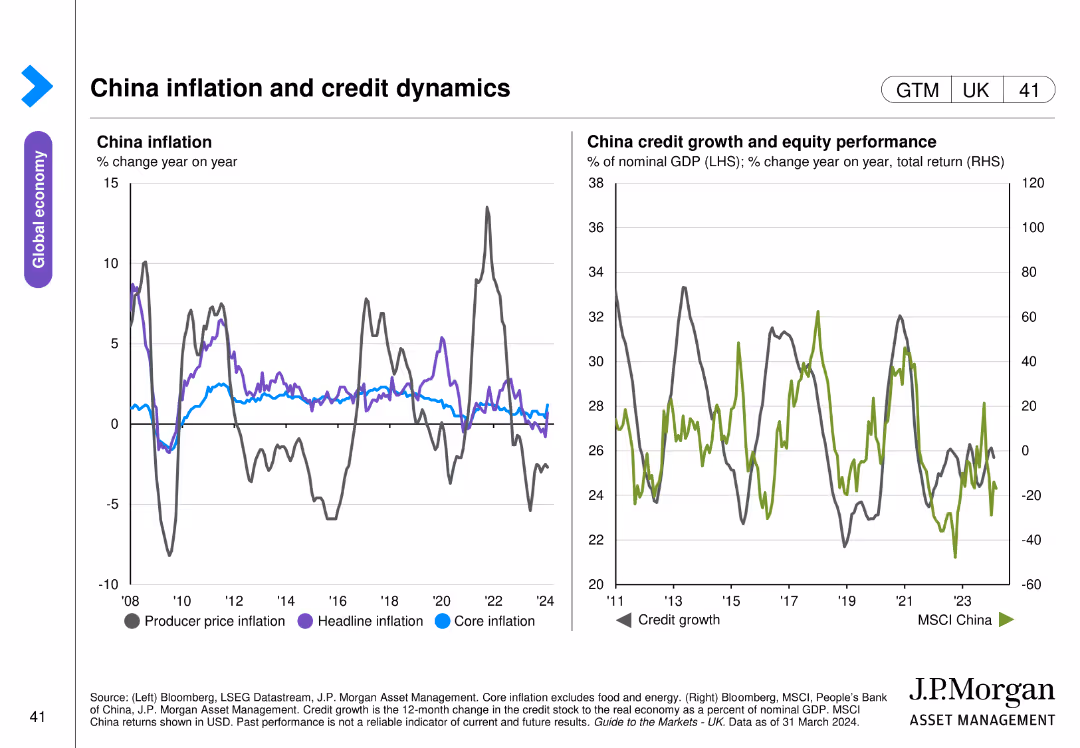
Two line charts: one displays China’s producer price, headline, and core inflation, and the other shows credit growth and equity performance with MSCI China index.
Market Analysis and Trends
Financial Services
This slide analyzes China's inflation rates across different measures and their credit growth dynamics, along with equity performance. Used for economic trend analysis and investment strategy.
China, inflation, credit, equity, MSCI
false
Market Analysis and Trends
Financial Services financial-services
Multiple Chart
JP Morgan
View slide
Left-hand context section and right-side horizontal bar chart comparing nations' views.
Market Analysis and Trends
Government & Public Sector
The slide summarizes global attitudes toward China’s future role in world affairs. The data show a polarized view, with some countries more favorable than others, and general sentiment still low.
China, influence perception, global opinion, Ipsos, international relations, approval ratings, sentiment data, 2024 survey, comparison chart
false
Market Analysis and Trends
Government & Public Sector government-and-public-sector
Mixed Chart
IPSOS
View slide
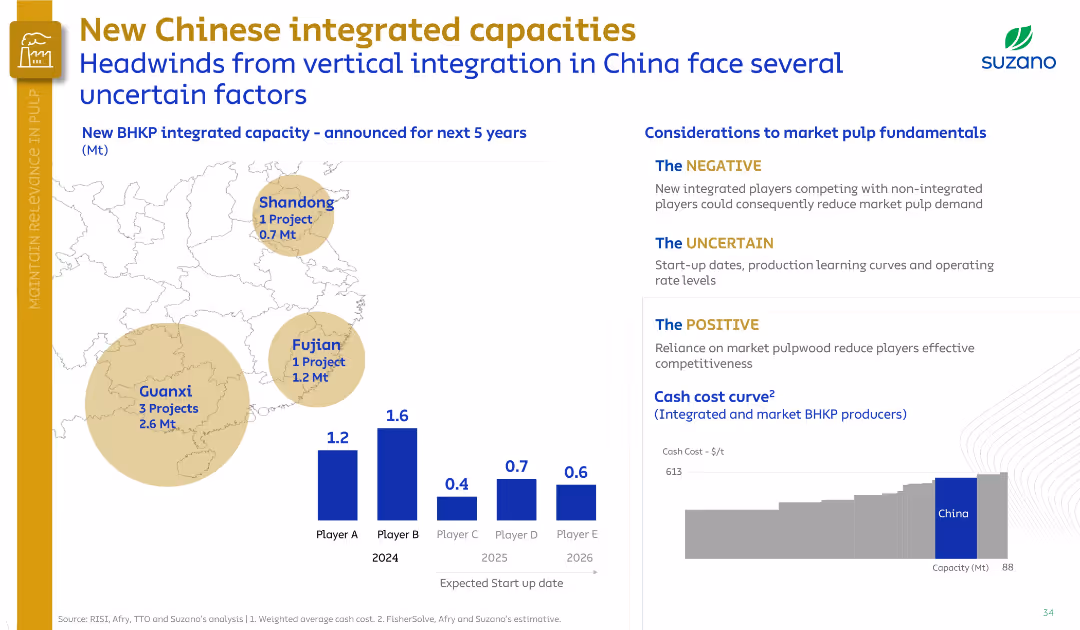
Left map shows project locations; right section outlines market impacts (positive, negative, uncertain). Uses muted tones and a segmented layout.
Competitive Landscape
Industrial & Manufacturing
Highlights new integrated BHKP capacities in China and their potential impact. Identifies risks (competition, uncertainty in execution) and advantages (market pulp reliance). A cost curve shows Chinese producers’ positioning.
China, integrated capacity, BHKP, Suzano, market risk, competitiveness, pulp
false
Competitive Landscape
Industrial & Manufacturing industrial-and-manufacturing
Multiple Chart
Goldman Sachs
View slide
Two line charts displaying fixed asset investment trends in China by ownership and sector, covering state-owned, private, and total investments.
Market Analysis and Trends
Financial Services
This slide examines investment trends in China, showing changes in fixed asset investments by state-owned enterprises, private sectors, and various industries.
China, investment, fixed assets, state-owned enterprises, private sector
false
Market Analysis and Trends
Financial Services financial-services
Multiple Chart
JP Morgan
View slide
Red line and bar graph against a white background, showing China's cases per day and total reported cases, with key event markers.
Risk Assessment and Management
Healthcare & Pharmaceuticals
Outlines China's response to COVID-19 with lockdowns and testing, highlighting the timeline of cases and government actions.
China, lockdowns, testing, COVID-19, government response
false
Risk Assessment and Management
Healthcare & Pharmaceuticals healthcare-and-pharmaceuticals
Single Chart
McKinsey
View slide
This slide is focused on the Chinese luxury goods market, featuring a column chart that track consumption growth from 2012 to 2017, compared to non-Chinese markets. It uses contrasting colors like red for China and gray for other markets, effectively highlighting the differences in growth rates.
Market Analysis and Trends
Consumer Goods
Highlights the booming luxury goods consumption in China, contrasting it with more moderate growth in other global markets. Details the impact of increased consumer confidence and economic factors in China, while providing a broader view of global market trends.
China, luxury goods, market growth, consumer behavior, global comparison
false
Market Analysis and Trends
Consumer Goods consumer-goods
Single Chart
Bain
View slide
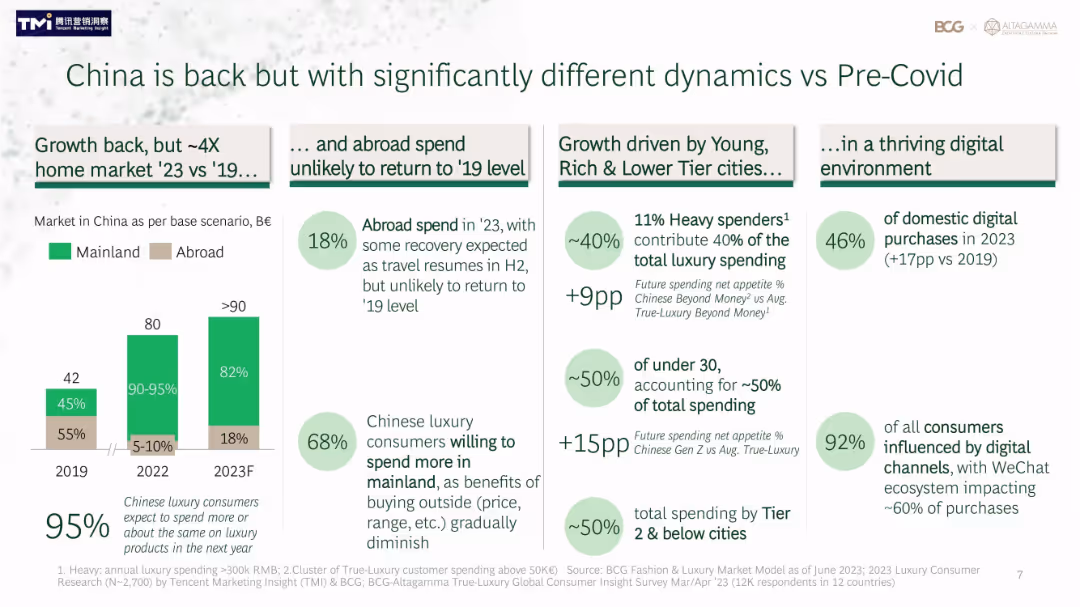
Grid layout of statistics, bar graph, and segmented insights on spending shifts and digital trends
Market Analysis and Trends
Consumer Goods
This slide details how China’s luxury market has changed since pre-Covid, noting a shift toward domestic consumption and strong digital influence. Charts and stats show reduced outbound spend, younger and lower-tier city consumer dominance, and digital purchases now making up nearly half the market.
China, luxury market, digital, consumer trends, post-Covid, Tier 2 cities, youth, e-commerce, domestic spending
false
Market Analysis and Trends
Consumer Goods consumer-goods
Mixed Chart
BCG
View slide
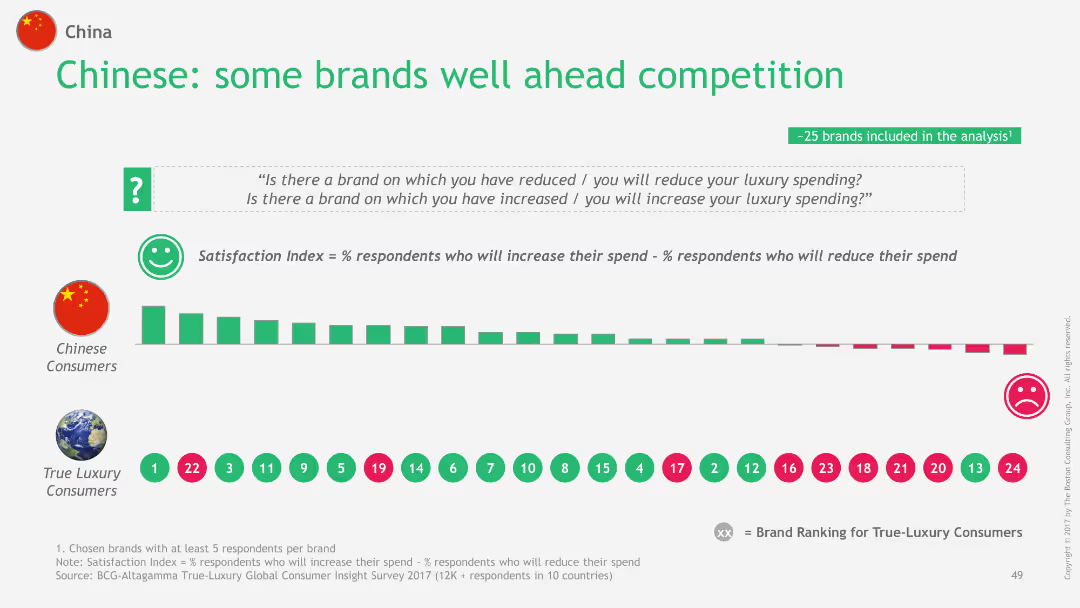
The slide features a bar chart comparing the satisfaction index of various luxury brands among Chinese consumers and True-Luxury Consumers. It shows the ranking of 25 brands based on the percentage of respondents likely to increase vs. reduce their luxury spending.
Customer and Market Segmentation
Consumer Goods
This slide presents the satisfaction index of luxury brands among Chinese consumers, highlighting which brands are ahead in customer satisfaction compared to True-Luxury Consumers, using a comparative analysis of 25 brands.
China, luxury, brand satisfaction, consumers, index
false
Customer and Market Segmentation
Consumer Goods consumer-goods
Single Chart
BCG
View slide
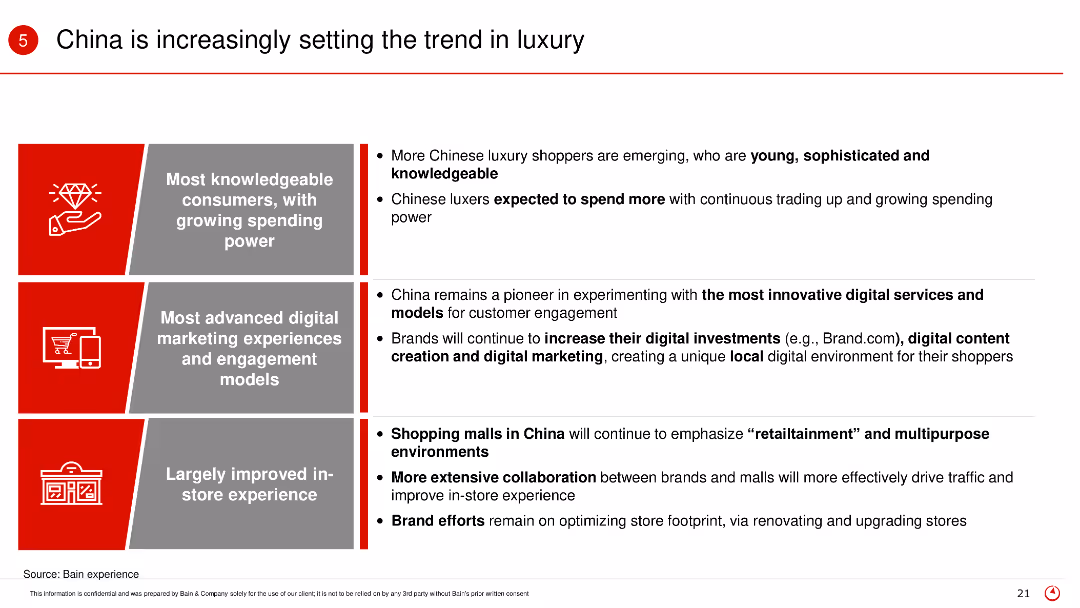
The slide uses a three-column layout with text and icons in each column. Red and gray color scheme is used for emphasis.
Market Analysis and Trends
Retail & E-commerce
The slide discusses how China is leading in luxury market trends with knowledgeable consumers, advanced digital marketing, and improved in-store experience.
China, luxury, consumers, digital marketing, trends
false
Market Analysis and Trends
Retail & E-commerce retail-and-e-commerce
Table
Bain
View slide
A combination of timeline, infographic elements, and key investment figures related to the company's history and activities in China, arranged neatly with icons and bullet points.
Strategic Planning
Financial Services
Analyzes the company’s long-term involvement in China and outlines strategies for capitalizing on the developing market, emphasizing the potential for growth and investment.
China, market expansion, investments, development, strategy
false
Strategic Planning
Financial Services financial-services
Table
Goldman Sachs
View slide
The slide includes a large image of the Chinese flag on the left, with text and a line graph on the right showing Chinese quarterly GDP growth rate. The layout is visually striking and data-focused.
Competitive Landscape
Industrial & Manufacturing
The slide outlines Ipsos' market strength in China, noting stability during COVID-19, the acquisition of Shanghai Focus RX, and the rebounding GDP growth in 2023.
China, market leader, GDP growth, acquisition, stability
false
Competitive Landscape
Industrial & Manufacturing industrial-and-manufacturing
Mixed Chart
IPSOS
View slide
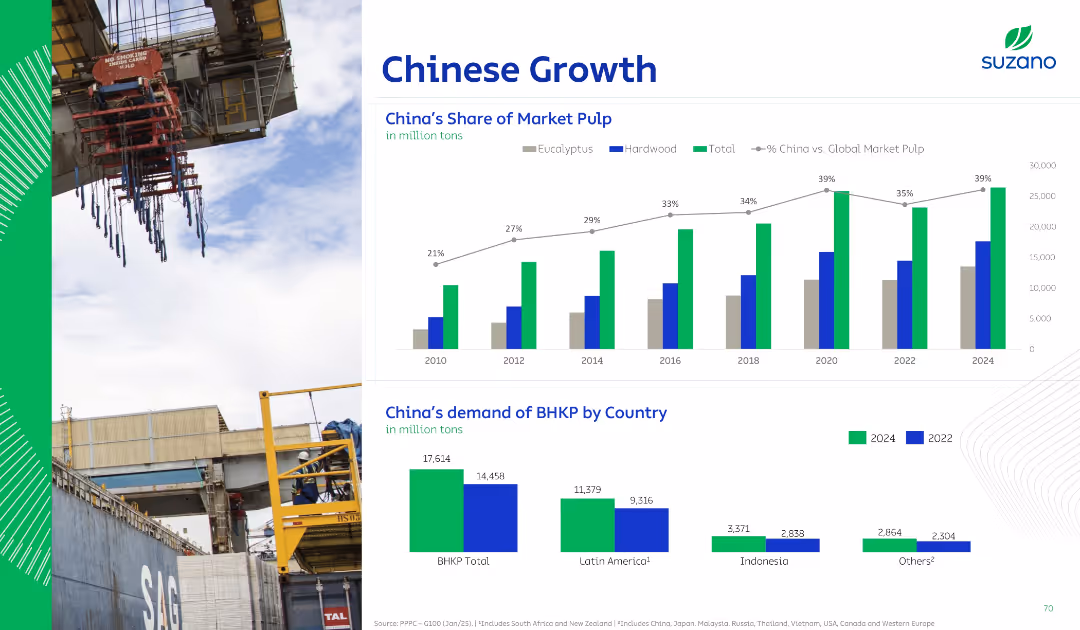
Dual-chart layout showing bar and line graphs. Top graph tracks China’s share of global pulp; bottom compares BHPP demand by region. Left-side industrial image.
Market Analysis and Trends
Industrial & Manufacturing
This slide highlights China's increasing market share in global pulp consumption, with detailed comparisons of demand across regions, especially in Latin America, Indonesia, and others for 2022 vs. 2024 projections.
China, market pulp, demand, hardwood, eucalyptus, global share, BHKP, growth, forecast
false
Market Analysis and Trends
Industrial & Manufacturing industrial-and-manufacturing
Multiple Chart
Goldman Sachs
View slide
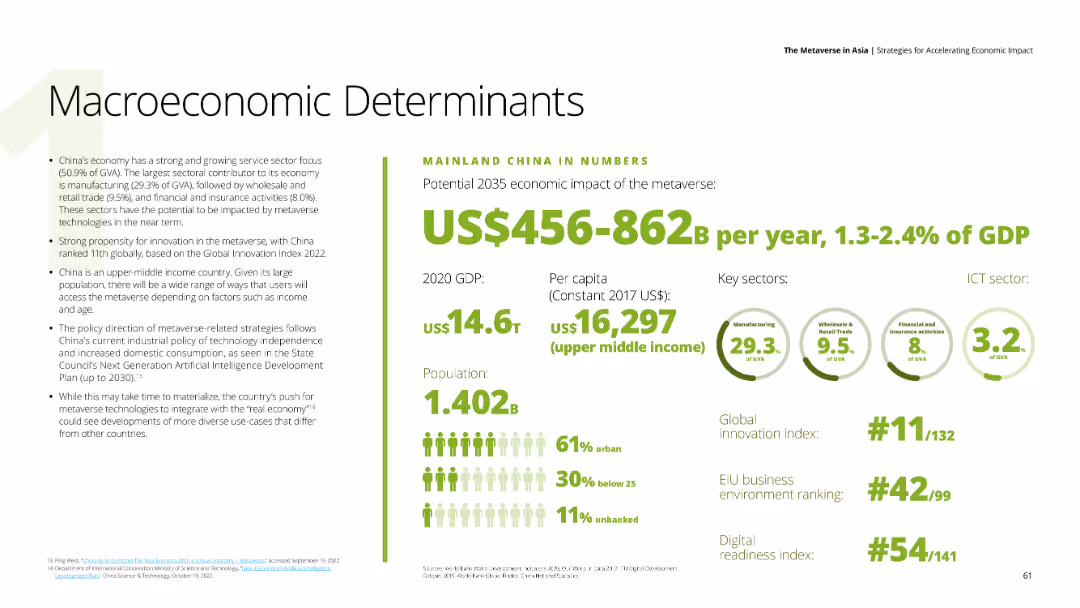
Features detailed text about China's economic impact of the metaverse, with numerical data on the right side including GDP, per capita income, and key sectors such as manufacturing, retail trade, and financial activities. The background is white.
Market Analysis and Trends
Financial Services
Discusses China's strong service sector and the potential economic impact of the metaverse, providing insights into China's GDP, innovation index ranking, and digital readiness.
China, metaverse, economic impact, service sector, digital readiness
false
Market Analysis and Trends
Financial Services financial-services
Mixed Chart
Deloitte
View slide
Two line charts comparing the Chinese yuan exchange rates with CFETS RMB Index and USD/CNY, and key policy rates over time.
Market Analysis and Trends
Financial Services
The slide presents China's monetary policy impacts on exchange rates and key policy interest rates, indicating trends in currency value and policy adjustments.
China, monetary policy, exchange rate, yuan, CFETS RMB Index, policy rates
false
Market Analysis and Trends
Financial Services financial-services
Multiple Chart
JP Morgan
View slide
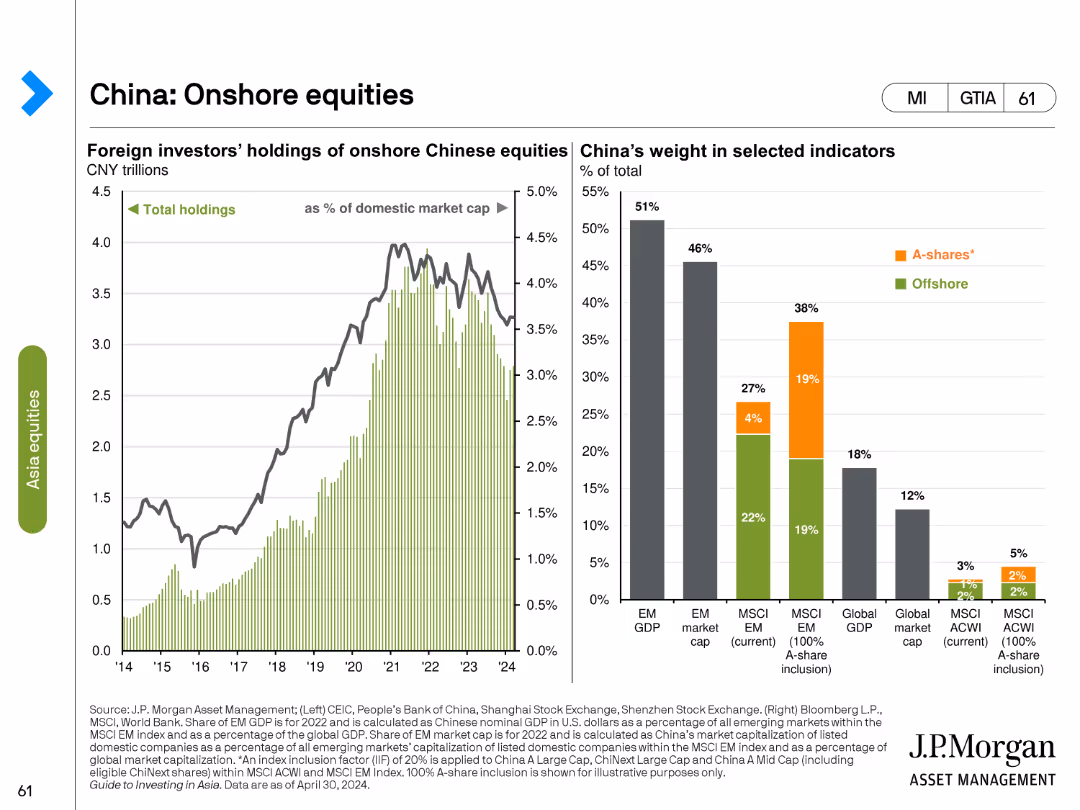
This slide has two charts: a line chart showing foreign investors' holdings of onshore Chinese equities, and a bar chart showing China’s weight in selected indicators such as EM GDP, EM market cap, and MSCI EM.
Market Analysis and Trends
Financial Services
The slide examines foreign investment in onshore Chinese equities, comparing total holdings and China's weight in various global market indicators, providing insight into the role of China in the global financial market.
China, onshore equities, foreign investment, EM GDP, EM market cap, MSCI EM, financial market, global indicators, weight, investment analysis
false
Market Analysis and Trends
Financial Services financial-services
Multiple Chart
JP Morgan
View slide
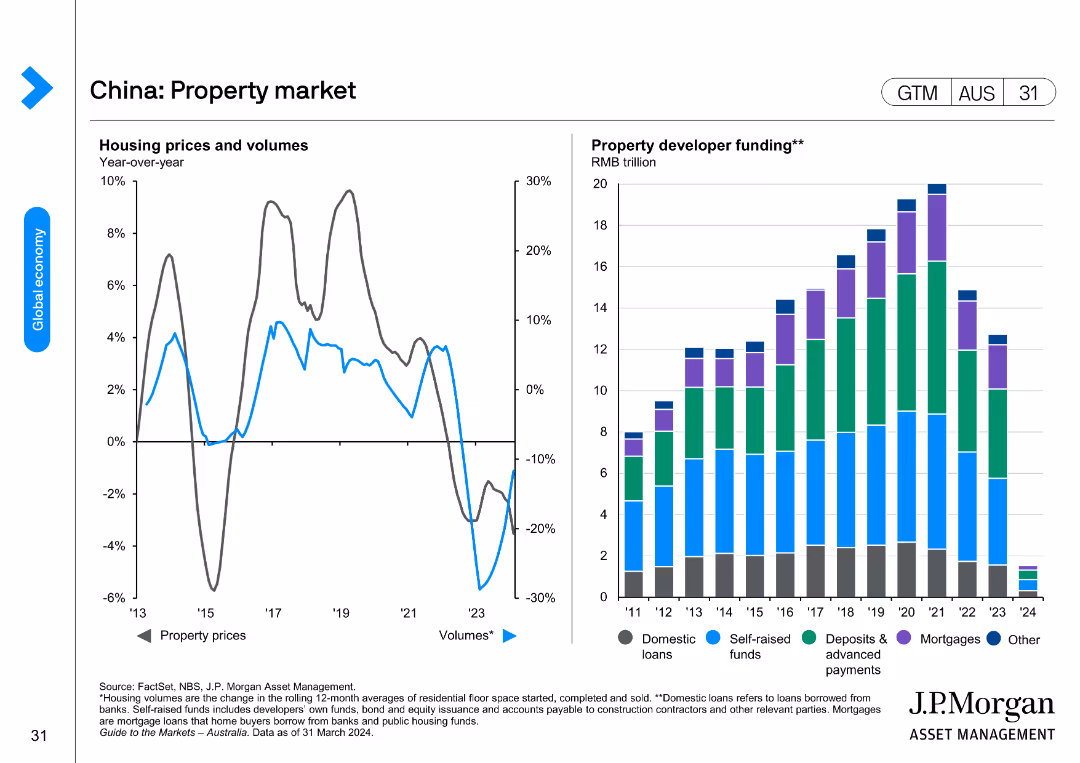
Two charts showing year-over-year changes in housing prices and volumes, and property developer funding sources.
Market Analysis and Trends
Real Estate & Construction
The slide analyzes China's property market trends, focusing on housing prices, transaction volumes, and the funding structure of property developers.
China, property market, housing prices, volumes, developer funding
false
Market Analysis and Trends
Real Estate & Construction real-estate-and-construction
Multiple Chart
JP Morgan
View slide
The slide features multiple column charts comparing China's recovery rates in various sectors to global rates. It includes categories like consumer products, fashion, energy, and travel. Background images correspond to each category.
Market Analysis and Trends
Financial Services
This slide shows China's recovery in various industries post-2021 compared to the world, focusing on sales growth and travel occupancy. Used for analyzing economic resilience and recovery trends.
China, recovery, consumer products, fashion, energy, tourism, sales growth, global comparison
false
Market Analysis and Trends
Financial Services financial-services
Table
BCG
View slide
The slide shows a line chart projecting China's future scrap supply and demand, with various scenarios outlined.
Strategic Planning
Industrial & Manufacturing
The slide projects future scenarios for China's scrap supply and demand by 2025, exploring potential industry developments and strategic considerations.
China, scrap, supply, demand, 2025, bar chart, column chart
false
Strategic Planning
Industrial & Manufacturing industrial-and-manufacturing
Single Chart
McKinsey
View slide
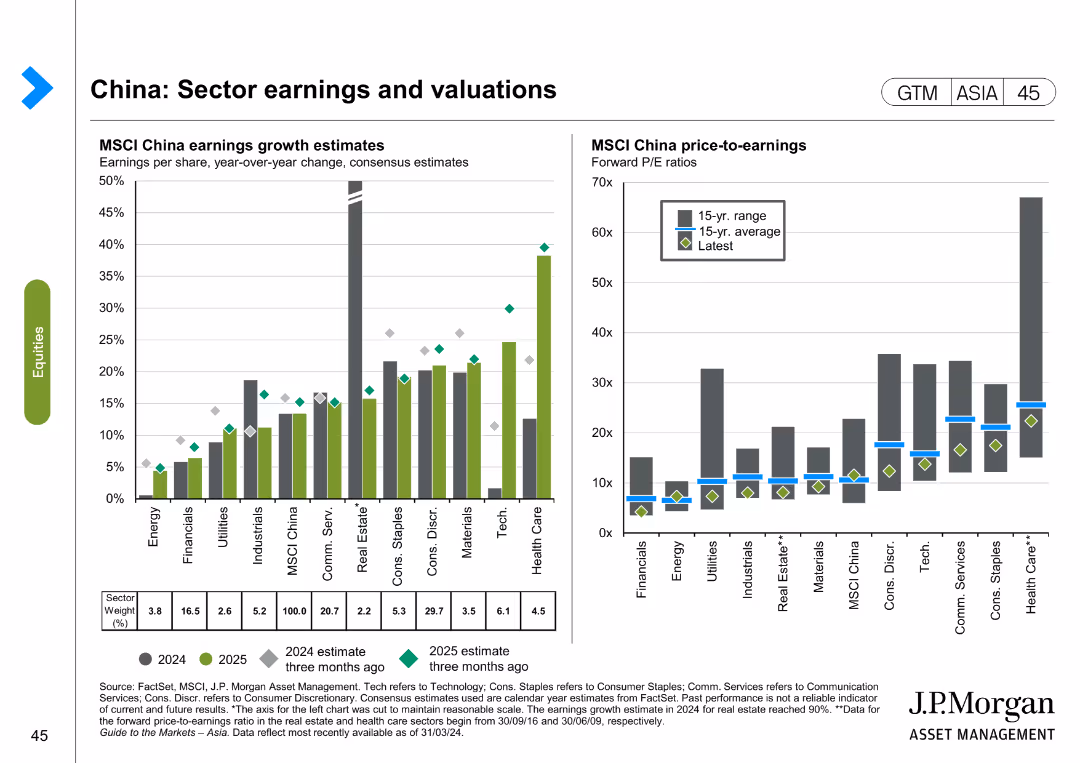
The slide contains two column charts. The left chart shows MSCI China earnings growth estimates by sector for 2024 and 2025, while the right chart shows MSCI China price-to-earnings ratios by sector.
Financial Performance
Financial Services
The slide analyzes sector earnings and valuations in China, focusing on earnings growth estimates and price-to-earnings ratios for different sectors. It is used for financial performance evaluation and investment decision-making.
China, sector earnings, valuations, MSCI, price-to-earnings, financial performance, investment
false
Financial Performance
Financial Services financial-services
Multiple Chart
JP Morgan
View slide
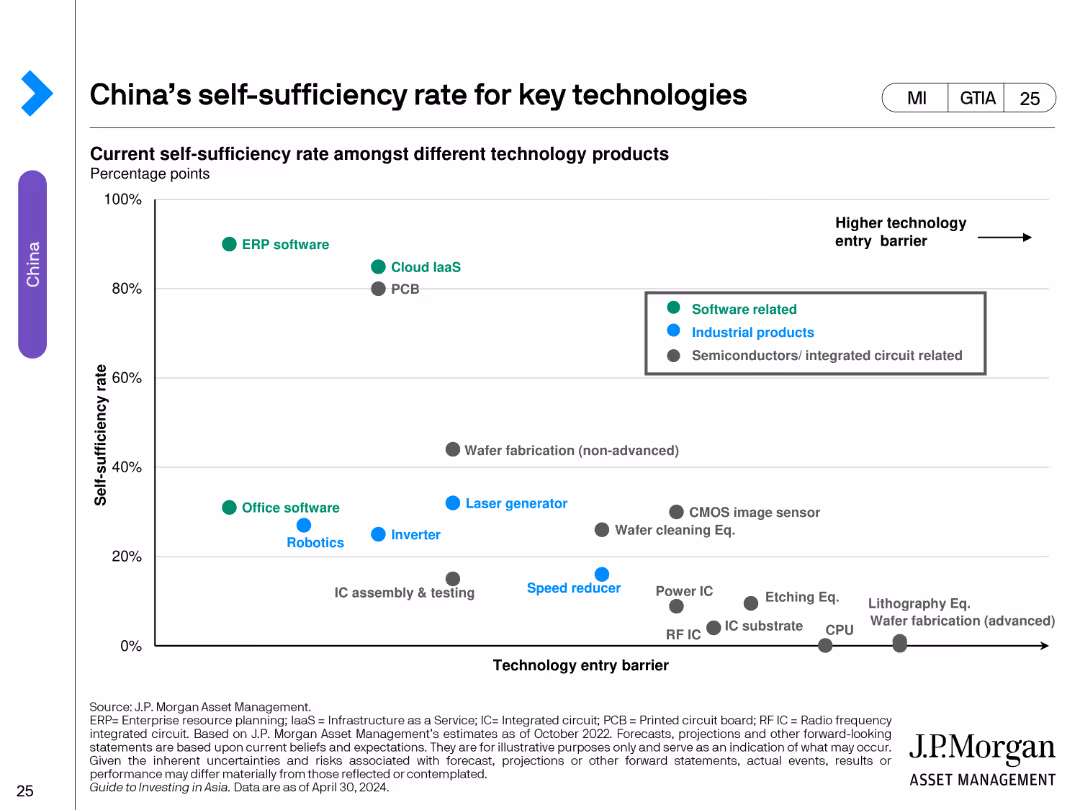
The slide contains a scatter plot showing the self-sufficiency rate of various technology products against the technology entry barrier. The products are categorized into software related, industrial products, and semiconductors/integrated circuits.
Market Analysis and Trends
Technology & Software
This slide analyzes China's self-sufficiency in key technologies, categorizing products by their self-sufficiency rates and technology entry barriers. It highlights areas where China is more or less self-sufficient in technology production.
China, self-sufficiency, technology, software, industrial products, semiconductors, scatter plot, tech barriers
false
Market Analysis and Trends
Technology & Software technology-and-software
Single Chart
JP Morgan
View slide
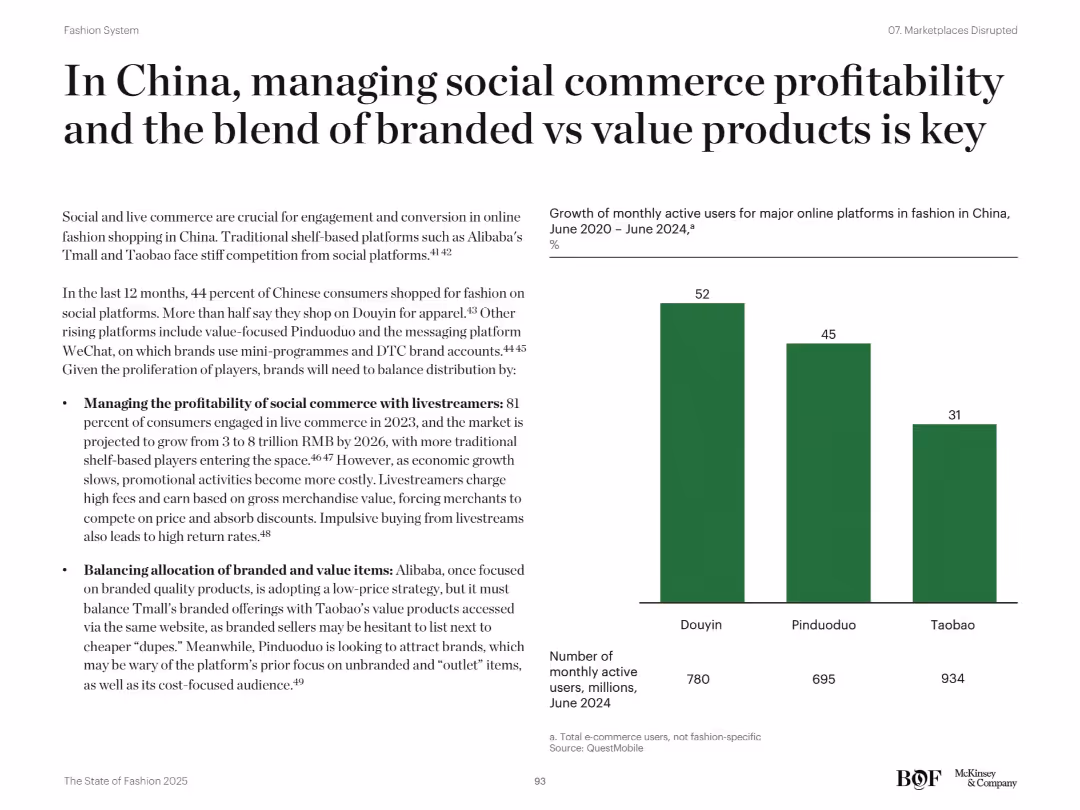
Balanced layout with left-aligned bullets and a bar chart showing MAU growth on the right; clean visual design
Market Analysis and Trends
Retail & E-commerce
The slide emphasizes the importance of social commerce and livestreaming in China’s fashion market. It discusses challenges around profitability and distribution between branded and value products. The bar chart presents monthly active user growth across Douyin, Pinduoduo, and Taobao. Strategic considerations include fee pressure from livestreamers and the shift in platform branding strategies.
China, social commerce, Douyin, livestreaming, Pinduoduo, Taobao, branded vs value, MAU
false
Market Analysis and Trends
Retail & E-commerce retail-and-e-commerce
Mixed Chart
McKinsey
View slide
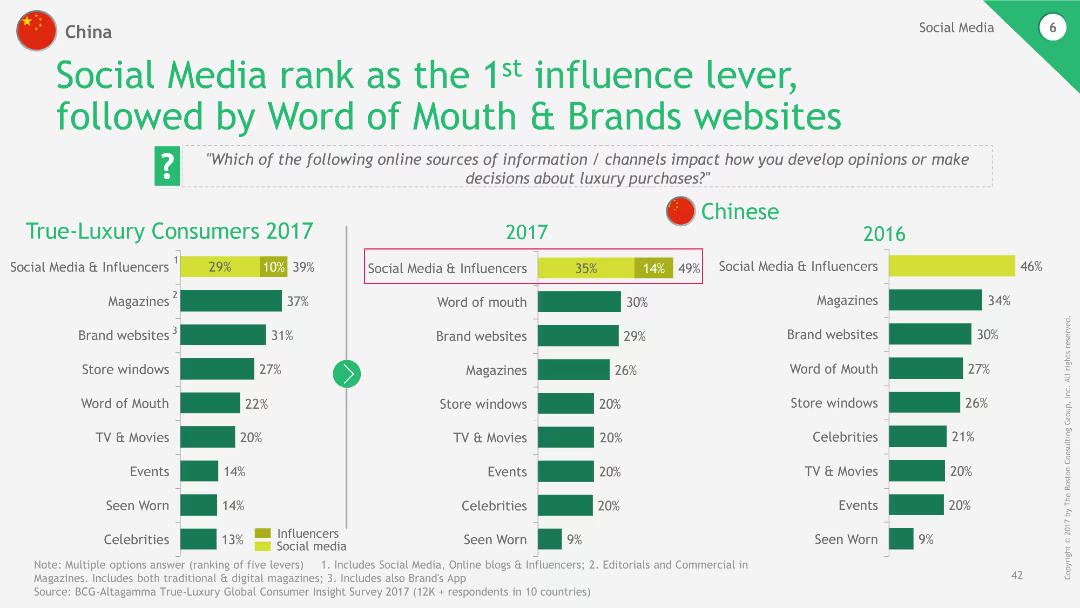
The slide includes a column chart showing the ranking of various influence levers in luxury purchases among Chinese consumers in 2017 and 2016. It highlights the top influence lever as Social Media & Influencers, followed by Word of Mouth and Brands websites.
Technology and Digital Transformation
Consumer Goods
This slide highlights the importance of social media and influencers in luxury purchase decisions among Chinese consumers, comparing data from 2017 and 2016.
China, social media, influencers, luxury, purchase
false
Technology and Digital Transformation
Consumer Goods consumer-goods
Multiple Chart
BCG
View slide
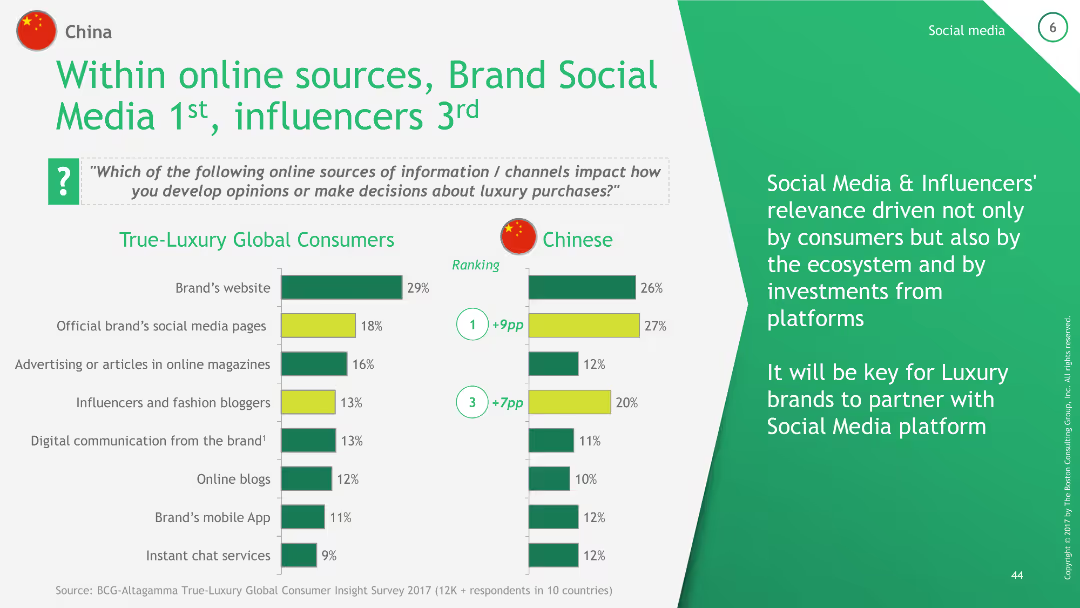
The slide contains a column chart comparing the relevance of various online sources of information for luxury purchases between True-Luxury Global Consumers and Chinese consumers. It ranks Brand's website, Official brand's social media pages, Advertising in online magazines, and Influencers.
Technology and Digital Transformation
Consumer Goods
This slide compares the relevance of different online sources of information for luxury purchases, emphasizing the higher importance of social media and influencers for Chinese consumers compared to global consumers.
China, social media, influencers, online sources, luxury
false
Technology and Digital Transformation
Consumer Goods consumer-goods
Multiple Chart
BCG
View slide
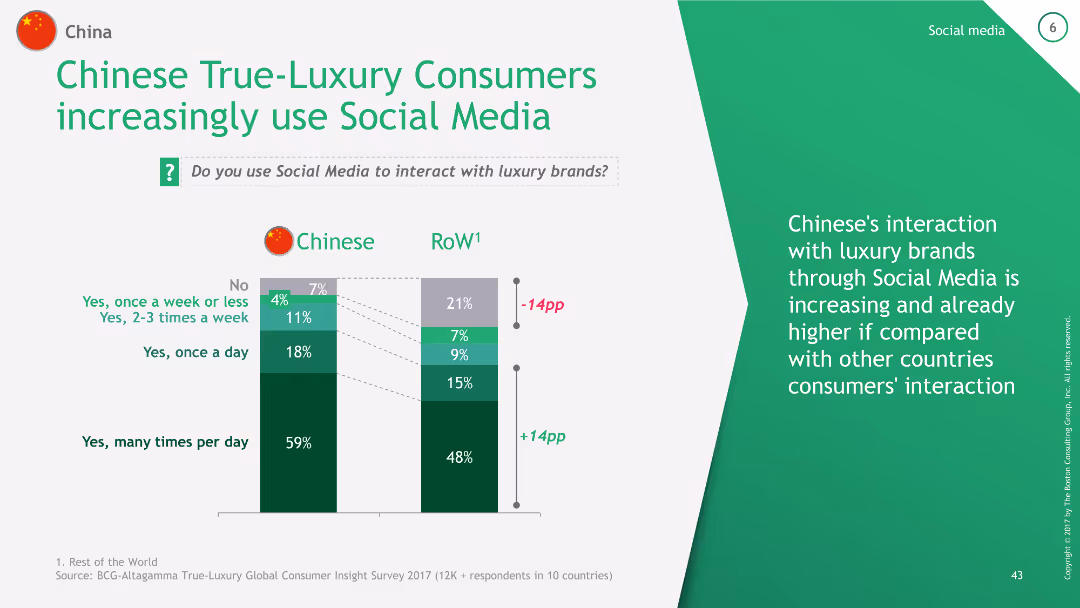
The slide features a column chart comparing the frequency of social media use among Chinese True-Luxury Consumers and the Rest of the World (RoW). It shows four frequency categories: many times per day, once a day, 2-3 times a week, and once a week or less.
Technology and Digital Transformation
Consumer Goods
This slide demonstrates the high frequency of social media use among Chinese luxury consumers compared to global averages, indicating a higher engagement with luxury brands through social media.
China, social media, luxury, engagement, frequency
false
Technology and Digital Transformation
Consumer Goods consumer-goods
Mixed Chart
BCG
View slide
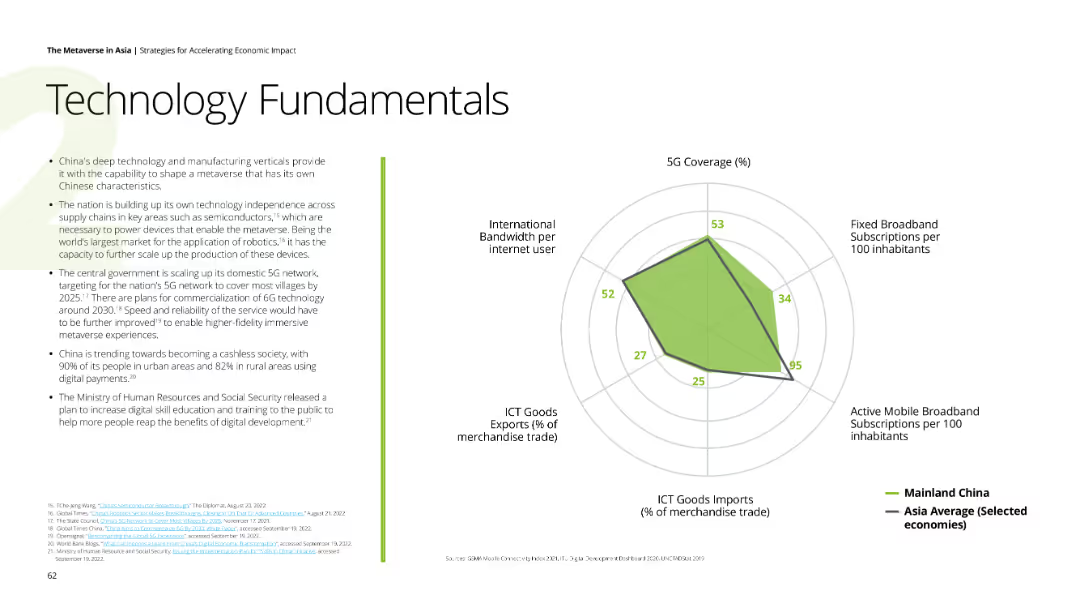
Displays a spider chart showing China's 5G coverage, broadband subscriptions, mobile broadband subscriptions, ICT goods imports, and international bandwidth per internet user compared to Asia average. Background is white with green highlights.
Technology and Digital Transformation
Technology & Software
Analyzes China's technological advancements, focusing on deep tech, manufacturing independence, and digital payment adoption, highlighting China's plans for 5G and 6G networks.
China, technology, 5G, digital payments, manufacturing independence
false
Technology and Digital Transformation
Technology & Software technology-and-software
Mixed Chart
Deloitte
View slide
Slide uses icons, arrows, and column charts to visualize the growth in Chinese spending on luxury goods from 2015 to 2018, both locally and abroad.
Financial Performance
Retail & E-commerce
Discusses the significant impact of local and international spending by Chinese consumers on the luxury goods market over three years, highlighting the doubling of local spending.
Chinese Market, Spending Growth, Local, International
false
Financial Performance
Retail & E-commerce retail-and-e-commerce
Mixed Chart
Bain
View slide
Contains column charts showing the role of Chinese OEMs in BEV production and their market share in the global top 100 suppliers. Includes text highlighting the professionalization and expansion of Chinese automotive suppliers.
Market Analysis and Trends
Transportation & Logistics
Discusses the growing influence of Chinese OEMs in the global automotive market, especially in BEV production. Analyzes the market share and strategic positioning of Chinese suppliers in the global top 100 suppliers.
Chinese OEMs, Market Dynamics, Automotive, BEV, Suppliers
false
Market Analysis and Trends
Transportation & Logistics transportation-and-logistics
Multiple Chart
Roland Berger
Previous
Loading...
Hold On!
We are searching in our database
If nothing, comes up, please try different filters!
Column Chart
Heatmap
Chevron
Org Chart
Infographic
Callouts
Timeline
List
Graphic
Picture
Process Flow
Diagram
Paragraph
Map
Table
Framework
Subtitle
Takeaway Box
Icon
Other Chart
Radar Chart
Waterfall Chart
Mekko Chart
Pie Chart
Scatter Plot
Line Chart
Bar chart
Bullet points
Create a FREE account to continue browsing
Receive Instant Access to 1,000+ slides from companies like McKinsey, Google, and Goldman Sachs
First Name
Last Name
Email
Password
I agree to all
Terms & Privacy Policy
Thank you! Your submission has been received!
Oops! Something went wrong while submitting the form.
Have an account?
Sign in
Upgrade to PRO to Save slides
Advanced Search and Filters
Access to 15,000+ slides
Access to Category Pages
Save/Bookmark Slides
PowerPoint Template Library
Pick a Plan
MONTHLY
$12/month
Billed every month, Cancel anytime.
YEARLY
$9/year
Billed $108 annually, Cancel anytime.
Checkout for $12/month
Checkout for $108/yr
Secured by Stripe | AES-256 bit encryption