My Account
My Slides
Search by Category
Templates
View All Templates
Download Template Slides
Leave Feedback
Login
Logout
Get Started
Browse all Slides
Browse all Slides
Create a FREE Account
Instant access to 1,000+ real slides from top companies like McKinsey, BCG, Goldman Sachs, Google and many more!
First Name
Last Name
Email
Password
I agree to all
Terms & Privacy Policy
Thank you! Your submission has been received!
Oops! Something went wrong while submitting the form.
Have an account?
Sign in
Spark Your Next Big Idea with New Presentation Templates
VIEW ALL Templates
Welcome,
Welcome
PRO
Show Featured Only
Checkbox 8
Companies
Mckinsey
Bain
BCG
EY
Deloitte
Accenture
PwC/Strategy&
JP Morgan
Goldman Sachs
Morgan Stanley
Citigroup
Deutsche Bank
Barclays
LEK
KPMG
Kearney
Oliver Wyman
Booz Allen Hamilton
Gartner
IPSOS
Nielsen
Slide type
Text Only
Linear Flow
Vertical Flow
Single Chart
Header Horizontal
Mixed Chart
Header Vertical
Pillar
Multiple Chart
Graphic
Agenda
Title
Table
Framework
Industry
Technology & Software
Artificial Intelligence
Financial Services
Retail & E-commerce
Consumer Goods
Industrial & Manufacturing
Transportation & Logistics
Telecommunications
Real Estate & Construction
Hospitality & Tourism
Professional Services
Education & Training
Media & Entertainment
Agriculture & Food Production
Healthcare & Pharmaceuticals
Environmental Services & Sustainability
Government & Public Sector
Use Case
Mergers and Acquisitions
Performance Metrics and KPIs
Client Case Studies
Competitive Landscape
Corporate Finance and Valuation
Product and Service Analysis
Customer and Market Segmentation
Organizational Structure and Change
Industry Overview
Regulatory and Compliance
Risk Assessment and Management
Investment Analysis
Organizational Structure and Change
Human Resources and Talent Management
Financial Performance
Market Analysis and Trends
Sales and Business Development
Human Resources and Talent Management
Clear all
Thank you! Your submission has been received!
Oops! Something went wrong while submitting the form.
Tag
View slide
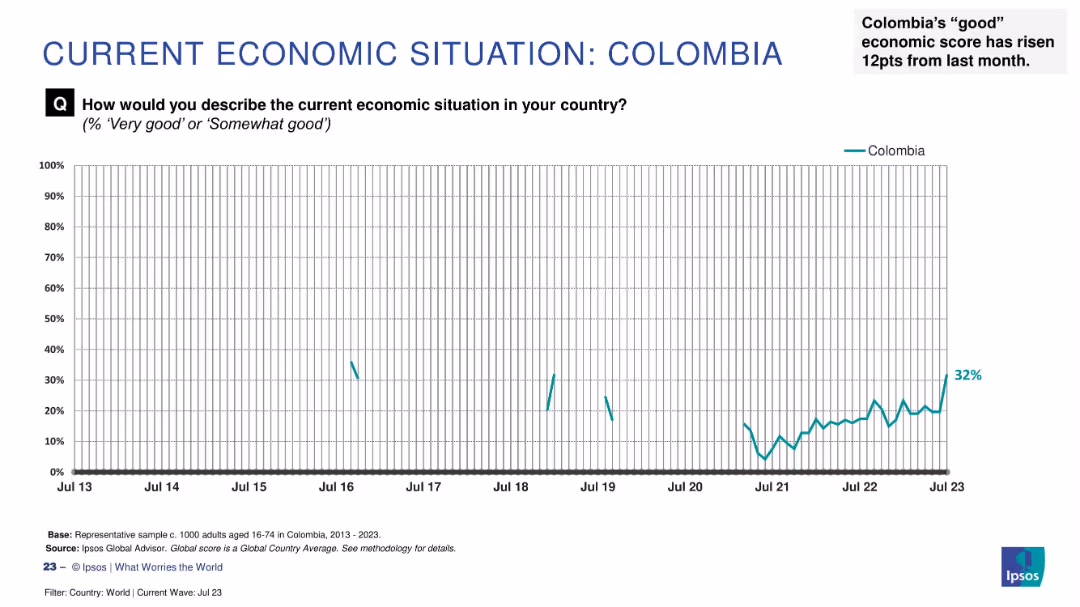
Line graph showing sentiment trend from 2013 to July 2023, marked with latest score (32%) and key annotation.
Market Analysis and Trends
Financial Services
The slide tracks public perception of Colombia’s economic situation over a decade, emphasizing a sharp 12-point rise in July 2023, the most significant increase across surveyed countries that month.
Colombia, economic perception, Ipsos, trend analysis, public sentiment, 2023 data, line chart, economic optimism, monthly change, economic outlook
false
Market Analysis and Trends
Financial Services financial-services
Single Chart
IPSOS
View slide
The slide features three charts: one column chart for real GDP, and two line charts for consumption and investment, and international trade data.
Market Analysis and Trends
Financial Services
This slide offers a snapshot of Colombia's economy, covering real GDP growth, consumption and investment patterns, and international trade statistics as of 4Q23.
Colombia, economic snapshot, GDP, consumption, investment, trade
false
Market Analysis and Trends
Financial Services financial-services
Multiple Chart
JP Morgan
View slide
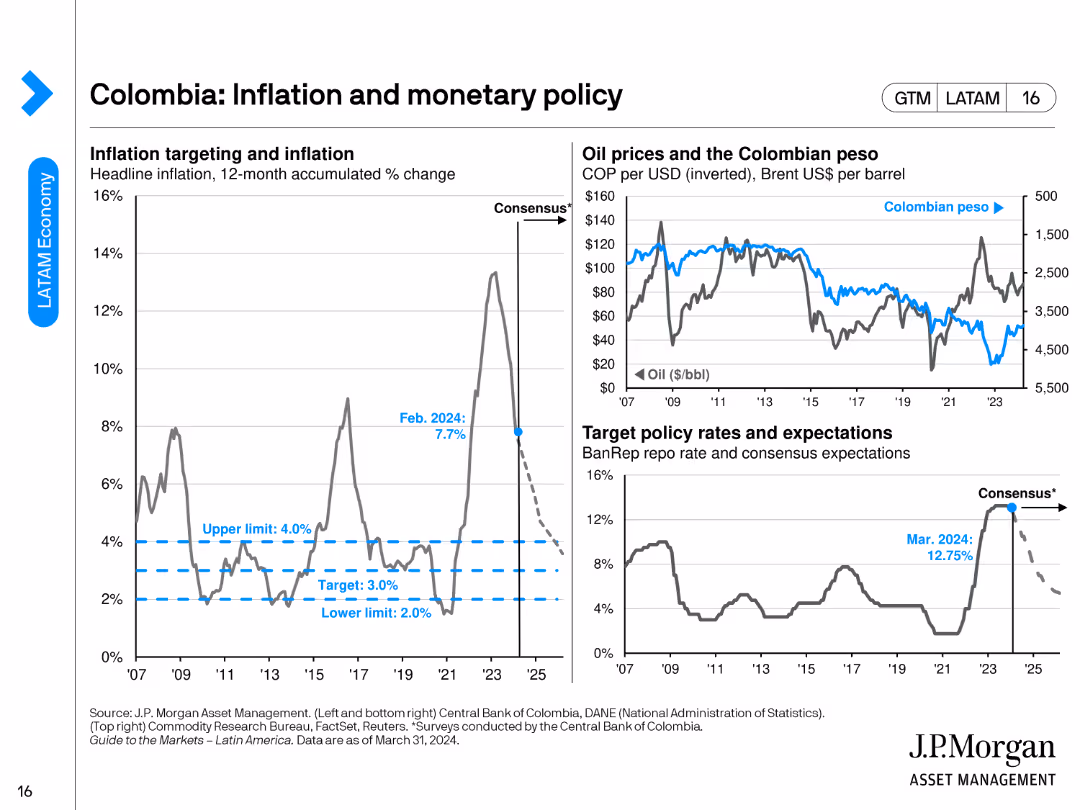
The slide includes three charts: a line chart for inflation targeting, another for oil prices vs. the Colombian peso, and a chart for target policy rates.
Regulatory and Compliance
Financial Services
This slide discusses Colombia's inflation and monetary policy, highlighting inflation targeting, oil prices, and target policy rates as of February 2024.
Colombia, inflation, monetary policy, oil prices, policy rates
false
Regulatory and Compliance
Financial Services financial-services
Multiple Chart
JP Morgan
View slide
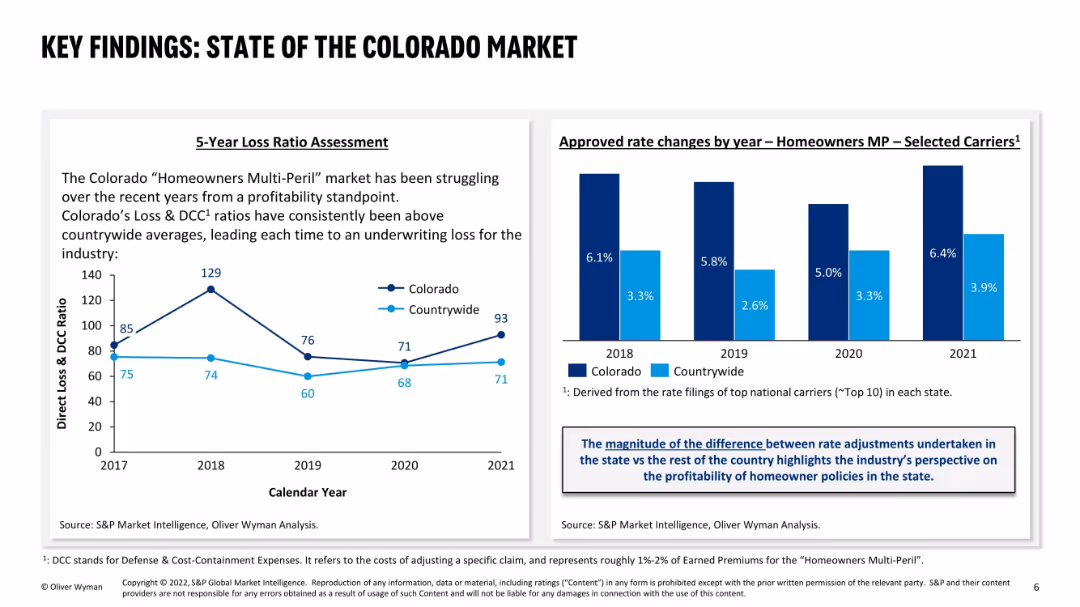
Two-column layout: left side has a 5-year loss ratio line graph; right side has a bar graph of approved rate changes; uses dark and light blue for comparison between Colorado and countrywide; includes explanatory text boxes.
Market Analysis and Trends
Financial Services
This slide evaluates Colorado’s “Homeowners Multi-Peril” insurance market, revealing persistent underwriting losses due to higher loss ratios compared to national averages. It also shows a consistent trend of higher rate increases in Colorado, reflecting industry efforts to offset losses.
Colorado market, loss ratio, homeowners insurance, rate changes, underwriting loss, profitability, MP, state comparison, DCC, carrier performance
false
Market Analysis and Trends
Financial Services financial-services
Multiple Chart
Oliver Wyman
View slide
Map-focused slide with minimal text, showing wildfire risk areas overlaid on a geographic map of Colorado. Emphasis on populated corridors.
Risk Assessment and Management
Environmental Services & Sustainability
Displays the eastern wildfire risk band in Colorado, emphasizing how close it runs to densely populated areas such as Denver and Colorado Springs. This visual highlights the spatial risk proximity between wildfire-prone zones and urban populations.
Colorado, wildfire, risk map, population, Denver, Colorado Springs, GIS
false
Risk Assessment and Management
Environmental Services & Sustainability environmental-services-and-sustainability
Graphic
Oliver Wyman
View slide
The slide displays a combined pie chart and bar graph, accompanied by bullet points to the left that provide context and explain the visual data.
Market Analysis and Trends
Industrial & Manufacturing
Analyzes the overall economic contribution of Combat Air activities, including the Tempest programme, to the UK economy.
Combat Air, GVA, Economic Contribution, Tempest Programme, Pie Chart
false
Market Analysis and Trends
Industrial & Manufacturing industrial-and-manufacturing
Mixed Chart
PwC/Strategy&
View slide
The layout includes a title and two columns of text, one for economic contribution details and the other for graphic representation of the same. The design is streamlined, with clear differentiation between sections.
Financial Performance
Government & Public Sector
Provides a comprehensive breakdown of the economic contributions of the Tempest partners’ activities, focusing on job creation and GVA contributions, making it apt for discussions on economic strategies in defense and related financial planning.
Combat Air, Tempest, GVA, Jobs, Economic Strategy, Defense
false
Financial Performance
Government & Public Sector government-and-public-sector
Text Only
PwC/Strategy&
View slide
A diagrammatic slide with labeled tech clusters indicating their roles as Infrastructure, Enablers, and Applications. Uses a simple black and white scheme for a professional, analytical look.
Strategic Planning
Technology & Software
This slide demonstrates the exponential growth due to the combinatorial effects of technology across industries. It helps in understanding how the convergence of various tech advancements enables new business models and innovation, making it essential for strategic discussions about technological investments and industry evolution.
Combinatorial Effects, Technology, Growth, Innovation, Business Models, Investment, Industry Evolution
false
Strategic Planning
Technology & Software technology-and-software
Framework
McKinsey
View slide
Images of mobile devices and graphs represent new client solutions like TravelBank and RTP. Text explains the benefits of each service.
Product and Service Analysis
Financial Services
Discusses innovative solutions offered to commercial clients, focusing on tech-driven management and real-time payments, targeting underrepresented markets and large corporations.
Commercial Clients, TravelBank, RTP
false
Product and Service Analysis
Financial Services financial-services
Mixed Chart
Goldman Sachs
View slide
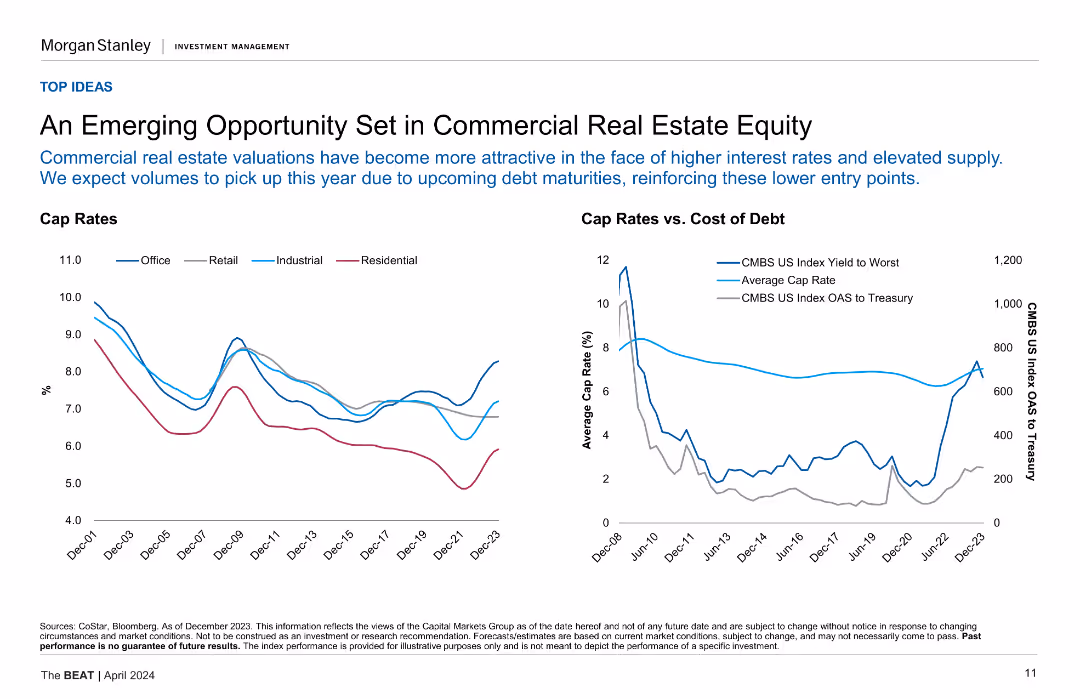
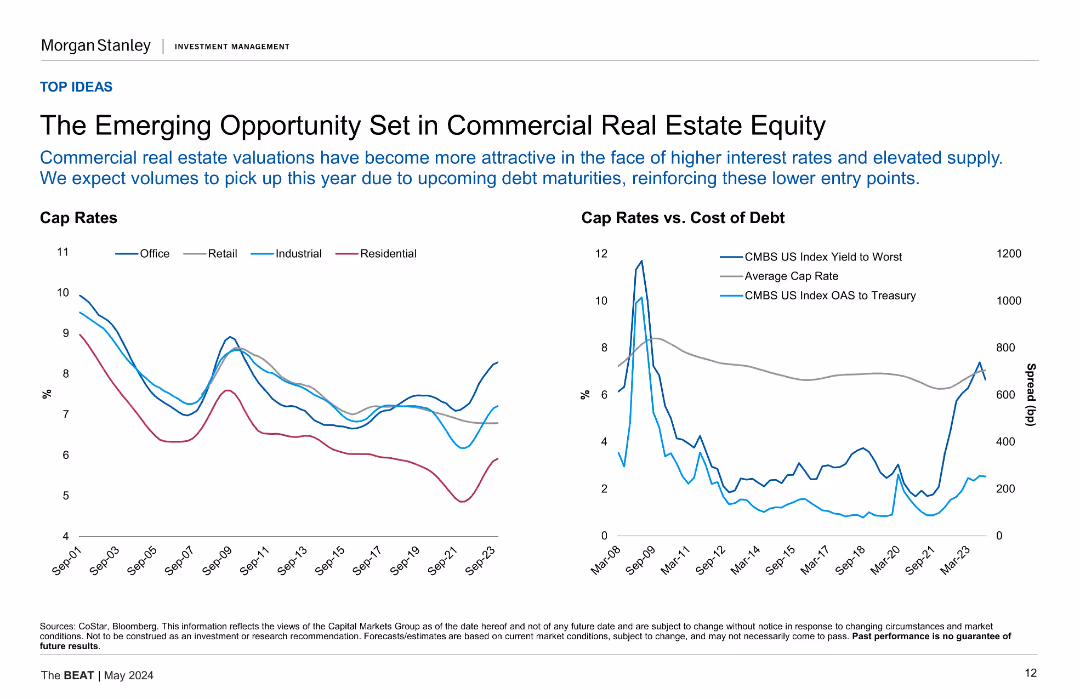
Two line charts showing cap rates for different property types and cap rates vs. cost of debt.
Market Analysis and Trends
Real Estate & Construction
This slide explores the opportunities in commercial real estate equity, highlighting the relationship between cap rates and the cost of debt across various sectors.
Commercial Real Estate, Cap Rates, Cost of Debt, Market Analysis, Opportunities
false
Market Analysis and Trends
Real Estate & Construction real-estate-and-construction
Multiple Chart
Morgan Stanley
View slide
Shows two line charts. The left chart compares cap rates across different property types from September 2001 to September 2023. The right chart shows cap rates versus cost of debt for the same period.
Market Analysis and Trends
Real Estate & Construction
The slide highlights the attractiveness of commercial real estate equity due to higher interest rates and upcoming debt maturities, suggesting increased volumes in the coming year.
Commercial Real Estate, Cap Rates, Debt, Interest Rates, Market Opportunity, Real Estate Investment
false
Market Analysis and Trends
Real Estate & Construction real-estate-and-construction
Multiple Chart
Morgan Stanley
View slide
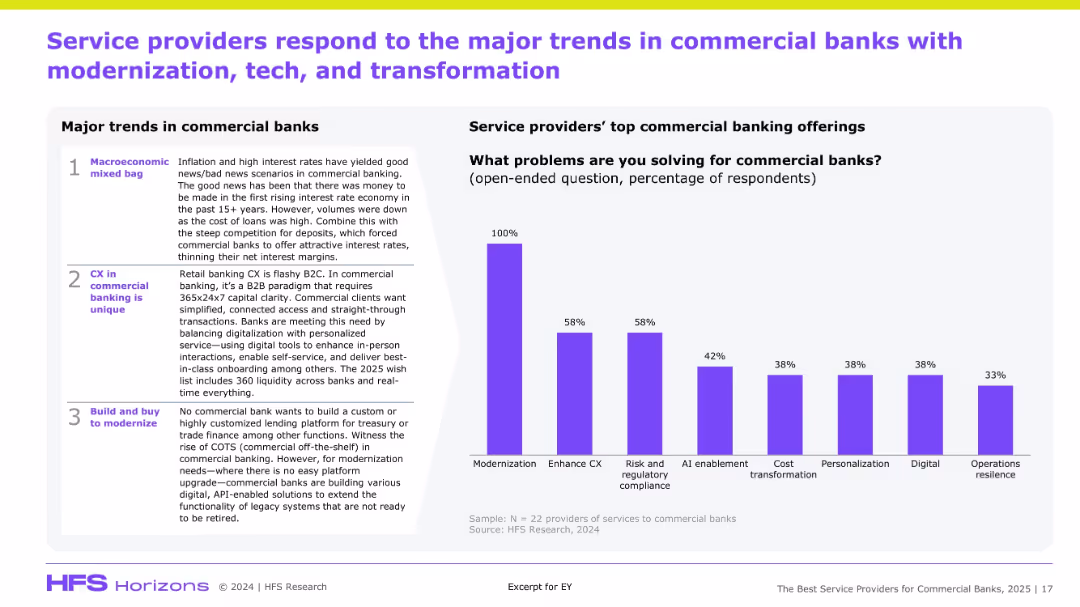
Two-column layout: left has major trends, right has a bar chart of service offerings; clean structured design with clear sectioning.
Market Analysis and Trends
Financial Services
This slide highlights the key commercial banking trends—macroeconomic conditions, unique CX needs, and modernization demands. The right-hand chart displays what banks expect from service providers, with modernization, CX enhancement, and regulatory compliance topping the list. The goal is to map demand signals from banks to vendor capabilities.
Commercial banks, modernization, CX, AI, compliance, vendor services
false
Market Analysis and Trends
Financial Services financial-services
Mixed Chart
Accenture
View slide
Integrates pie charts and text blocks. Blue and grey tones highlight different regions and sectors in real estate.
Risk Assessment and Management
Real Estate & Construction
Offers an analysis of non-recourse loans and exposure in CRE by region and sector, highlighting financial risks and market conditions.
Commercial real estate, loans, stress test, market analysis, risk assessment, regions, sectors
false
Risk Assessment and Management
Real Estate & Construction real-estate-and-construction
Multiple Chart
Deutsche Bank
View slide
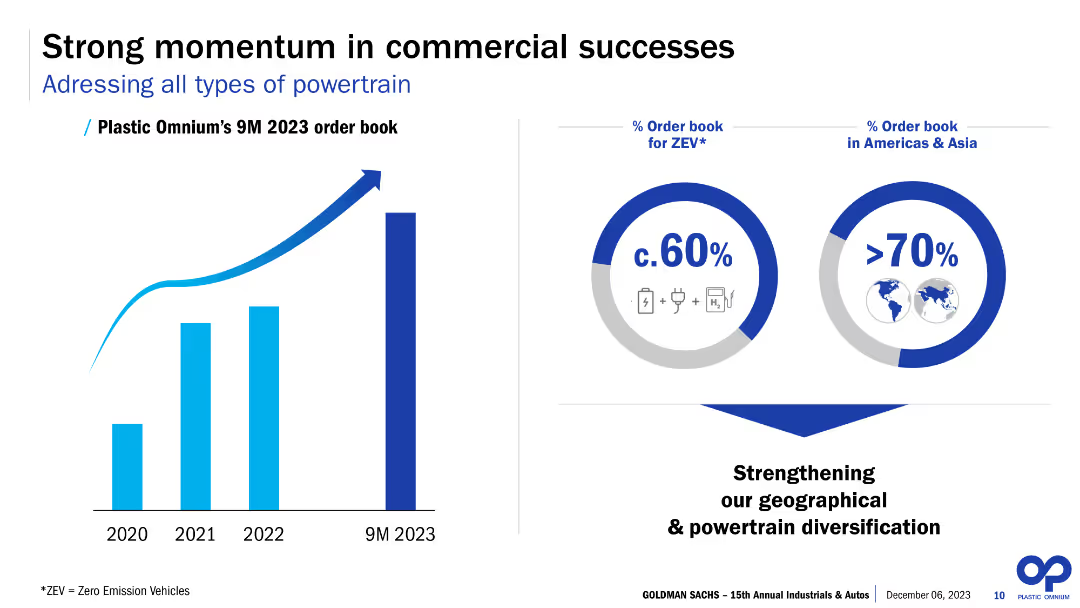
The slide features a column chart showing the 9-month order book from 2020 to 2023, with additional infographics showing percentages of the order book for Zero Emission Vehicles (ZEV) and regional distribution in Americas and Asia.
Market Analysis and Trends
Industrial & Manufacturing
The slide highlights the commercial success and strong momentum in the order book for 2023, with a significant portion dedicated to Zero Emission Vehicles. It emphasizes geographical and powertrain diversification, reflecting on the company’s strategic focus on sustainable and diversified growth.
Commercial success, ZEV, order book, regional distribution, Americas, Asia, powertrain, diversification, market momentum, sustainable growth
false
Market Analysis and Trends
Industrial & Manufacturing industrial-and-manufacturing
Multiple Chart
Goldman Sachs
View slide
The slide contains two charts. The left line chart shows U.S. goods imports by location. The right bar chart displays company plans to relocate out of China.
Competitive Landscape
Transportation & Logistics
This slide examines the commercial relationship between the U.S. and China, focusing on import locations and companies' relocation plans.
Commercial, U.S., China, Imports, Relocation
false
Competitive Landscape
Transportation & Logistics transportation-and-logistics
Multiple Chart
JP Morgan
View slide
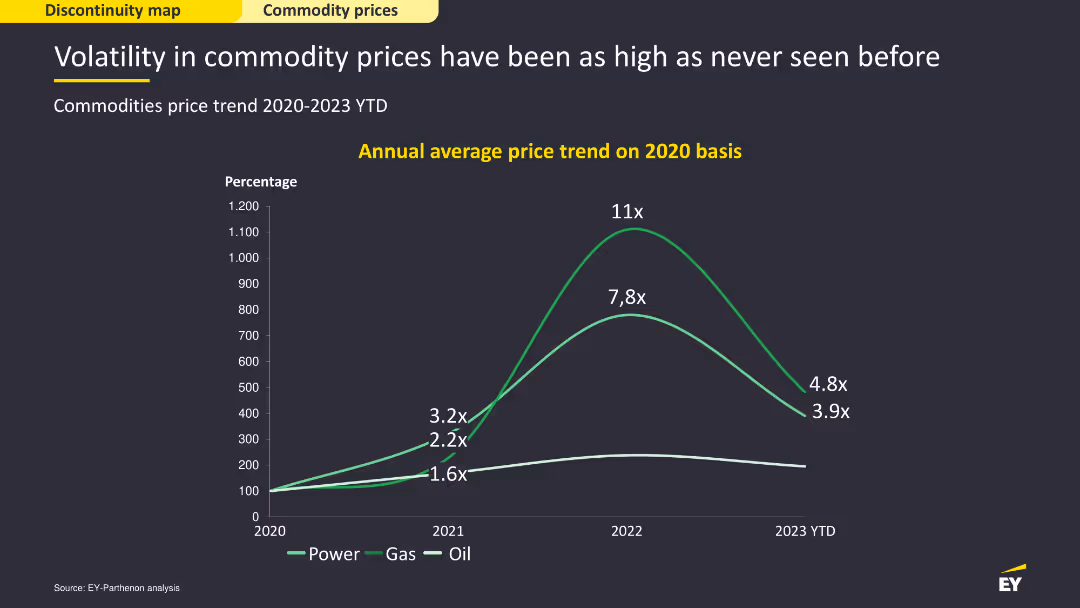
Line chart showing annual average price trends for power, gas, and oil on a 2020 basis from 2020-2023 YTD. Moderate complexity, effectively visualizing commodity price volatility over the years.
Market Analysis and Trends
Financial Services
This slide analyzes the volatility in commodity prices, particularly in power, gas, and oil. It discusses the trends in average prices from 2020 to 2023 YTD, highlighting the significant fluctuations in commodity markets.
Commodity prices, power, gas, oil, volatility
false
Market Analysis and Trends
Financial Services financial-services
Single Chart
EY
View slide
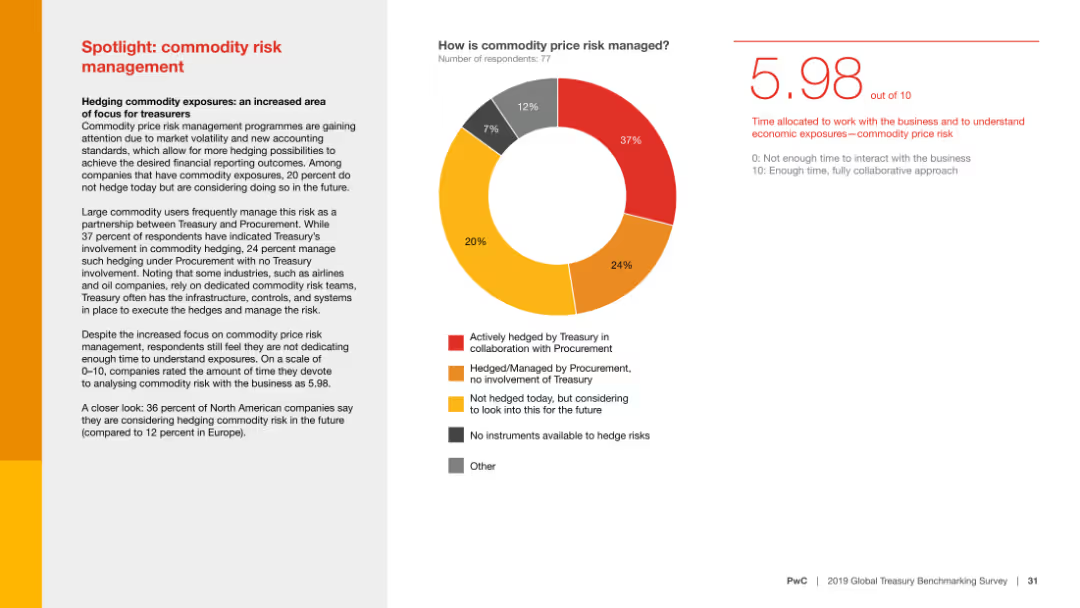
The slide features a pie chart depicting how commodity price risk is managed, accompanied by text discussing the importance of hedging commodity exposures and the level of involvement of Treasury in this process.
Risk Assessment and Management
Financial Services
This slide highlights the focus on commodity price risk management, showing how organizations manage these risks and the Treasury's role in this process, stressing the need for better risk understanding.
Commodity risk, risk management, Treasury, hedging, financial services, commodity exposures, procurement, risk understanding, survey, financial trends
false
Risk Assessment and Management
Financial Services financial-services
Mixed Chart
PwC/Strategy&
View slide
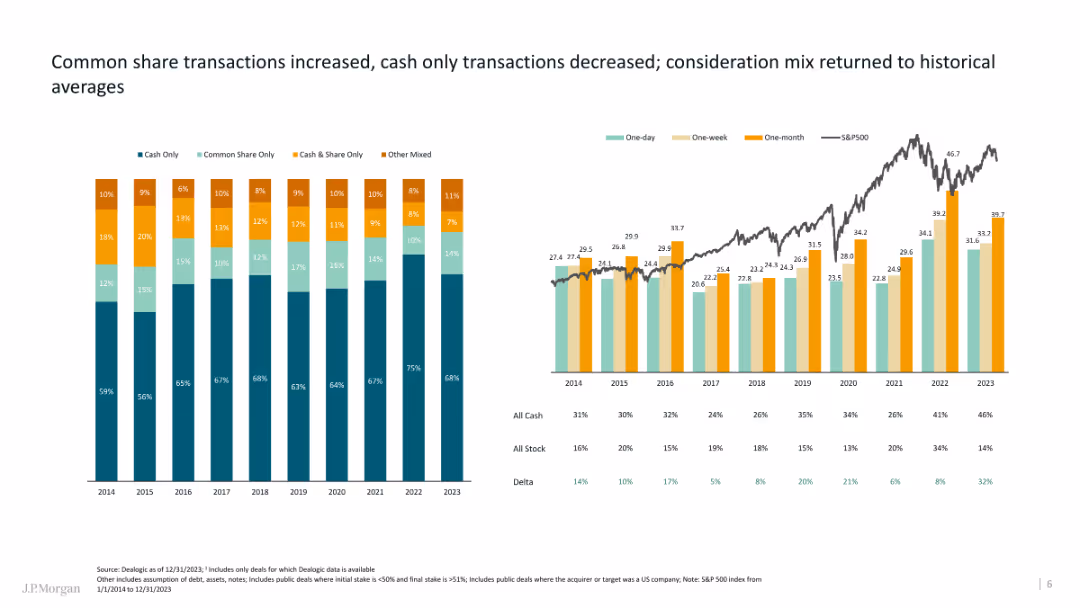
The slide features a series of column charts displaying data on transaction types over time and performance metrics.
Financial Performance
Financial Services
The slide details the trends in common share transactions versus cash transactions, highlighting historical averages.
Common share, transactions, column charts, historical data, trends
false
Financial Performance
Financial Services financial-services
Multiple Chart
JP Morgan
View slide
The slide features a column chart displaying council members' responses regarding the impact of communication during acquisitions. There is an image of a high-rise building on the right.
Mergers and Acquisitions
Professional Services
Discusses the role of communication in various phases of acquisition: pre-acquisition scoping, execution, and integration.
Communication, Acquisition, Integration, Strategy, Professional Services
false
Mergers and Acquisitions
Professional Services professional-services
Mixed Chart
IPSOS
View slide
The slide presents a two-column text format with a small section in the lower right corner depicting a U.S. map with colored dots indicating branch locations. The colors correspond to a legend identifying various cities. The layout is well-organized and easy to follow.
Financial Performance
Financial Services
Highlights the expansion of community centers and the role of Community Managers. It discusses trust-building with clients and providing financial education, with a focus on minority communities. The map shows branch locations across the U.S.
Community Banking, Financial Education, Branch Expansion, Trust-Building, Minority Communities, U.S. Map, Community Managers
false
Financial Performance
Financial Services financial-services
Boxed
JP Morgan
View slide
Photos of branch interiors and community engagement. Data boxes outline community strategy and roles.
Strategic Planning
Financial Services
Bank's approach to community engagement through tailored branch formats and local strategy implementation.
Community Engagement, Branch Evolution, Tailoring Execution, Local Strategy, Financial Services
false
Strategic Planning
Financial Services financial-services
Table
JP Morgan
View slide
Features column charts and statistics on community engagement, volunteer hours, and the impact of community hubs on quality of life.
Operational Efficiency
Government & Public Sector
Assesses the impact of community hubs on participant engagement and quality of life improvements, detailing volunteer contributions and personal benefits.
Community hubs, engagement, quality of life, volunteer hours, personal benefits
false
Operational Efficiency
Government & Public Sector government-and-public-sector
Multiple Chart
Deloitte
View slide
Includes bar charts showing commute times and primary work locations. Key findings are provided in bullet points.
Market Analysis and Trends
Professional Services
Analyzes how office attributes like commute time and primary work location influence employee preferences, including tenure at the current company.
Commute time, Work location, Employee preferences, Tenure, Office attributes
false
Market Analysis and Trends
Professional Services professional-services
Multiple Chart
EY
View slide
Contains text with icons and a circular diagram, using a green and white color scheme. The layout is well-structured and clear.
Organizational Structure and Change
Professional Services
Highlights the importance of personnel in driving the company's evolution, suitable for discussions on company culture and human resources.
Company Culture, Organic Growth, Accountability, Integrity
false
Organizational Structure and Change
Professional Services professional-services
Mixed Chart
Morgan Stanley
View slide
Bar chart showing company priorities for 2019, focusing on areas such as product portfolio, production, controlling & finance, sales & marketing, and procurement.
Strategic Planning
Financial Services
The slide outlines the top priorities for companies in 2019, with a significant focus on the product portfolio. It highlights the growing importance of controlling and finance activities, alongside other strategic areas like production, sales, and marketing, reflecting the key areas where businesses plan to concentrate their efforts.
Company Priorities, Product Portfolio, Strategic Planning
false
Strategic Planning
Financial Services financial-services
Multiple Chart
Roland Berger
View slide
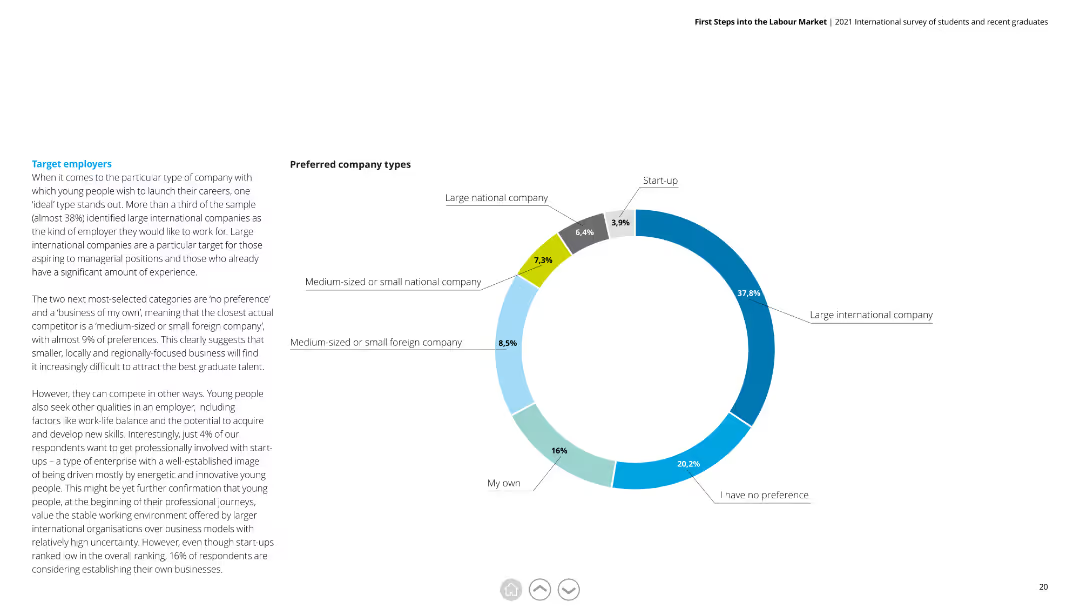
A pie chart showing preferred company types among respondents, with segments labeled for clarity.
Market Analysis and Trends
Professional Services
Displays respondent preferences for company types, including large international companies and medium-sized national companies.
Company Types, Preferences, Large International, Medium-Sized, National, Respondents
false
Market Analysis and Trends
Professional Services professional-services
Mixed Chart
Deloitte
View slide
Combination of text, percentage circles, and visual comparisons highlighting differences in optimism about company culture between employees and employers post-pandemic.
Human Resources and Talent Management
Professional Services
This slide examines the impact of the pandemic on company culture, showing increased employee optimism versus declining employer optimism, and significant staff turnover.
Company culture, pandemic impact, employee optimism, employer pessimism, staff turnover
false
Human Resources and Talent Management
Professional Services professional-services
Multiple Chart
EY
View slide
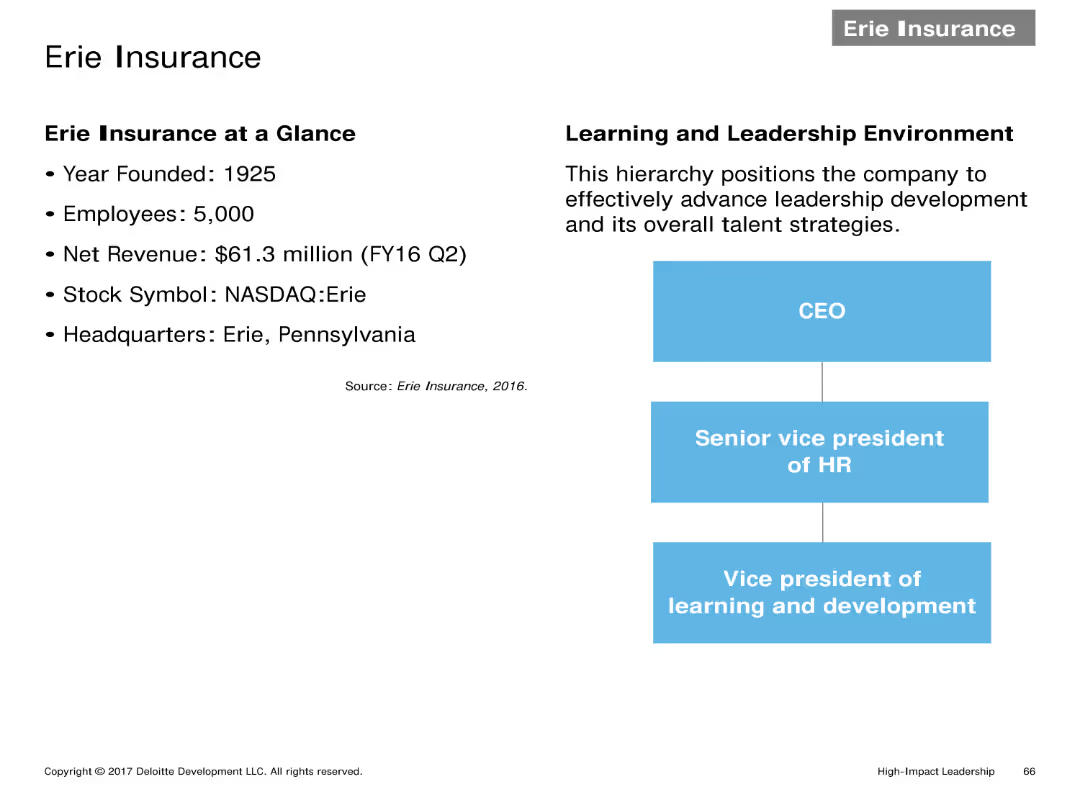
Two-column layout with company details on the left and a hierarchy chart on the right. Text details key information and organizational structure of Erie Insurance.
Client Case Studies
Financial Services
Provides an overview of Erie Insurance, including year founded, number of employees, net revenue, stock symbol, headquarters, and their learning and leadership environment.
Company overview, hierarchy, financial details, Erie Insurance, leadership environment
false
Client Case Studies
Financial Services financial-services
Header Horizontal
Deloitte
View slide
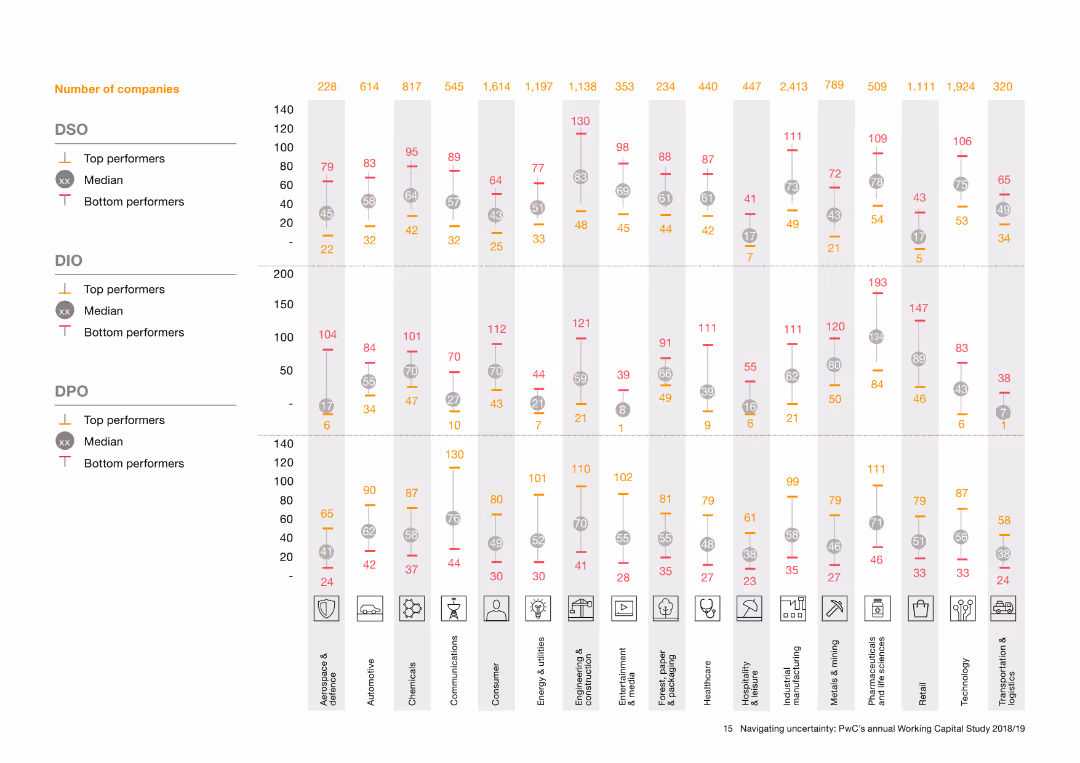
The slide displays a detailed table with the number of companies across various industries, divided into three performance categories: top performers, median, and bottom performers. Icons representing industries are shown at the bottom of the table, with performance metrics displayed above.
Market Analysis and Trends
Industrial & Manufacturing
This slide provides a comprehensive overview of the number of companies in different industries and their performance metrics. The table categorizes companies into top performers, median, and bottom performers, offering a detailed analysis of market trends and industry standings.
Company performance, industry analysis, top performers, median, bottom performers, market trends, data table
false
Market Analysis and Trends
Industrial & Manufacturing industrial-and-manufacturing
Multiple Chart
PwC/Strategy&
View slide
The slide presents a comparative table of various players in the market research industry, showing turnover and focus areas.
Competitive Landscape
Professional Services
The slide compares Ipsos with other market research companies, highlighting turnover figures and areas of specialization.
Comparative, Market Research, Turnover, Specialization, Ipsos
false
Competitive Landscape
Professional Services professional-services
Multiple Chart
IPSOS
Previous
Loading...
Hold On!
We are searching in our database
If nothing, comes up, please try different filters!
Column Chart
Heatmap
Chevron
Org Chart
Infographic
Callouts
Timeline
List
Graphic
Picture
Process Flow
Diagram
Paragraph
Map
Table
Framework
Subtitle
Takeaway Box
Icon
Other Chart
Radar Chart
Waterfall Chart
Mekko Chart
Pie Chart
Scatter Plot
Line Chart
Bar chart
Bullet points
Create a FREE account to continue browsing
Receive Instant Access to 1,000+ slides from companies like McKinsey, Google, and Goldman Sachs
First Name
Last Name
Email
Password
I agree to all
Terms & Privacy Policy
Thank you! Your submission has been received!
Oops! Something went wrong while submitting the form.
Have an account?
Sign in
Upgrade to PRO to Save slides
Advanced Search and Filters
Access to 15,000+ slides
Access to Category Pages
Save/Bookmark Slides
PowerPoint Template Library
Pick a Plan
MONTHLY
$12/month
Billed every month, Cancel anytime.
YEARLY
$9/year
Billed $108 annually, Cancel anytime.
Checkout for $12/month
Checkout for $108/yr
Secured by Stripe | AES-256 bit encryption