My Account
My Slides
Search by Category
Templates
View All Templates
Download Template Slides
Leave Feedback
Login
Logout
Get Started
Browse all Slides
Browse all Slides
Create a FREE Account
Instant access to 1,000+ real slides from top companies like McKinsey, BCG, Goldman Sachs, Google and many more!
First Name
Last Name
Email
Password
I agree to all
Terms & Privacy Policy
Thank you! Your submission has been received!
Oops! Something went wrong while submitting the form.
Have an account?
Sign in
Spark Your Next Big Idea with New Presentation Templates
VIEW ALL Templates
Welcome,
Welcome
PRO
Show Featured Only
Checkbox 8
Companies
Mckinsey
Bain
BCG
EY
Deloitte
Accenture
PwC/Strategy&
JP Morgan
Goldman Sachs
Morgan Stanley
Citigroup
Deutsche Bank
Barclays
LEK
KPMG
Kearney
Oliver Wyman
Booz Allen Hamilton
Gartner
IPSOS
Nielsen
Slide type
Text Only
Linear Flow
Vertical Flow
Single Chart
Header Horizontal
Mixed Chart
Header Vertical
Pillar
Multiple Chart
Graphic
Agenda
Title
Table
Framework
Industry
Technology & Software
Artificial Intelligence
Financial Services
Retail & E-commerce
Consumer Goods
Industrial & Manufacturing
Transportation & Logistics
Telecommunications
Real Estate & Construction
Hospitality & Tourism
Professional Services
Education & Training
Media & Entertainment
Agriculture & Food Production
Healthcare & Pharmaceuticals
Environmental Services & Sustainability
Government & Public Sector
Use Case
Mergers and Acquisitions
Performance Metrics and KPIs
Client Case Studies
Competitive Landscape
Corporate Finance and Valuation
Product and Service Analysis
Customer and Market Segmentation
Organizational Structure and Change
Industry Overview
Regulatory and Compliance
Risk Assessment and Management
Investment Analysis
Organizational Structure and Change
Human Resources and Talent Management
Financial Performance
Market Analysis and Trends
Sales and Business Development
Human Resources and Talent Management
Clear all
Thank you! Your submission has been received!
Oops! Something went wrong while submitting the form.
Tag
View slide
The slide features comparative visuals of traditional and edge cloud computing models. Graphical elements and color coding effectively delineate different computational approaches against a dark theme.
Technology and Digital Transformation
Technology & Software
The slide provides a clear and concise comparison between traditional cloud and edge computing. It highlights the benefits of edge computing in reducing data transmission delays and costs while offering a more relevant set of data for businesses to comply with data residency laws.
Cloud Computing, Edge Computing, Data Transmission
false
Technology and Digital Transformation
Technology & Software technology-and-software
Diagram
McKinsey
View slide
A scatter plot similar to the IT intensity slide, but focused on cloud intensity. It compares IT spending per employee and value-added per employee, with countries grouped and color-coded.
Market Analysis and Trends
Technology & Software
The slide evaluates cloud intensity by country, comparing IT spending on cloud services to the economic value added per employee, useful for understanding global cloud adoption.
Cloud Intensity, Country Analysis, Cloud Spending, Economic Value, International Comparison
false
Market Analysis and Trends
Technology & Software technology-and-software
Single Chart
Gartner
View slide
A slide with a blend of icons and text, displayed on a dark background. Icons represent financial opportunity, hybrid cloud strategy, market growth, and security concerns, underscoring the slide's strategic message to leaders.
Technology and Digital Transformation
Technology & Software
Aimed at business leaders, the slide articulates why cloud computing is a pivotal area of technology to consider, with implications for cost savings, market growth, and security. It underscores the strategic significance of cloud services and hybrid approaches in the technological advancement of organizations.
Cloud Strategy, Market Growth, Security Concerns
false
Technology and Digital Transformation
Technology & Software technology-and-software
Pillar
McKinsey
View slide
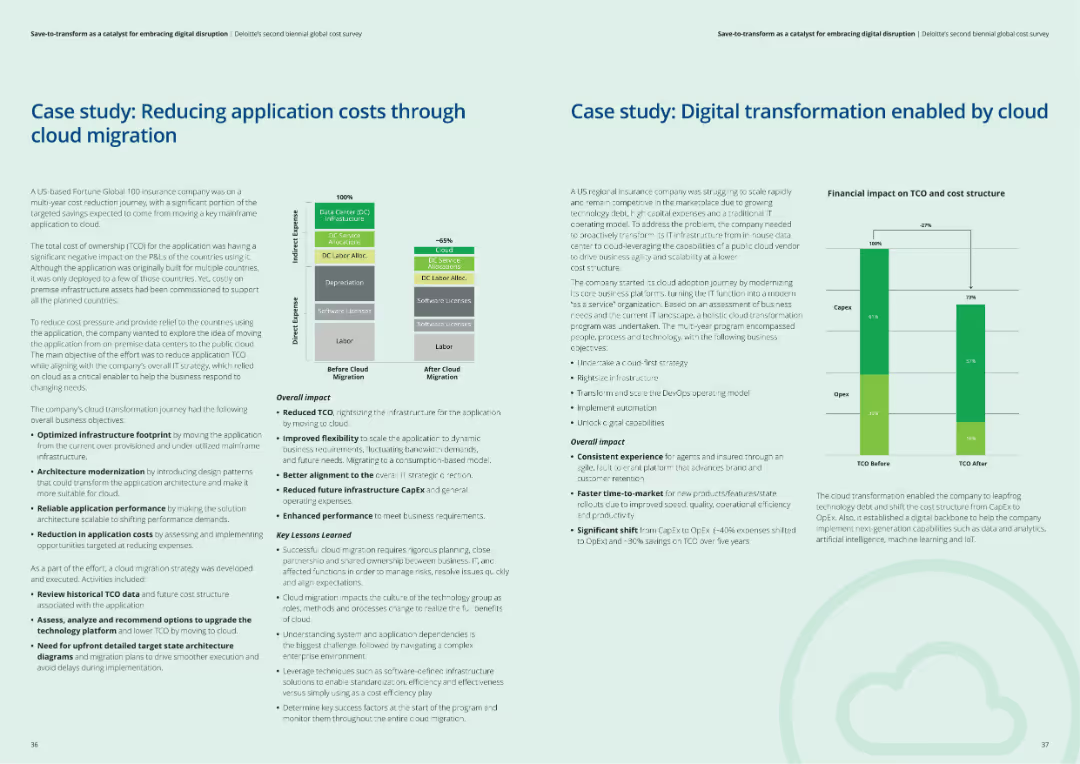
The slide includes two case studies, each with a structured layout showing context, challenges, actions taken, and results of cloud migration and digital transformation efforts.
Client Case Studies
Financial Services
The slide presents two case studies: one on reducing application costs through cloud migration and another on digital transformation enabled by cloud solutions, highlighting key lessons learned.
Cloud migration, digital transformation, case studies, client examples, financial services
false
Client Case Studies
Financial Services financial-services
Multiple Chart
Deloitte
View slide
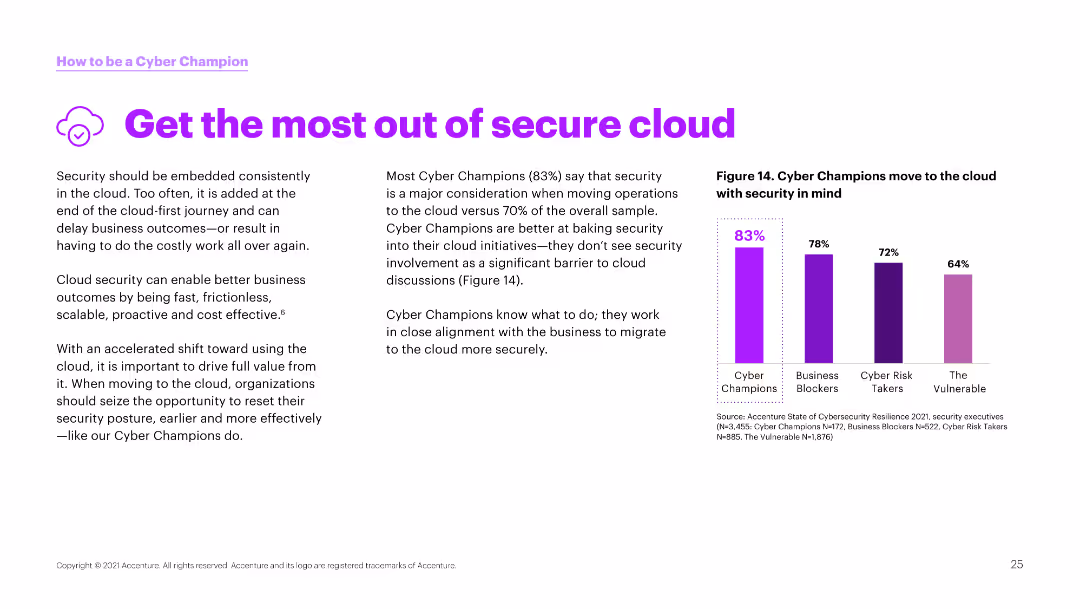
The slide has a white background with a column chart on the right side. The left side contains text discussing the importance of integrating security in cloud operations.
Technology and Digital Transformation
Technology & Software
This slide emphasizes the significance of embedding security in cloud operations for better business outcomes and the high percentage of cyber champions prioritizing cloud security.
Cloud security, business outcomes, cybersecurity, cloud operations, champions, integration, security, digital transformation, alignment
false
Technology and Digital Transformation
Technology & Software technology-and-software
Mixed Chart
Accenture
View slide
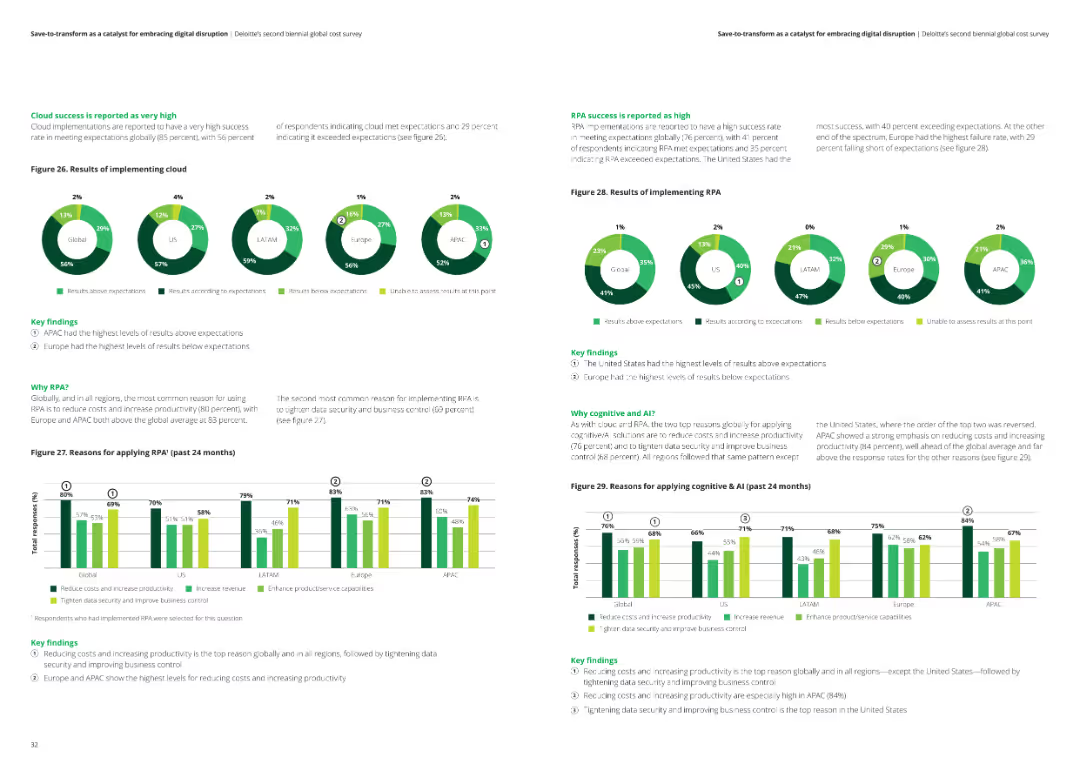
The slide includes two sets of pie charts and column charts showing the success of cloud and RPA implementations across various regions. Key findings are detailed in text boxes.
Technology and Digital Transformation
Financial Services
The slide reports on the success rates of cloud and RPA implementations, reasons for adopting these technologies, and their impact on reducing costs and increasing productivity.
Cloud success, RPA implementation, technology impact, analysis, financial services
false
Technology and Digital Transformation
Financial Services financial-services
Multiple Chart
Deloitte
View slide
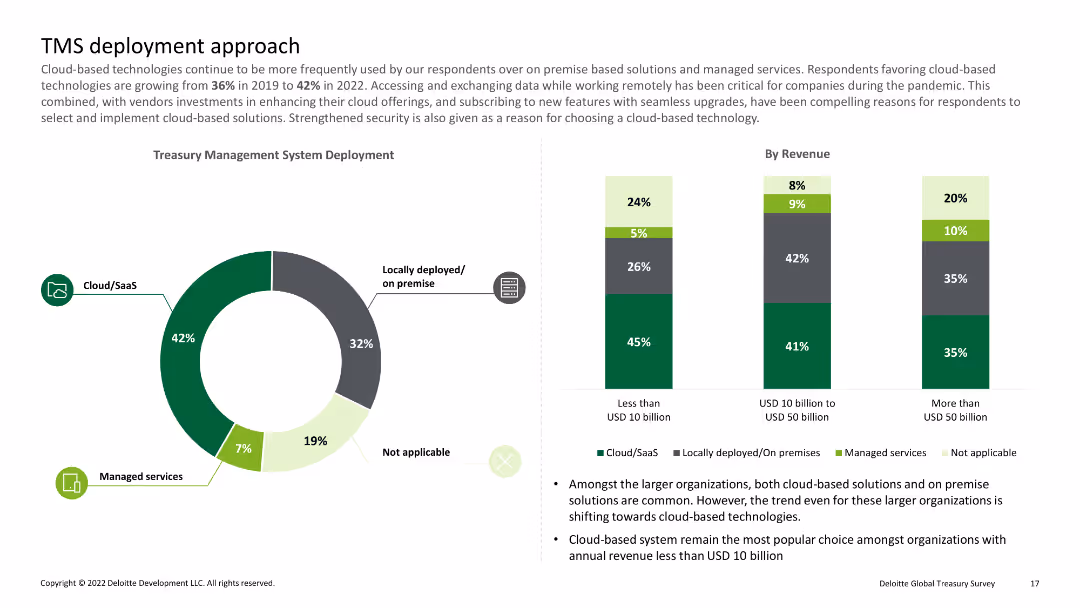
Pie chart showing percentages of cloud/SaaS, locally deployed, and managed services; bar charts detailing deployment by revenue
Technology and Digital Transformation
Financial Services
Discusses the shift towards cloud-based treasury management systems and their deployment among organizations of varying revenue sizes.
Cloud, SaaS, deployment, revenue, treasury
false
Technology and Digital Transformation
Financial Services financial-services
Multiple Chart
Deloitte
View slide
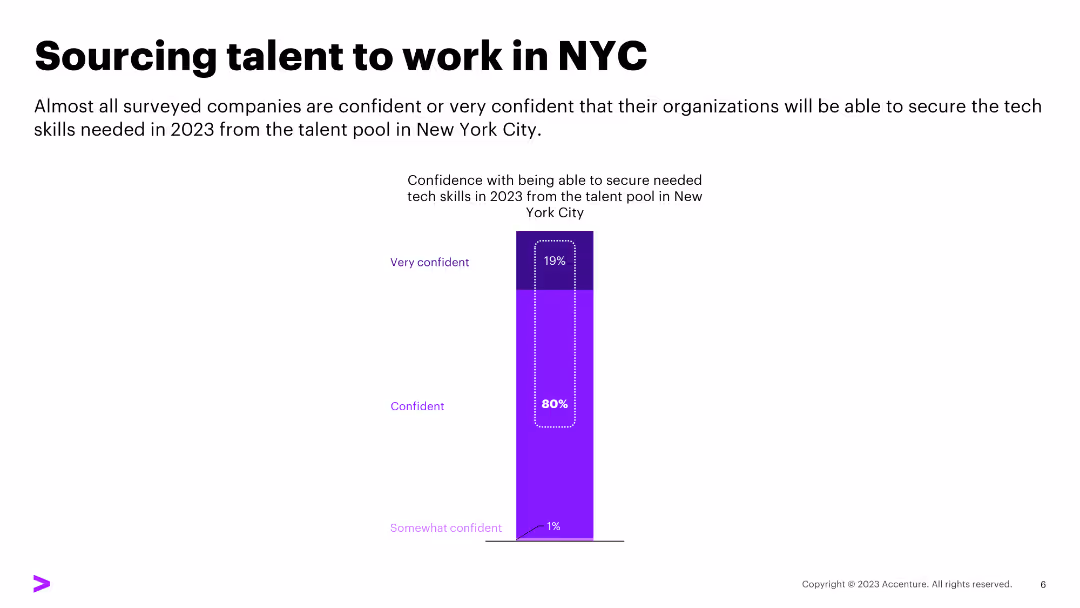
White background with multiple purple column charts comparing hiring priorities and difficulties
Human Resources and Talent Management
Technology & Software
It highlights the top skills in demand for tech talent, focusing on cloud, security, and AI skills
Cloud, Security, AI, Tech Skills, Hiring Priorities
false
Human Resources and Talent Management
Technology & Software technology-and-software
Single Chart
Accenture
View slide
Features a central donut chart labeled "Client 360°" with associated data types around it, and lists on the side for business value delivery, sales enablement, and operational excellence.
Technology and Digital Transformation
Technology & Software
Explains the business value of a cloud-based, data-driven platform.
Cloud, data, platform, business, risk, analytics, forecasting, operational, sales, engagement
false
Technology and Digital Transformation
Technology & Software technology-and-software
Framework
JP Morgan
View slide
Uses timelines and arrows to show progress and completion targets for tech platforms, with icons indicating platform benefits.
Technology and Digital Transformation
Technology & Software
Outlines the status and impact of J.P.Morgan's cloud-native tech platforms, showing expected completion dates and revenue generation.
Cloud-Native, Tech Platforms, Revenue, Development, J.P.Morgan, Real-Time Payments, Liquidity
false
Technology and Digital Transformation
Technology & Software technology-and-software
Mixed Chart
JP Morgan
View slide
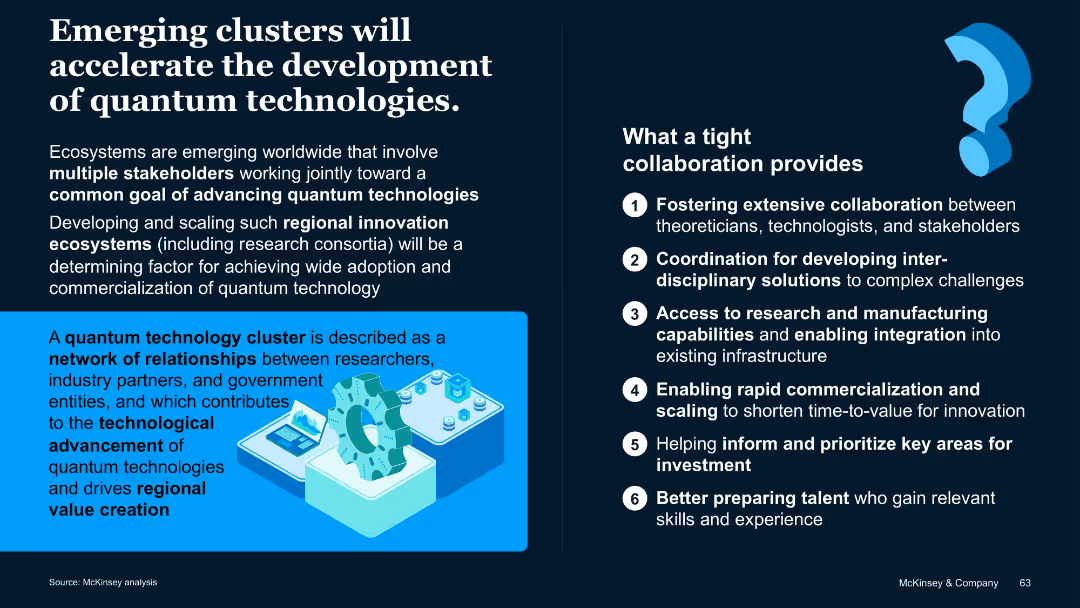
Two-column layout with bold subheadings; right column includes a numbered list; includes a blue-highlighted section with visuals.
Market Analysis and Trends
Artificial Intelligence
Highlights how regional innovation clusters support the advancement of quantum technologies through stakeholder collaboration. Describes the benefits of tight cooperation across disciplines and institutions.
Clusters, ecosystems, innovation, quantum technology, collaboration
false
Market Analysis and Trends
Artificial Intelligence artificial-intelligence
Boxed
McKinsey
View slide
Features a column chart displaying coastal shipping volumes for clinker and cement, along with a map highlighting major shipping routes in Australia.
Market Analysis and Trends
Transportation & Logistics
Analyzes the growth of coastal shipping for cement and clinker in Australia. Discusses the impact of cabotage costs and identifies key shipping routes and distribution centers.
Coastal shipping, cement, clinker, cabotage, Australia
false
Market Analysis and Trends
Transportation & Logistics transportation-and-logistics
Mixed Chart
LEK
View slide
This slide has a bright and bold aesthetic with a large title, multiple sections with headers, and bullet-pointed lists. It highlights strategies for implementing coding in education curricula worldwide, starting from early education through advanced modules. The design includes national flags as icons and color-coded sections for clarity. The slide is visually engaging and informative.
Regulatory and Compliance
Education & Training
The slide compares various global strategies for integrating technology skills into education systems. It outlines efforts to start coding education early, make it mandatory, and introduce advanced tech modules. It includes specific country examples, providing a comprehensive overview of the progressive steps taken to prepare the next generation for a digital future.
Coding Education, Curriculum, Global Strategies, Mandatory Coding, Advanced Tech, Italy, Singapore, India, International Education, Digital Skills
false
Regulatory and Compliance
Education & Training education-and-training
Header Horizontal
Kearney
View slide
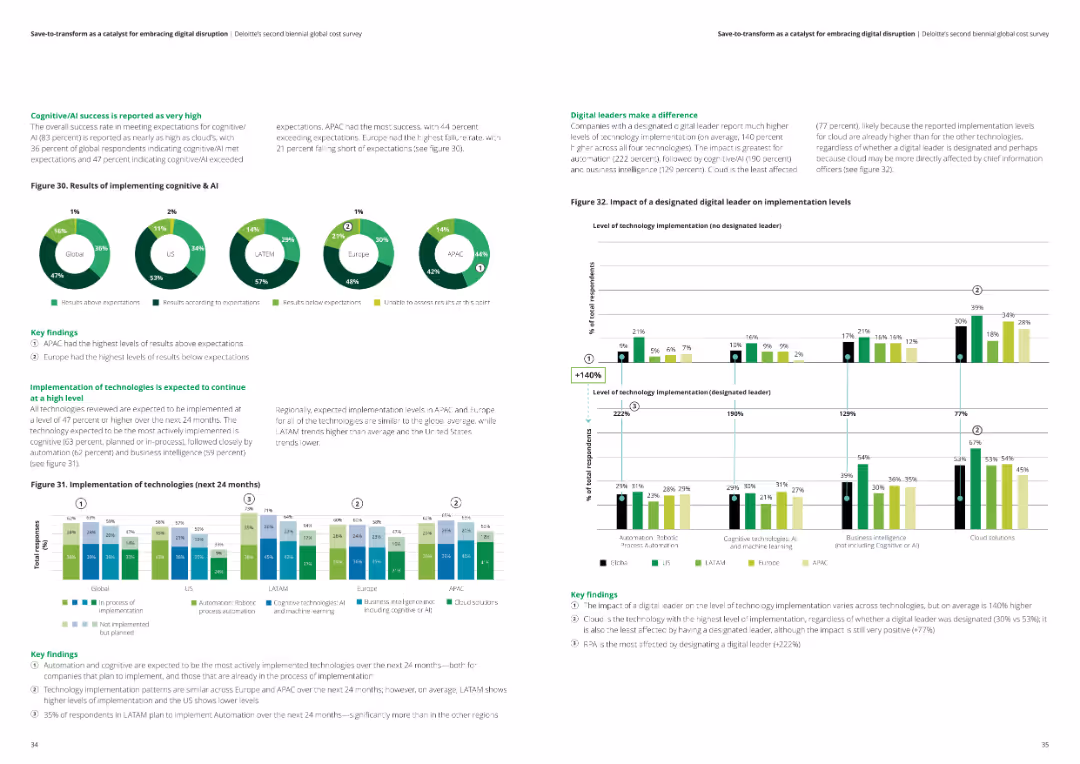
This slide presents pie charts and a column chart showing the success of cognitive/AI implementations and expected technology implementations over the next 24 months across regions.
Technology and Digital Transformation
Financial Services
The slide evaluates the success rates of cognitive/AI technologies and predicts the implementation trends of various technologies over the next 24 months in different regions.
Cognitive AI, technology implementation, success rates, analysis, financial services
false
Technology and Digital Transformation
Financial Services financial-services
Multiple Chart
Deloitte
View slide
The slide has a clean and structured design featuring multiple screenshots and text representations. It focuses on various phases of data processing and visualization through a service called CognitiveSpend, highlighted by distinct green color blocks.
Technology and Digital Transformation
Technology & Software
This slide presents a Google platform-based solution called CognitiveSpend, which classifies spend data and provides insights within two weeks. It shows data aggregation, dashboard examples, and actionable insights delivery through multiple visualizations, enhancing strategic spend management.
CognitiveSpend, Google Cloud, data classification, spend management, actionable insights
false
Technology and Digital Transformation
Technology & Software technology-and-software
Linear Flow
Deloitte
View slide
This slide compares cold storage capacities per 1000 urban residents in several countries using column charts, showing Nigeria's low capacity relative to others. It includes a statistic on the loss percentage due to inadequate storage.
Strategic Planning
Agriculture & Food Production
The slide exposes the critical gaps in cold storage infrastructure in Nigeria compared to other countries, linking these deficiencies to high food loss rates. It underscores the necessity for investing in enhanced cold storage solutions to support food security initiatives.
Cold Storage, Capacity, Nigeria, Challenges, Comparison
false
Strategic Planning
Agriculture & Food Production agriculture-and-food-production
Mixed Chart
BCG
View slide
This slide presents a dual bar chart comparing the daily costs of cold storage as a percentage of a farmer's income in Nigeria, India, and Rwanda, illustrating the significant financial strain on Nigerian farmers.
Strategic Planning
Agriculture & Food Production
This slide assesses the economic impact of cold storage costs on smallholder farmers in Nigeria, comparing it with other countries to highlight the disproportionate burden. It advocates for more affordable and accessible storage solutions to aid farmers and reduce food loss.
Cold Storage, Costs, Farmers, Nigeria, Comparative Analysis
false
Strategic Planning
Agriculture & Food Production agriculture-and-food-production
Multiple Chart
BCG
View slide
A vibrant, color-coded infographic slide details incentives offered by companies to promote office collaboration. It provides quantitative data on various programs through large percentage figures.
Organizational Structure and Change
Professional Services
This slide communicates the extent of strategies implemented to encourage employees to work on-site. It's likely intended for managers seeking to enhance office collaboration.
Collaboration Incentives, Office Work, Employee Programs, Quantitative Data, On-site Work
false
Organizational Structure and Change
Professional Services professional-services
Single Chart
EY
View slide
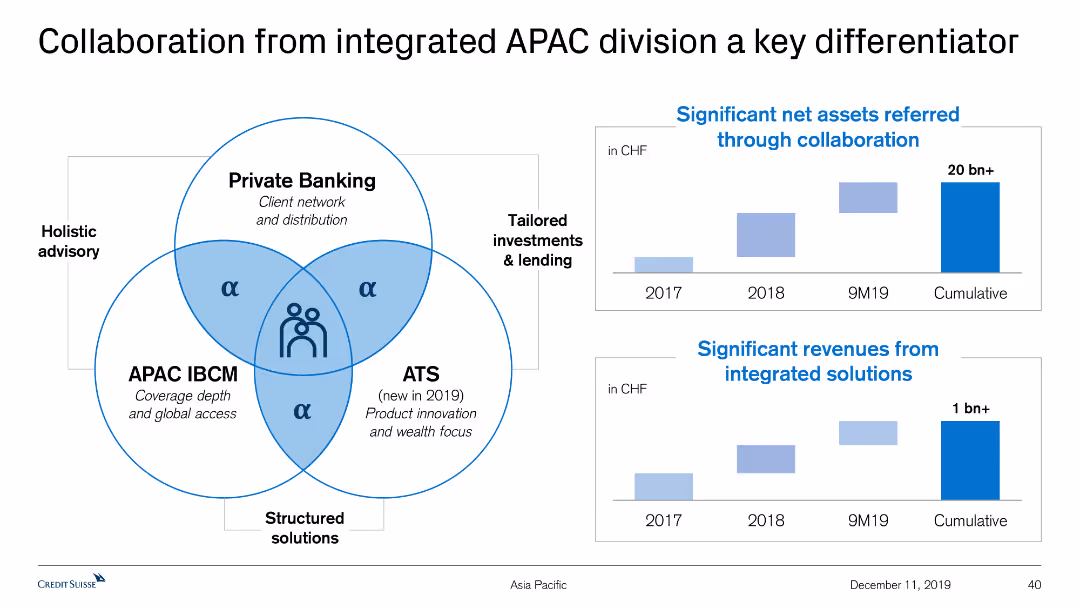
This slide features a Venn diagram illustrating the collaboration among Private Banking, APAC IBCM, and ATS. It also includes two column charts displaying net assets and revenues.
Strategic Planning
Financial Services
The slide explains the synergy between Private Banking, APAC IBCM, and ATS to deliver holistic advisory and tailored solutions, with significant assets and revenue growth data.
Collaboration, APAC, Private Banking, Revenue Growth, Net Assets
false
Strategic Planning
Financial Services financial-services
Multiple Chart
Credit Suisse
View slide
The slide features a mix of text on the left and a column chart on the right. The column chart illustrates different sectors and their plans to partner with creators.
Strategic Planning
Professional Services
The slide discusses the trend of creative collaboration beyond the traditional organization structure, highlighting sectors that are planning to partner more with creators, with a supporting column chart showing sector-wise data.
Collaboration, CMOs, sectors, creative partnerships, trend
false
Strategic Planning
Professional Services professional-services
Mixed Chart
Deloitte
View slide
Features an extensive flowchart diagram with different financial services offered by the firm, divided by client needs, and includes some numerical data points.
Organizational Structure and Change
Financial Services
Details the comprehensive offerings by the firm to support clients during IB transactions and the depth of relationships.
Collaboration, Franchise, Client Support, IB Transactions, Services Offering, Commercial Banking
false
Organizational Structure and Change
Financial Services financial-services
Table
JP Morgan
View slide
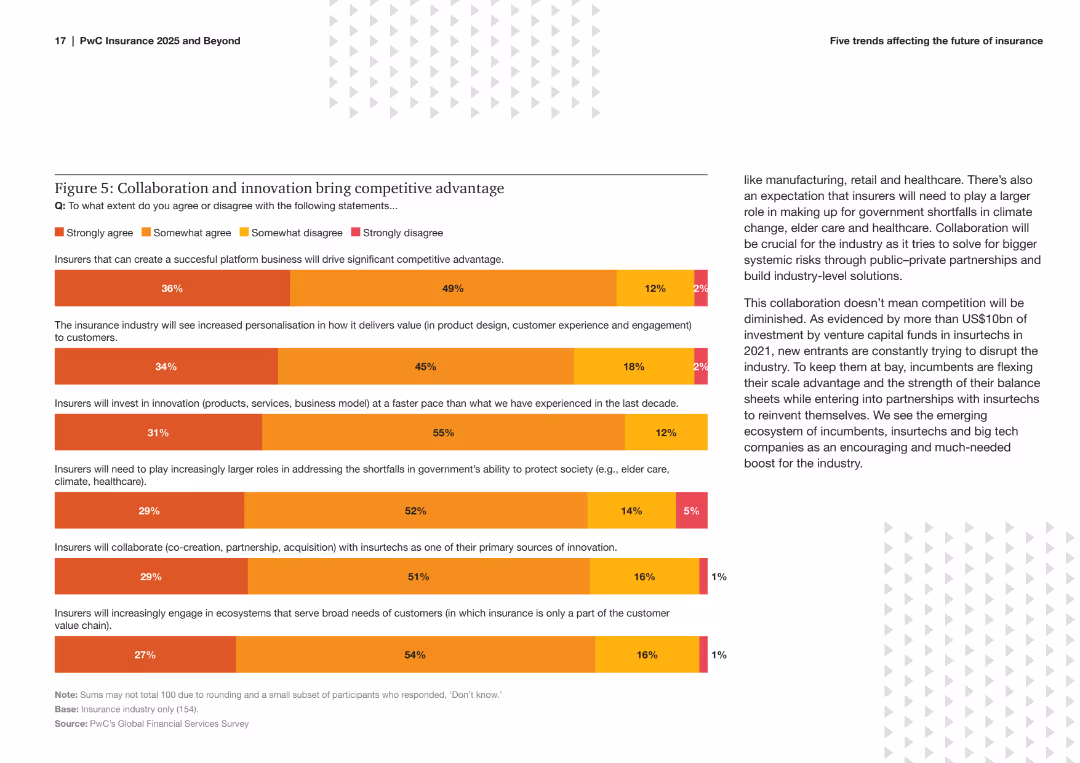
The slide includes a bar chart showing survey results on the extent to which insurers agree with statements about collaboration, innovation, and competitive advantage. It uses color coding to differentiate levels of agreement.
Strategic Planning
Financial Services
This slide highlights survey findings on the importance of collaboration and innovation in gaining competitive advantage within the insurance industry. It presents the percentage of respondents agreeing with various strategic statements.
Collaboration, Innovation, Competitive Advantage, Insurance, Survey, Strategic Planning, Bar Chart, Trends, Industry Insights, Analysis
false
Strategic Planning
Financial Services financial-services
Mixed Chart
PwC/Strategy&
View slide
The slide features a Venn diagram showing the relationship between Private Banking, APAC IBCM, and ATS, emphasizing global connectivity.
Strategic Planning
Professional Services
This slide outlines the collaborative approach central to the company's strategy, highlighting the synergy between Private Banking, APAC IBCM, and ATS, along with the emphasis on global connectivity.
Collaboration, Private Banking, APAC IBCM, ATS, Global Connectivity
false
Strategic Planning
Professional Services professional-services
Framework
Credit Suisse
View slide
Includes a column chart showing NNA generation since end-2015 and bullet points detailing collaboration highlights with Private Banking.
Strategic Planning
Financial Services
The slide emphasizes the importance of collaboration with Private Banking, showcasing significant asset generation and outlining strategic priorities for growth.
Collaboration, Private Banking, NNA, Asset Generation, Strategic Priorities
false
Strategic Planning
Financial Services financial-services
Mixed Chart
Credit Suisse
View slide
This slide features an image of people collaborating over a tablet on the right, with the rest of the slide divided into text sections. The layout is clean, with white text on a red background for the headings and black text for the body. The image is captioned, contributing to the overall narrative.
Regulatory and Compliance
Government & Public Sector
Discusses the collaborative investments in R&D for the Tempest program and its implications for technological development and defense, suitable for presentations on government-industry partnerships and investment strategies.
Collaboration, R&D, Defense Technology, Investment, Government-Industry Partnerships
false
Regulatory and Compliance
Government & Public Sector government-and-public-sector
Vertical Flow
PwC/Strategy&
View slide
The slide features icons and percentages indicating types of stakeholders companies are collaborating with, set against a green background.
Strategic Planning
Agriculture & Food Production
Discusses current collaborations in the food ecosystem, noting primary collaborations with suppliers and producers, followed by academia and government. Relevant for studies on ecosystem management.
Collaboration, Stakeholders, Suppliers, Producers, Ecosystem Management
false
Strategic Planning
Agriculture & Food Production agriculture-and-food-production
Multiple Chart
Deloitte
View slide
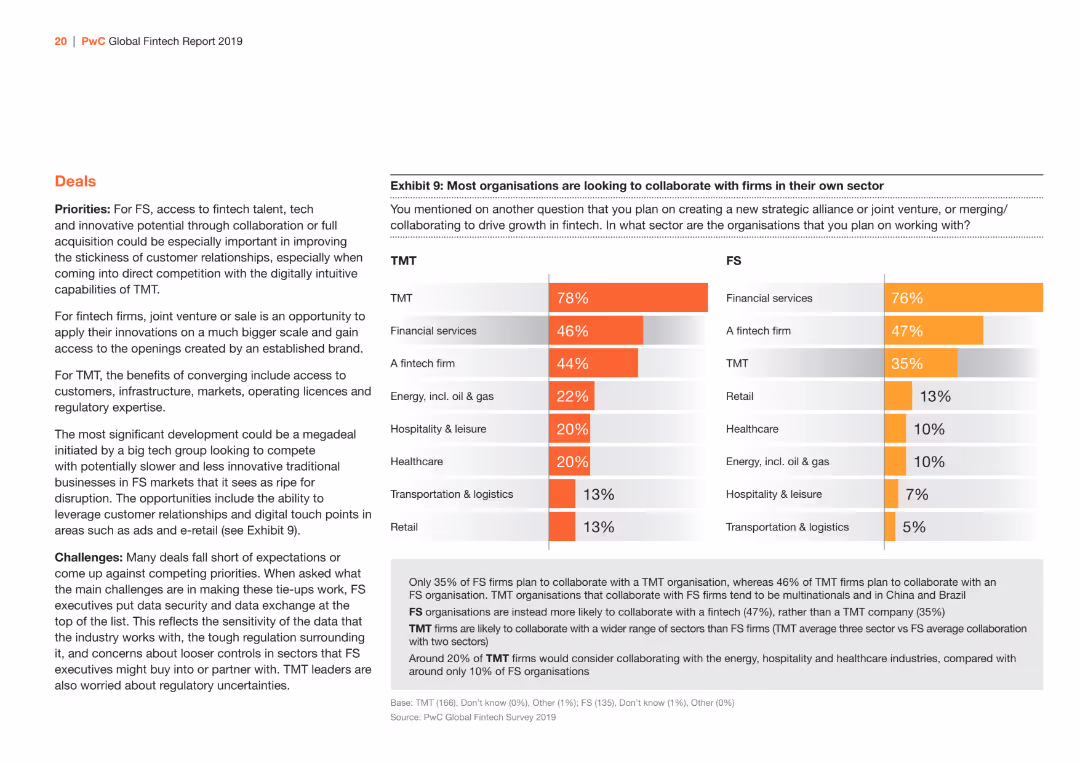
The slide presents two column charts side by side, depicting collaboration preferences of TMT and FS organizations in their sectors. The bars are in orange and gray shades for differentiation.
Strategic Planning
Financial Services
It highlights sectors where TMT and FS organizations are looking to collaborate, showing percentages for various industries like TMT, financial services, and fintech.
Collaboration, TMT, FS, Sectors, Strategic, Graph
false
Strategic Planning
Financial Services financial-services
Multiple Chart
PwC/Strategy&
View slide
A bar graph slide with horizontal bars of varying lengths indicating levels of focus on different types of work and collaboration. The background is clean, allowing the graph and the descriptive text on the left to stand out. The use of grayscale with selective yellow highlights creates visual interest.
Organizational Structure and Change
Professional Services
This slide examines shifts in collaboration and independent work trends over the past two years. It employs a bar graph to display the proportionate change in focus, serving as an analytical tool for companies reassessing their collaborative practices in light of remote and hybrid work experiences.
Collaboration, Trends, Remote Work, Hybrid Work, Organizational Change
false
Organizational Structure and Change
Professional Services professional-services
Single Chart
EY
View slide
Displays pie charts to show the percentages of buyers purchasing different categories of products in collaborations.
Product and Service Analysis
Retail & E-commerce
Details top-purchased product categories in luxury brand collaborations, such as handbags and sneakers.
Collaborations, luxury products, purchasing behavior, handbags, sneakers, consumer preferences, top products
false
Product and Service Analysis
Retail & E-commerce retail-and-e-commerce
Multiple Chart
BCG
View slide
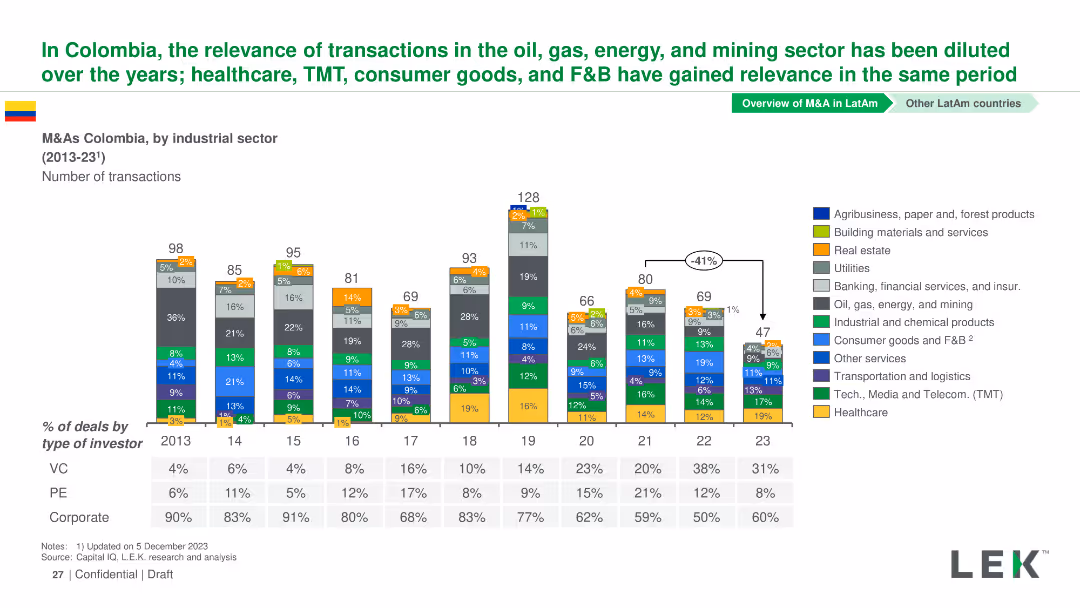
Column chart showing the number of M&A transactions by industrial sector in Colombia from 2013-2023. Sectors are color-coded and detailed in a legend.
Market Analysis and Trends
Financial Services
This slide analyzes M&A transactions in Colombia by industrial sector from 2013-2023, noting the rise in sectors like healthcare and TMT.
Colombia, M&A, Industrial Sectors, Transactions, Trends
false
Market Analysis and Trends
Financial Services financial-services
Mixed Chart
LEK
Previous
Loading...
Hold On!
We are searching in our database
If nothing, comes up, please try different filters!
Column Chart
Heatmap
Chevron
Org Chart
Infographic
Callouts
Timeline
List
Graphic
Picture
Process Flow
Diagram
Paragraph
Map
Table
Framework
Subtitle
Takeaway Box
Icon
Other Chart
Radar Chart
Waterfall Chart
Mekko Chart
Pie Chart
Scatter Plot
Line Chart
Bar chart
Bullet points
Create a FREE account to continue browsing
Receive Instant Access to 1,000+ slides from companies like McKinsey, Google, and Goldman Sachs
First Name
Last Name
Email
Password
I agree to all
Terms & Privacy Policy
Thank you! Your submission has been received!
Oops! Something went wrong while submitting the form.
Have an account?
Sign in
Upgrade to PRO to Save slides
Advanced Search and Filters
Access to 15,000+ slides
Access to Category Pages
Save/Bookmark Slides
PowerPoint Template Library
Pick a Plan
MONTHLY
$12/month
Billed every month, Cancel anytime.
YEARLY
$9/year
Billed $108 annually, Cancel anytime.
Checkout for $12/month
Checkout for $108/yr
Secured by Stripe | AES-256 bit encryption