My Account
My Slides
Search by Category
Templates
View All Templates
Download Template Slides
Leave Feedback
Login
Logout
Get Started
Browse all Slides
Browse all Slides
Create a FREE Account
Instant access to 1,000+ real slides from top companies like McKinsey, BCG, Goldman Sachs, Google and many more!
First Name
Last Name
Email
Password
I agree to all
Terms & Privacy Policy
Thank you! Your submission has been received!
Oops! Something went wrong while submitting the form.
Have an account?
Sign in
Spark Your Next Big Idea with New Presentation Templates
VIEW ALL Templates
Welcome,
Welcome
PRO
Show Featured Only
Checkbox 8
Companies
Mckinsey
Bain
BCG
EY
Deloitte
Accenture
PwC/Strategy&
JP Morgan
Goldman Sachs
Morgan Stanley
Citigroup
Deutsche Bank
Barclays
LEK
KPMG
Kearney
Oliver Wyman
Booz Allen Hamilton
Gartner
IPSOS
Nielsen
Slide type
Text Only
Linear Flow
Vertical Flow
Single Chart
Header Horizontal
Mixed Chart
Header Vertical
Pillar
Multiple Chart
Graphic
Agenda
Title
Table
Framework
Industry
Technology & Software
Artificial Intelligence
Financial Services
Retail & E-commerce
Consumer Goods
Industrial & Manufacturing
Transportation & Logistics
Telecommunications
Real Estate & Construction
Hospitality & Tourism
Professional Services
Education & Training
Media & Entertainment
Agriculture & Food Production
Healthcare & Pharmaceuticals
Environmental Services & Sustainability
Government & Public Sector
Use Case
Mergers and Acquisitions
Performance Metrics and KPIs
Client Case Studies
Competitive Landscape
Corporate Finance and Valuation
Product and Service Analysis
Customer and Market Segmentation
Organizational Structure and Change
Industry Overview
Regulatory and Compliance
Risk Assessment and Management
Investment Analysis
Organizational Structure and Change
Human Resources and Talent Management
Financial Performance
Market Analysis and Trends
Sales and Business Development
Human Resources and Talent Management
Clear all
Thank you! Your submission has been received!
Oops! Something went wrong while submitting the form.
Tag
View slide
Slide presents diagrams and statistics in a visually segregated format, enhancing readability and focus on specific data points. The layout is effectively utilized to present complex data.
Strategic Planning
Environmental Services & Sustainability
Explores the potential expansion of Copernicus user base beyond traditional commercial markets, specifically targeting public authorities and academics. Useful for strategic planning in expanding market reach and user engagement.
Copernicus, user base, market expansion, public authorities, academics
false
Strategic Planning
Environmental Services & Sustainability environmental-services-and-sustainability
Multiple Chart
PwC/Strategy&
View slide
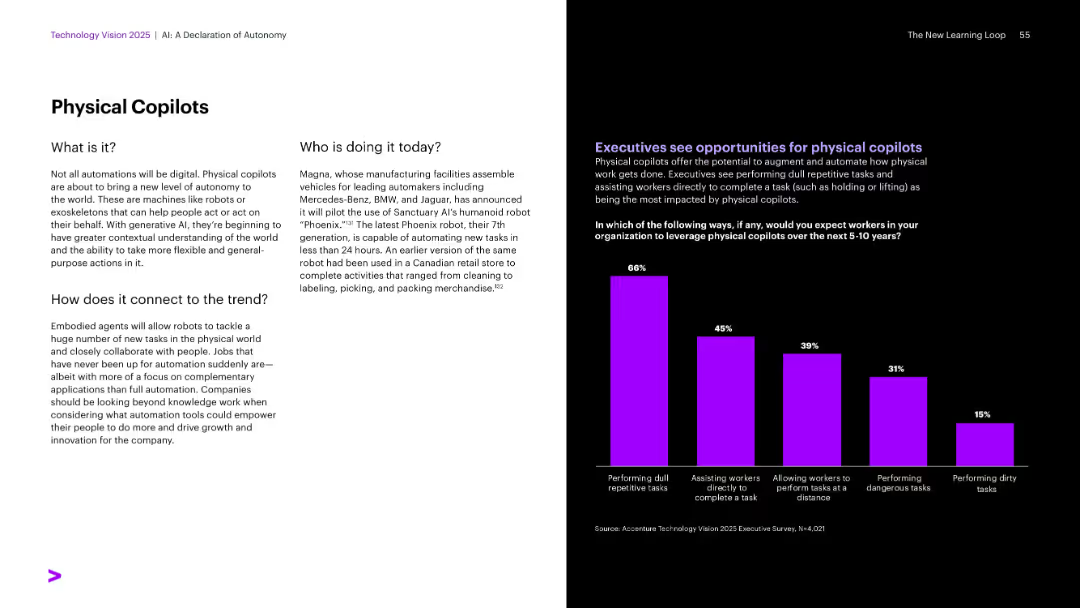
Standard split: text left, chart with purple bars right showing survey responses.
Operational Efficiency
Industrial & Manufacturing
Defines physical copilots (robots, exoskeletons) that collaborate with humans. It features Sanctuary AI’s Phoenix robot as an example and shows how executives expect to leverage these robots, especially for dull or repetitive tasks.
Copilots, physical automation, Sanctuary AI, Phoenix robot, collaboration
false
Operational Efficiency
Industrial & Manufacturing industrial-and-manufacturing
Mixed Chart
Accenture
View slide
This slide features a mixed chart with bars representing the industry wallet in advisory, equity, and debt, and a line indicating Goldman Sachs Fee Share. Annotations explain the growth strategy.
Market Analysis and Trends
Financial Services
Discussing the company's core business areas, the slide details the growth in market share across advisory, equity, and debt segments. It quantifies the financial implications of increasing market share, outlining strategic priorities for sector and regional expansion, and capturing acquisition financing opportunities.
Core Business, Market Share, Advisory, Equity, Debt, Growth Strategy
false
Market Analysis and Trends
Financial Services financial-services
Mixed Chart
Goldman Sachs
View slide
It features a line chart with multiple data series showing core inflation rates over two decades for the US, Eurozone, and UK. The slide has a white background with minimal design elements.
Market Analysis and Trends
Financial Services
Presenting a longitudinal view of core inflation trends, this slide is instrumental in understanding persistent inflation across various economies. It's valuable for financial analysts and economists for long-term planning and policy development, especially considering recent spikes in the inflation data.
Core Inflation, Trend, US, Eurozone, UK, Long-Term, Finance, Policy, 2023
false
Market Analysis and Trends
Financial Services financial-services
Single Chart
JP Morgan
View slide
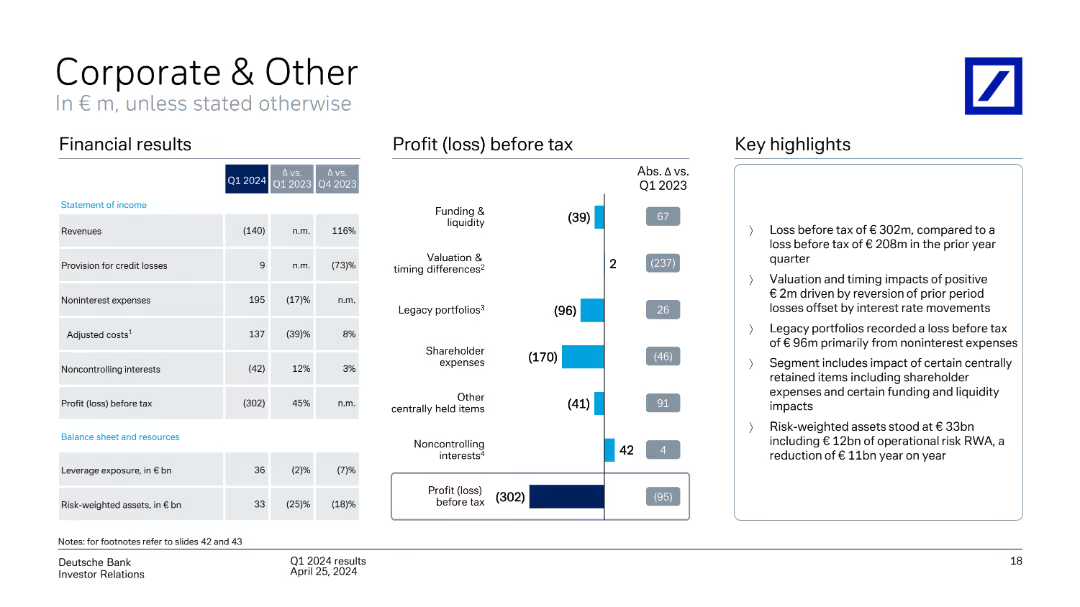
A column chart showing profit (loss) before tax by segment, with a table of financial results and key highlights. The slide is moderately dense with a mix of textual and visual elements.
Financial Performance
Financial Services
The slide details Q1 2024 financial results for the Corporate & Other segment, highlighting revenue, profit (loss) before tax, and key insights into various financial metrics and performance.
Corporate & Other, profit before tax, financial results, Q1 2024, performance
false
Financial Performance
Financial Services financial-services
Mixed Chart
Deutsche Bank
View slide
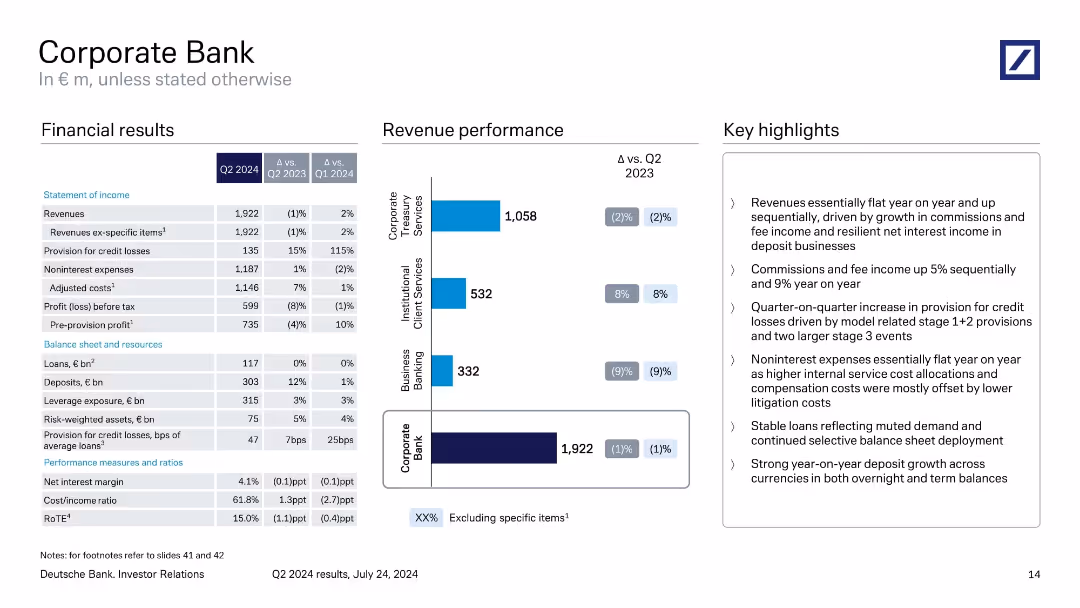
Three-column layout with financial table, revenue bar chart, and key highlights.
Product and Service Analysis
Financial Services
Reviews Q2 2024 performance of the Corporate Bank division. Highlights include flat revenue, rising provisions for credit losses, steady expenses, and growth in deposits. Segment-level revenue performance for treasury, institutional, and business banking is visualized.
Corporate Bank, Q2 2024, revenue, credit losses, business banking, Deutsche Bank
false
Product and Service Analysis
Financial Services financial-services
Mixed Chart
Deutsche Bank
View slide
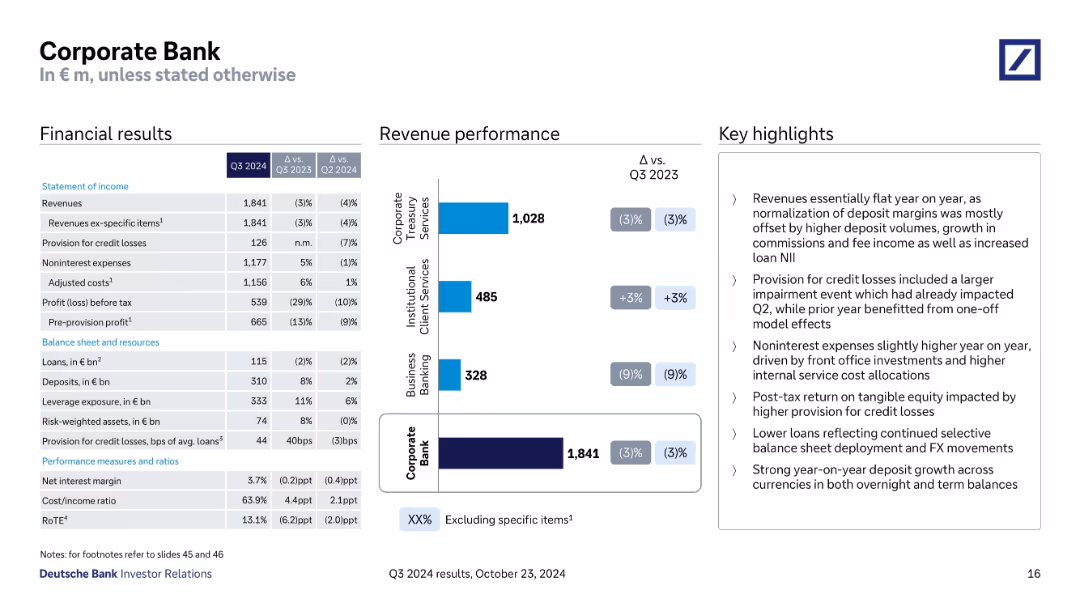
Split into financial results table, revenue chart, and highlights; detailed KPI breakdown.
Financial Performance
Financial Services
Covers Q3 2024 performance of the Corporate Bank, including revenue declines, cost management, credit loss provisions, and segment revenue breakdown. Discusses deposit growth, margin normalization, and internal service cost increases.
Corporate Bank, deposit growth, credit losses, revenue mix, RoTE
false
Financial Performance
Financial Services financial-services
Mixed Chart
Deutsche Bank
View slide
A column chart comparing revenue performance across segments, a table of financial results, and key highlights. The slide is moderately dense with a balanced mix of text and visual elements.
Financial Performance
Financial Services
This slide provides an overview of the Corporate Bank's Q1 2024 financial results, including revenue, profit, and other key metrics, comparing them across different business segments.
Corporate Bank, revenue performance, financial results, Q1 2024, business segments
false
Financial Performance
Financial Services financial-services
Mixed Chart
Deutsche Bank
View slide
Includes bar and tables detailing revenue performance and financial metrics for the Corporate Bank segment, alongside key financial highlights.
Financial Performance
Financial Services
Highlights the financial performance of the Corporate Bank division, noting significant areas of revenue growth and cost management.
Corporate Bank, revenue, costs, performance
false
Financial Performance
Financial Services financial-services
Mixed Chart
Deutsche Bank
View slide
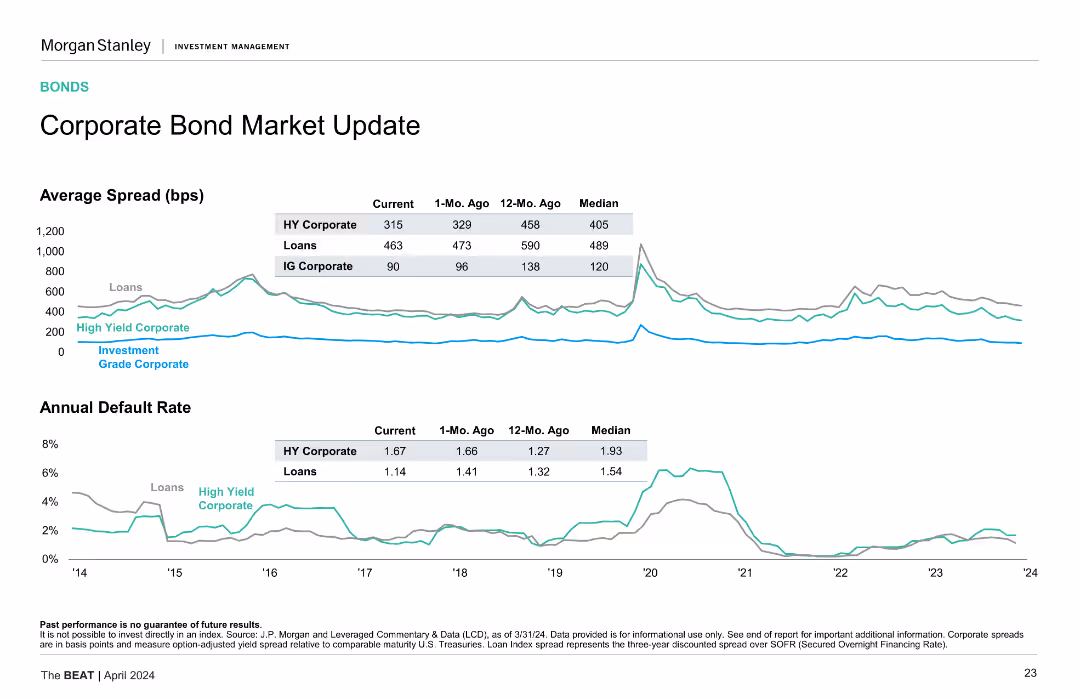
Line charts displaying average spread and annual default rate for high yield, investment grade corporate bonds, and loans over time.
Market Analysis and Trends
Financial Services
Updates on corporate bond markets showing average spread and default rates, comparing current data with past months and years.
Corporate Bonds, Default Rates, Market Update, Financial Metrics, High Yield Bonds
false
Market Analysis and Trends
Financial Services financial-services
Multiple Chart
Morgan Stanley
View slide
The slide includes two line charts showing average spreads and annual default rates for different types of corporate bonds and loans.
Market Analysis and Trends
Financial Services
This slide gives an update on the corporate bond market, showing the average spreads and default rates, helping investors understand market conditions.
Corporate Bonds, Market Update, Spreads, Default Rates, Investments
false
Market Analysis and Trends
Financial Services financial-services
Multiple Chart
Morgan Stanley
View slide
The slide contains column charts comparing expected EPS growth for regions/styles and S&P 500 sectors, highlighting significant differences.
Financial Performance
Financial Services
This slide analyzes expected corporate earnings growth, comparing different regions and S&P 500 sectors, providing insights into potential financial performance.
Corporate Earnings, EPS Growth, Regions, S&P 500 Sectors, Financial Performance
false
Financial Performance
Financial Services financial-services
Multiple Chart
Morgan Stanley
View slide
Pie charts displaying the percentages of companies engaging in public and private actions in response to a Supreme Court decision. Each chart shows a small minority engaging actively.
Customer and Market Segmentation
Professional Services
This slide presents data on corporate responses to a controversial Supreme Court decision, highlighting a general reluctance to take public stands, with slightly more openness towards private actions.
Corporate Ethics, Supreme Court, Roe vs Wade, Public Actions, Private Actions, Pie Chart, Survey Data
false
Customer and Market Segmentation
Professional Services professional-services
Multiple Chart
Deloitte
View slide
The slide uses bullet points and column charts to present financial results and losses. The layout is information-dense.
Financial Performance
Financial Services
Focused on the "Corporate & Other" segment of a financial institution, this slide shows detailed financial results including profits and losses, adjustments, and expenses. It is intended for financial analysts and management to evaluate the impact of non-core activities on the overall financial health of the institution, with specific attention to shareholder expenses, legacy portfolios, and valuation adjustments.
Corporate Finance, Losses, Profits, Financial Reporting, Analysis
false
Financial Performance
Financial Services financial-services
Mixed Chart
Deutsche Bank
View slide
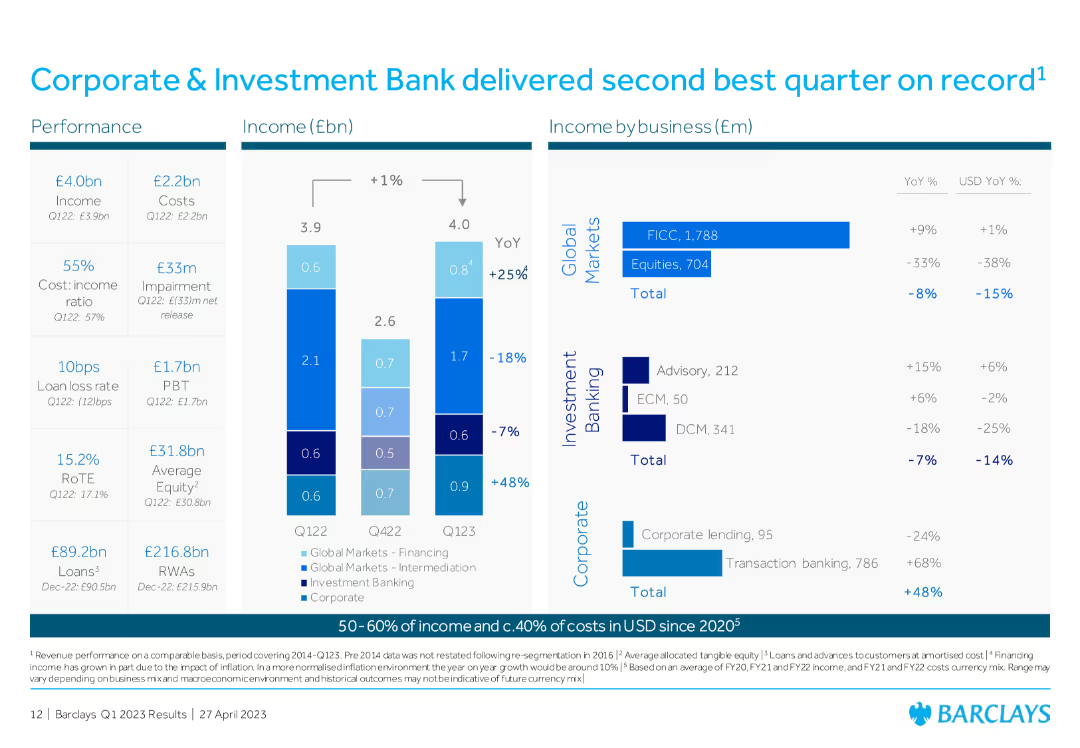
Column chart showing income and costs, with detailed breakdowns by business (Global Markets, Investment Banking, Corporate), including YoY percentage changes.
Financial Performance
Financial Services
The slide showcases the Corporate & Investment Bank's performance, highlighting the second-best quarter on record with detailed financial breakdowns by business sector.
Corporate Investment Bank, financial performance, Global Markets, Investment Banking, quarterly results
false
Financial Performance
Financial Services financial-services
Multiple Chart
Barclays
View slide
A pie chart illustrates corporate lending total credit exposure by sector, accompanied by a list of benefits on the left side, highlighting the strategic approach to lending.
Operational Efficiency
Financial Services
The slide offers an insight into the corporate lending credit exposure, distributed across various sectors, showing a strategic, relationship-focused approach to lending. It stresses on the franchise benefits from lending practices underpinned by diligent risk management, aiming for risk-adjusted returns.
Corporate Lending, Credit Exposure, Strategy, Risk Management, Sectors
false
Operational Efficiency
Financial Services financial-services
Multiple Chart
Goldman Sachs
View slide
The slide displays a diamond-shaped diagram in the center, showing four business areas, flanked by text blocks on each side. It is in a blue and white color scheme with the page number at the bottom right.
Organizational Structure and Change
Financial Services
This slide provides an overview of the presenter's corporate structure, highlighting the integration of services and the focus on client-centricity. It outlines the growth in client coverage and improved relationships as a result of this approach. Ideal for discussions on corporate strategy, organizational change, and client relationship management, it illustrates the company's strategy for unified services and growth in client engagement.
Corporate Strategy, Client Centricity, Business Development, Organizational Structure, Integration
false
Organizational Structure and Change
Financial Services financial-services
Framework
Goldman Sachs
View slide
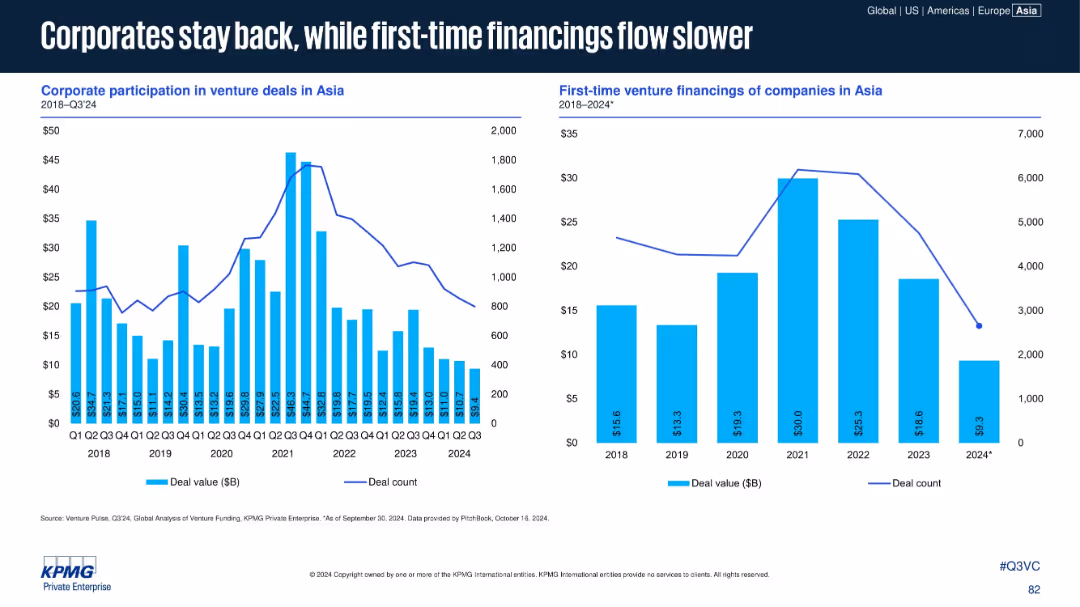
Split slide: Left bar/line chart on corporate VC participation; right bar/line chart on first-time financing trends in Asia (2018–2024).
Strategic Planning
Financial Services
Highlights a decline in corporate venture participation and first-time financing deals in Asia. Emphasizes the reduced involvement of strategic investors and new market entrants, suggesting more cautious capital deployment.
Corporate VC, First-time Funding, Asia, Deal Count, Strategy, 2024
false
Strategic Planning
Financial Services financial-services
Multiple Chart
KPMG
View slide
Includes several tables and bar chart outlining financial results and revenue performance for Deutsche Bank's Corporate Bank. Dense textual annotations and percentage changes are detailed beside each graphical representation.
Financial Performance
Financial Services
This slide details the Q2 2023 financial and revenue performance of Deutsche Bank's Corporate Bank, highlighting significant figures such as revenue growth, profit before tax, and changes in loans and deposits.
Corporate banking, revenue growth, financial performance, Q2 2023, profit analysis, Deutsche Bank
false
Financial Performance
Financial Services financial-services
Mixed Chart
Deutsche Bank
View slide
The slide features two line charts. The first chart shows the average spread (bps) of HY Corporate, Loans, and IG Corporate bonds. The second chart displays the annual default rate of HY Corporate and Loans. Both charts have legends and data points for Current, 1-Mo. Ago, 12-Mo. Ago, and Median values.
Market Analysis and Trends
Financial Services
The slide provides an update on the corporate bond market, showcasing the average spread and annual default rate for different bond categories over time.
Corporate bonds, average spread, default rate, HY Corporate, IG Corporate, Loans
false
Market Analysis and Trends
Financial Services financial-services
Multiple Chart
Morgan Stanley
View slide
Line charts showing average spread and annual default rate for high yield and investment grade corporate bonds.
Market Analysis and Trends
Financial Services
Provides update on corporate bond markets with focus on high yield and investment grade bonds, showing spreads and default rates, aiding investment decisions.
Corporate bonds, default rates, spreads
false
Market Analysis and Trends
Financial Services financial-services
Multiple Chart
Morgan Stanley
View slide
The slide includes text discussing the inevitability of crises, a circular graph showing the percentage of respondents who have experienced crises in the past five years, and key statistics about crisis frequency.
Risk Assessment and Management
Professional Services
This slide emphasizes the prevalence and inevitability of corporate crises, supported by survey data indicating that nearly 70% of leaders have faced multiple crises recently.
Corporate crisis, inevitability, survey data, crisis frequency, risk management
false
Risk Assessment and Management
Professional Services professional-services
Mixed Chart
PwC/Strategy&
View slide
Contains bar charts and financial summaries that detail profit and loss figures, enriched with notes explaining factors impacting the results, such as shareholder expenses and valuation adjustments.
Financial Performance
Financial Services
This slide covers the Q2 2023 financial results for Deutsche Bank's Corporate & Other segment, focusing on losses and specific financial impacts including shareholder expenses and provisions.
Corporate finance, financial losses, shareholder expenses, profit and loss analysis, Deutsche Bank, Q2 2023
false
Financial Performance
Financial Services financial-services
Mixed Chart
Deutsche Bank
View slide
The slide features a bar chart on the left depicting the ratio of companies with net cash by region, and a line chart on the right showing return on equity over time for different regions. The charts use color coding to differentiate between regions.
Regulatory and Compliance
Financial Services
This slide discusses corporate governance by illustrating the ratio of companies with net cash and their return on equity across different regions. It is useful for understanding financial health and governance standards in various markets.
Corporate governance, net cash, return on equity, financial health, Europe, U.S., Korea, Japan
false
Regulatory and Compliance
Financial Services financial-services
Multiple Chart
JP Morgan
View slide
The slide shows a bar chart indicating the percentage of CEOs agreeing with statements about the importance of a strong corporate purpose and trust in a digitized world, highlighting various concerns and priorities.
Strategic Planning
Technology & Software
This slide highlights the importance of corporate purpose and trust in a digitized world. It shows that CEOs believe maintaining a strong corporate purpose and managing data privacy and stakeholder expectations are crucial in the digital age.
Corporate purpose, trust, digital age, data privacy, stakeholder expectations, CEOs
false
Strategic Planning
Technology & Software technology-and-software
Multiple Chart
PwC/Strategy&
View slide
A structured layout with block elements and a sidebar detailing client wins. The slide utilizes blue shading to differentiate between the types of management and coaching services, with numerical data and percentages provided.
Organizational Structure and Change
Financial Services
Showcasing the expansion of wealth management through corporate relationships, this slide illustrates client growth and service coverage. It may serve to discuss the impact of corporate partnerships on personal financial management services and client engagement strategies.
Corporate relationships, Wealth management, Client engagement, Financial management, Growth
false
Organizational Structure and Change
Financial Services financial-services
Table
Goldman Sachs
View slide
Includes a percentage bar chart with a purple theme. Each bar represents consumer agreement levels with statements about business responsibility.
Strategic Planning
Professional Services
Discusses expectations for businesses to act responsibly post-event, emphasizing the high consumer agreement on sustainable and fair solutions.
Corporate responsibility, Business ethics, Consumer expectations, Agreement levels, Sustainable solutions, Fair practices, Bar chart
false
Strategic Planning
Professional Services professional-services
Single Chart
Accenture
View slide
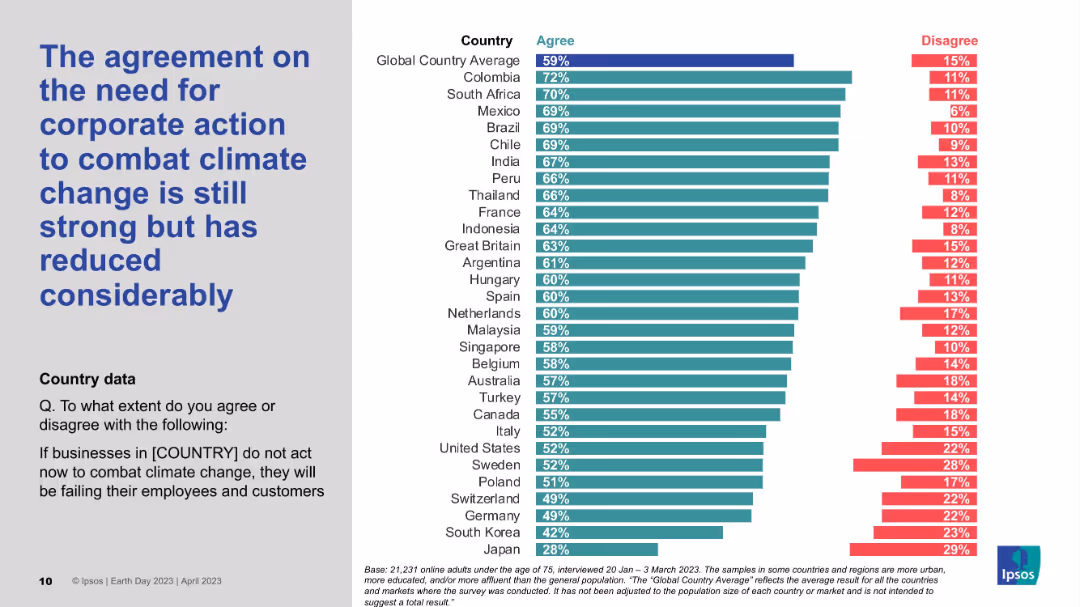
Similar layout as Slide 19444; ranked bar chart; countries arranged by agreement levels; corporate action focus.
Risk Assessment and Management
Environmental Services & Sustainability
This slide focuses on how strongly citizens believe businesses must take action on climate change. While agreement is still significant, it has dropped notably from previous years. Colombia, South Africa, and Mexico show the highest concern.
Corporate responsibility, Climate action, Public opinion, Ipsos, Survey decline
false
Risk Assessment and Management
Environmental Services & Sustainability environmental-services-and-sustainability
Mixed Chart
IPSOS
View slide
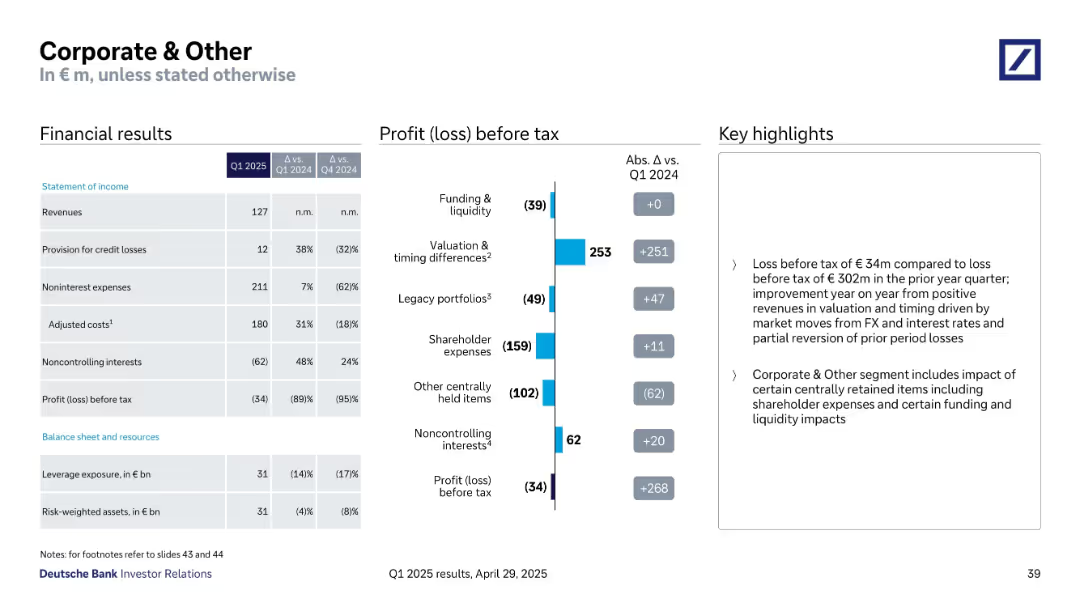
Left-aligned financial tables, middle bar chart showing loss components, and right-aligned text highlights.
Financial Performance
Financial Services
Highlights the Q1 2025 financial results of the “Corporate & Other” segment, showing significant year-on-year improvement in profit/loss before tax, driven by valuation changes and partial reversals of past losses. Key metrics like revenues, costs, and leverage exposure are detailed.
Corporate segment, financial results, profit before tax, valuation, expenses, leverage, Deutsche Bank
false
Financial Performance
Financial Services financial-services
Mixed Chart
Deutsche Bank
View slide
Uses various icons and bullet points to compare aspects of JPMorgan's global operations and asset management.
Financial Performance
Financial Services
Examines the mutual benefits within different segments of JPMorgan, including client reach, technology, and community engagement.
Corporate synergy, client reach, technology, brand, marketing, community engagement, talent management
false
Financial Performance
Financial Services financial-services
Table
JP Morgan
Previous
Loading...
Hold On!
We are searching in our database
If nothing, comes up, please try different filters!
Column Chart
Heatmap
Chevron
Org Chart
Infographic
Callouts
Timeline
List
Graphic
Picture
Process Flow
Diagram
Paragraph
Map
Table
Framework
Subtitle
Takeaway Box
Icon
Other Chart
Radar Chart
Waterfall Chart
Mekko Chart
Pie Chart
Scatter Plot
Line Chart
Bar chart
Bullet points
Create a FREE account to continue browsing
Receive Instant Access to 1,000+ slides from companies like McKinsey, Google, and Goldman Sachs
First Name
Last Name
Email
Password
I agree to all
Terms & Privacy Policy
Thank you! Your submission has been received!
Oops! Something went wrong while submitting the form.
Have an account?
Sign in
Upgrade to PRO to Save slides
Advanced Search and Filters
Access to 15,000+ slides
Access to Category Pages
Save/Bookmark Slides
PowerPoint Template Library
Pick a Plan
MONTHLY
$12/month
Billed every month, Cancel anytime.
YEARLY
$9/year
Billed $108 annually, Cancel anytime.
Checkout for $12/month
Checkout for $108/yr
Secured by Stripe | AES-256 bit encryption