My Account
My Slides
Search by Category
Templates
View All Templates
Download Template Slides
Leave Feedback
Login
Logout
Get Started
Browse all Slides
Browse all Slides
Create a FREE Account
Instant access to 1,000+ real slides from top companies like McKinsey, BCG, Goldman Sachs, Google and many more!
First Name
Last Name
Email
Password
I agree to all
Terms & Privacy Policy
Thank you! Your submission has been received!
Oops! Something went wrong while submitting the form.
Have an account?
Sign in
Spark Your Next Big Idea with New Presentation Templates
VIEW ALL Templates
Welcome,
Welcome
PRO
Show Featured Only
Checkbox 8
Companies
Mckinsey
Bain
BCG
EY
Deloitte
Accenture
PwC/Strategy&
JP Morgan
Goldman Sachs
Morgan Stanley
Citigroup
Deutsche Bank
Barclays
LEK
KPMG
Kearney
Oliver Wyman
Booz Allen Hamilton
Gartner
IPSOS
Nielsen
Slide type
Text Only
Linear Flow
Vertical Flow
Single Chart
Header Horizontal
Mixed Chart
Header Vertical
Pillar
Multiple Chart
Graphic
Agenda
Title
Table
Framework
Industry
Technology & Software
Artificial Intelligence
Financial Services
Retail & E-commerce
Consumer Goods
Industrial & Manufacturing
Transportation & Logistics
Telecommunications
Real Estate & Construction
Hospitality & Tourism
Professional Services
Education & Training
Media & Entertainment
Agriculture & Food Production
Healthcare & Pharmaceuticals
Environmental Services & Sustainability
Government & Public Sector
Use Case
Mergers and Acquisitions
Performance Metrics and KPIs
Client Case Studies
Competitive Landscape
Corporate Finance and Valuation
Product and Service Analysis
Customer and Market Segmentation
Organizational Structure and Change
Industry Overview
Regulatory and Compliance
Risk Assessment and Management
Investment Analysis
Organizational Structure and Change
Human Resources and Talent Management
Financial Performance
Market Analysis and Trends
Sales and Business Development
Human Resources and Talent Management
Clear all
Thank you! Your submission has been received!
Oops! Something went wrong while submitting the form.
Tag
View slide
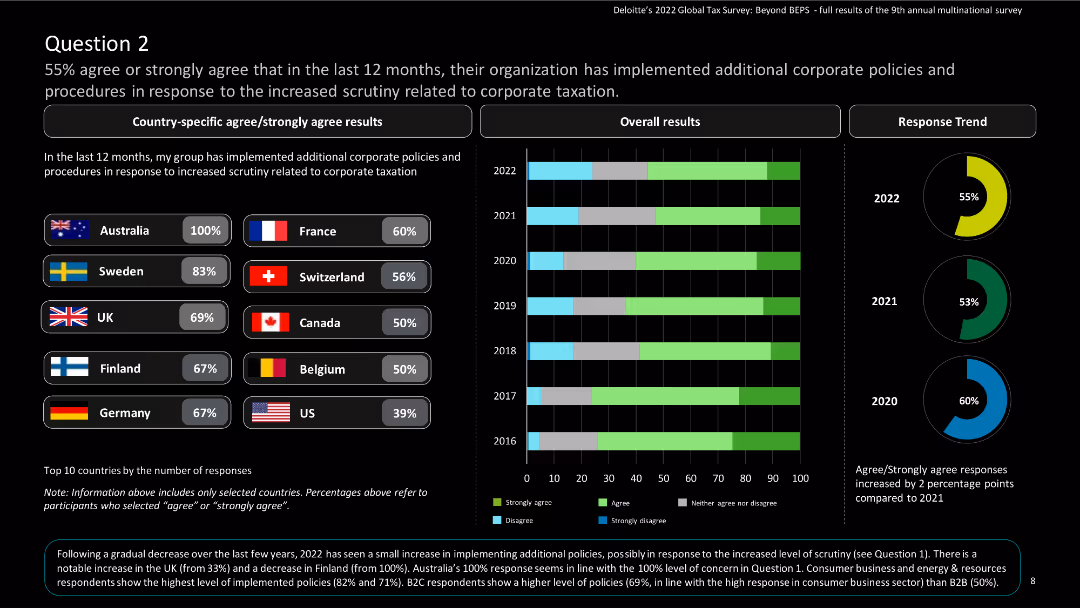
The slide features country-specific results and a column chart showing overall and response trend results over the years.
Regulatory and Compliance
Financial Services
The slide discusses the implementation of additional corporate policies due to increased scrutiny related to corporate taxation.
Corporate taxation, policies, scrutiny, corporate, global tax, Deloitte, agree, strongly agree, survey, multinational
false
Regulatory and Compliance
Financial Services financial-services
Multiple Chart
Deloitte
View slide
Contains key financial results and metrics for the Institutional Clients Group, including net income and revenue by business segment.
Financial Performance
Financial Services
Summarizes performance results and key financial indicators for Citigroup's Institutional Clients Group for Q4 2021.
Corporate, Clients, Performance, Financial, Banking
false
Financial Performance
Financial Services financial-services
Mixed Chart
Citigroup
View slide
This slide is a visual summary with three sets of paired bar graphs showing the current coverage of financial services against the total eligible employees in executive, personal, and wellness financial management. The graphs use shades of blue with white text.
Operational Efficiency
Financial Services
Displays the extent of financial management services provided by Goldman Sachs to corporate employees, relative to the total eligible. It is useful for discussions on market penetration and service expansion strategies within corporate financial management sectors.
Corporate, Financial Management, Employees, Coverage
false
Operational Efficiency
Financial Services financial-services
Mixed Chart
Goldman Sachs
View slide
The slide has column charts and text elements. It shows the utilization of corporate lending and credit lines, including incremental risk-weighted assets (RWA).
Financial Performance
Financial Services
This slide provides information on corporate lending and credit line utilization, detailing incremental RWA if fully drawn, useful for assessing corporate credit exposure and utilization rates.
Corporate, Lending, Credit, Utilization, RWA
false
Financial Performance
Financial Services financial-services
Multiple Chart
UBS
View slide
Includes logos of key companies and text descriptions, organized neatly to facilitate comparison and provide a clear overview of corporate actions in sustainability.
Market Analysis and Trends
Environmental Services & Sustainability
Discusses the efforts of major corporations in SEA to advance decarbonization through investments in EVs and renewable energies, emphasizing regional impacts and future trends.
Corporates, decarbonization, SEA, EVs, renewable energies
false
Market Analysis and Trends
Environmental Services & Sustainability environmental-services-and-sustainability
Header Vertical
Bain
View slide
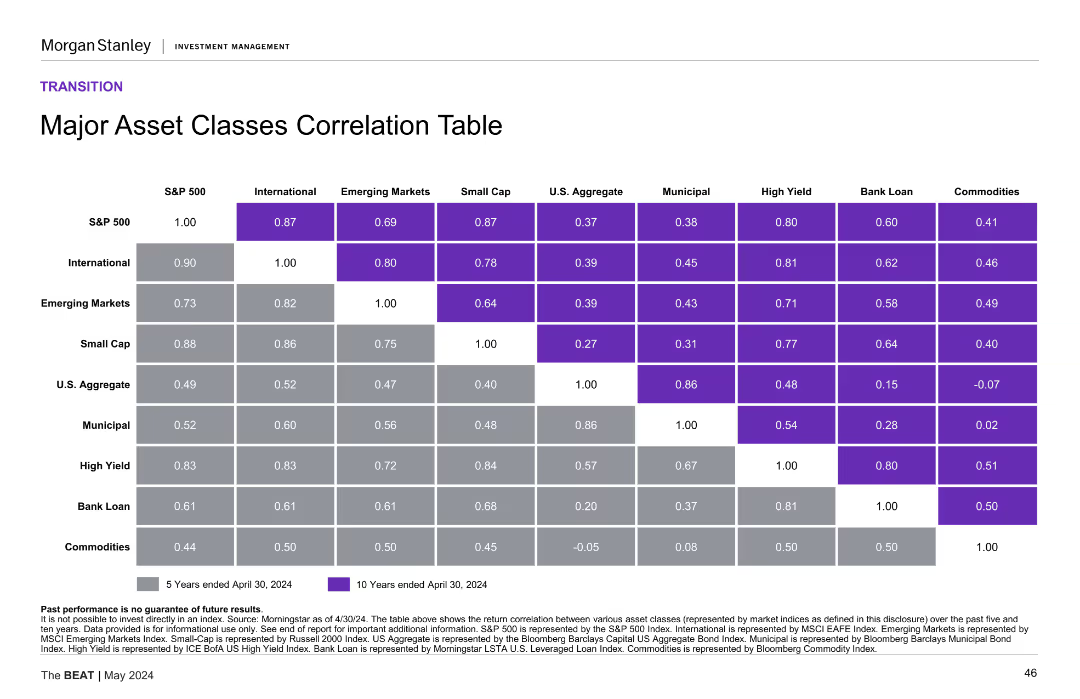
A table displaying correlation coefficients between different asset classes over 5 and 10 years. Purple shades indicate strength of correlation.
Financial Performance
Financial Services
This slide assists in understanding asset relationships over time, crucial for managing investment risk and building diversified portfolios.
Correlation, Asset Classes, Risk Management, Portfolio, Diversification, Investment, Table, Coefficients
false
Financial Performance
Financial Services financial-services
Table
Morgan Stanley
View slide
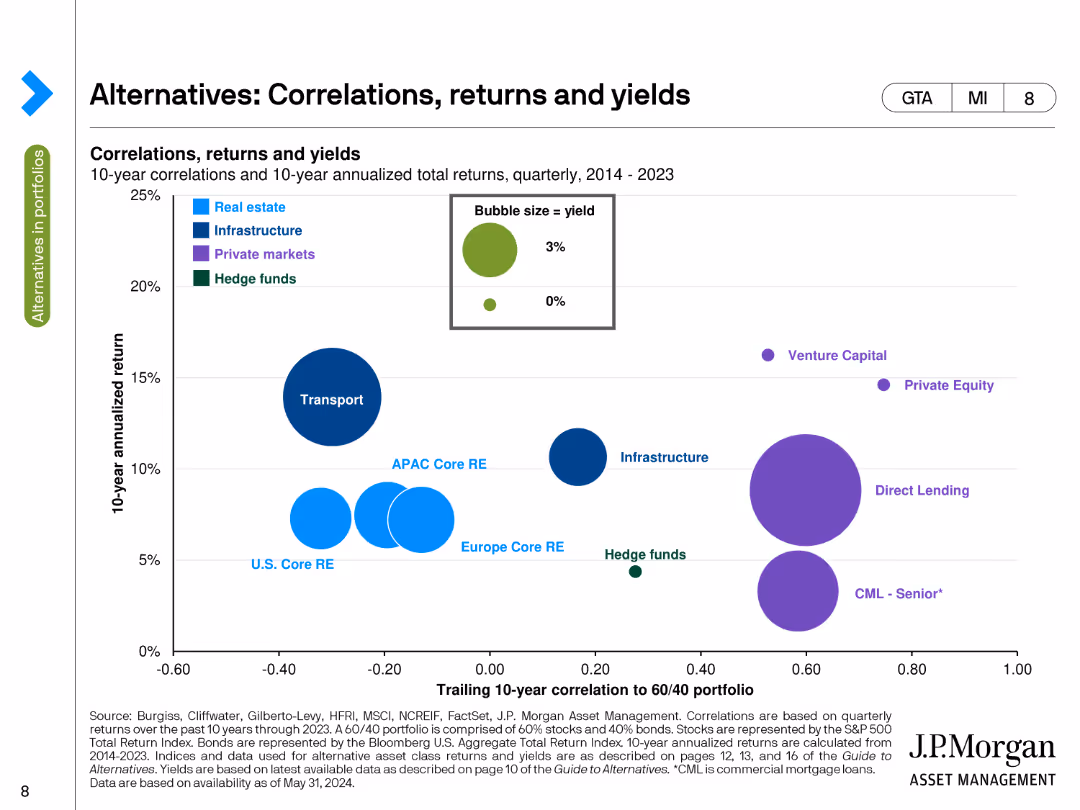
This slide contains a bubble chart showing 10-year correlations and annualized total returns for various asset classes, with bubble size representing yield. The chart uses multiple colors to distinguish between different asset types, such as real estate, infrastructure, and private markets.
Market Analysis and Trends
Financial Services
The slide presents a correlation analysis of alternative assets like real estate, infrastructure, and private markets against a 60/40 portfolio over a 10-year period. It highlights the relationship between return and risk for these asset classes.
Correlation, Returns, Yields, Alternatives, Asset Classes
false
Market Analysis and Trends
Financial Services financial-services
Single Chart
JP Morgan
View slide
Table with correlation data between major asset classes (e.g., S&P 500, International, Emerging Markets) over 5 and 10 years. Each cell shows correlation coefficient with color coding.
Investment Analysis
Financial Services
Displays correlation coefficients between various asset classes over 5 and 10 years, helping in understanding asset diversification benefits.
Correlation, asset classes, investment
false
Investment Analysis
Financial Services financial-services
Table
Morgan Stanley
View slide
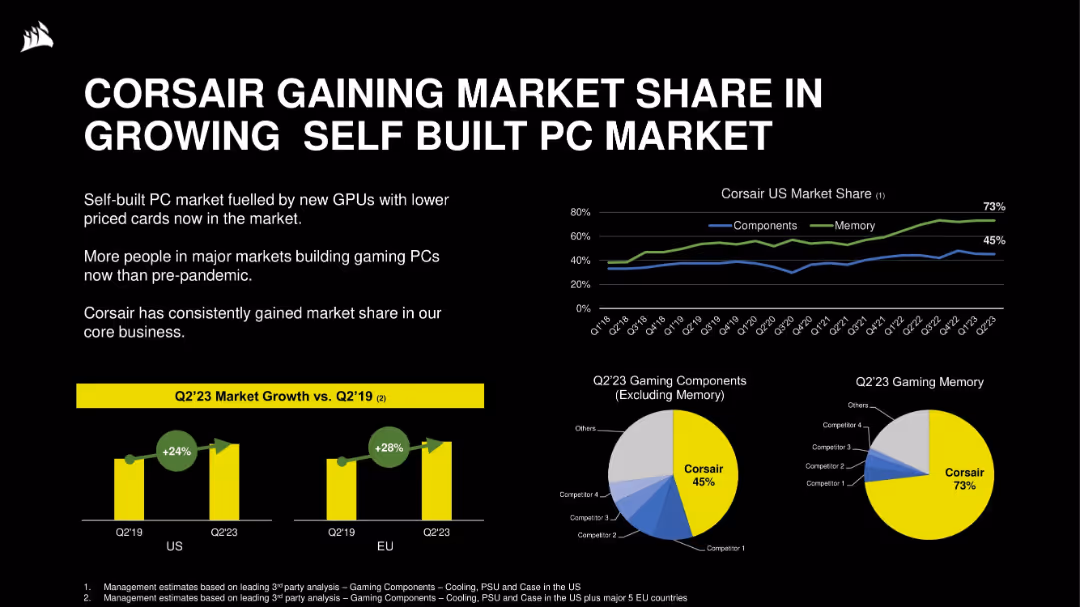
Mixed charts: line chart (US market share), bar chart (market growth), and pie charts (component and memory share). Black background with vibrant accent colors.
Competitive Landscape
Technology & Software
This slide demonstrates Corsair’s market share gains in the gaming hardware space. It presents evidence of dominance in memory (73%) and strong performance in components (45%), backed by market growth since Q2’19 in both US and EU regions.
Corsair, market share, PC components, memory, growth, self-built PC, competitors, Q2’23, hardware
false
Competitive Landscape
Technology & Software technology-and-software
Multiple Chart
Goldman Sachs
View slide
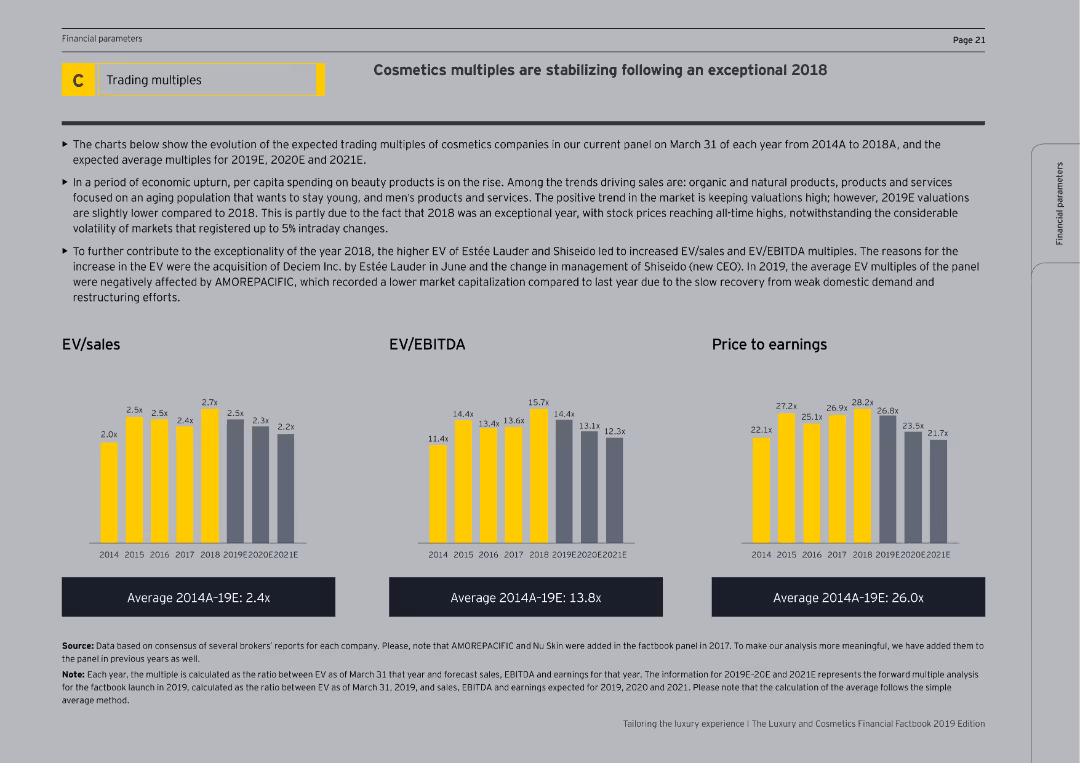
The slide includes column charts showing EV/sales, EV/EBITDA, and price to earnings ratios from 2014 to 2021E. The slide is moderately complex with a thorough analysis of the cosmetics market and factors affecting these financial multiples.
Market Analysis and Trends
Consumer Goods
The slide discusses the stabilization of cosmetics multiples following an exceptional 2018, presenting EV/sales, EV/EBITDA, and price to earnings ratios. It explains market trends, including increased spending on beauty products and the impact of organic and natural products on valuations.
Cosmetics, EV/Sales, EV/EBITDA, Price to Earnings
false
Market Analysis and Trends
Consumer Goods consumer-goods
Multiple Chart
EY
View slide
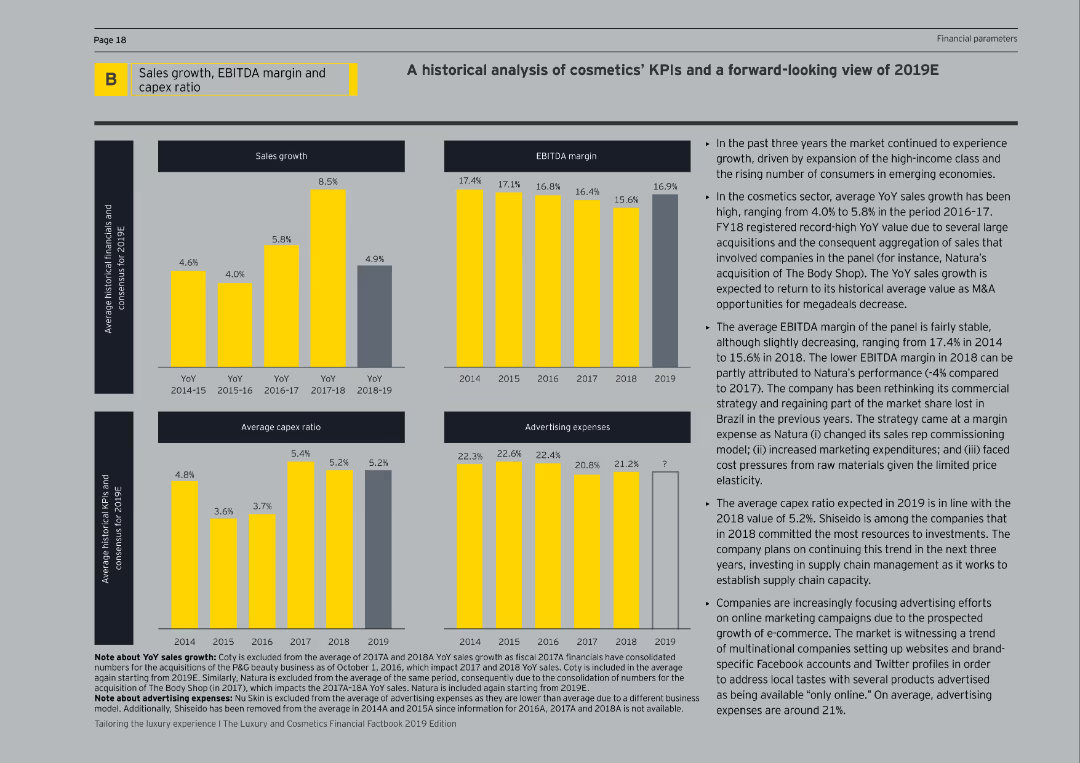
The slide includes multiple column charts detailing sales growth, EBITDA margin, average capex ratio, and advertising expenses over several years. The text description is on the right, explaining the trends and providing future expectations.
Market Analysis and Trends
Consumer Goods
This slide offers a historical analysis of key performance indicators (KPIs) in the cosmetics sector, focusing on sales growth, EBITDA margin, capex ratio, and advertising expenses. It also provides a forward-looking view for 2019, highlighting market drivers and expected performance.
Cosmetics, KPIs, Sales Growth, EBITDA, Capex
false
Market Analysis and Trends
Consumer Goods consumer-goods
Multiple Chart
EY
View slide
The slide includes a scatter plot comparing cost efficiency and capital efficiency among banks. Text boxes explain the efficiency and profitability of UBS's personal and corporate banking.
Operational Efficiency
Financial Services
This slide showcases UBS's cost and capital efficiency, comparing it to Swiss and European peers, and highlights its superior profitability.
Cost Efficiency, Capital Efficiency, UBS, Banking, Profitability
false
Operational Efficiency
Financial Services financial-services
Mixed Chart
UBS
View slide
Multiple column charts detailing material inflation and commodity price trends over 5 years. Includes World Bank data, focus on crude palm, soybean oil, and Brent crude. Blue and red bars/columns to show price trends and inflation.
Risk Assessment and Management
Consumer Goods
Evaluates the impact of rising commodity prices on Unilever's operations, focusing on strategies to manage cost inflation and its effects on profitability. Highlights the urgency of managing operational costs in volatile market conditions.
Cost Inflation, Commodity Prices, Risk Management, Operational Costs, Profitability
false
Risk Assessment and Management
Consumer Goods consumer-goods
Multiple Chart
Deutsche Bank
View slide
Contains a column chart and a series of stepwise diagrams illustrating cost management strategies, with clear textual categorizations for each segment.
Operational Efficiency
Financial Services
Discusses strategies for reducing noninterest expenses by 2025, focusing on efficiency measures, operational improvements, and cost management to sustain investment and maintain competitive leverage in the market.
Cost Management, Efficiency, Noninterest Expenses, Operational Improvements, Strategic Investments
false
Operational Efficiency
Financial Services financial-services
Mixed Chart
Deutsche Bank
View slide
Contains bar charts comparing cost management maturity levels across different regions including the Nordics.
Risk Assessment and Management
Professional Services
Explores the maturity levels of cost management practices globally, emphasizing that Nordic regions report lower maturity compared to the global average, and discusses potential areas for improvement.
Cost Management, Maturity Levels, Nordic, Global Comparison, Improvement
false
Risk Assessment and Management
Professional Services professional-services
Mixed Chart
Deloitte
View slide
Displays a list of six key levers for addressing the cost base in a strategic manner, each accompanied by an icon and a brief description.
Operational Efficiency
Professional Services
Outlines the six essential levers for strategic cost management, detailing their relevance and impact on business operations. The levers include Operating Governance, Service Delivery Model, Business Process Optimisation, Organisation Design, External Spend Management, and Demand Management. This slide is essential for understanding strategic approaches to cost reduction.
Cost Management, Strategic Levers, Business Operations, Optimization
false
Operational Efficiency
Professional Services professional-services
Table
Deloitte
View slide
Line graph comparing current MMIS vs. modular MMIS cost projections. Detailed explanatory text and a table with cost comparisons over years.
Financial Performance
Government & Public Sector
Projected cost savings of $13.5M for New Hampshire with a modular MMIS approach between 2022 and 2030, comparing current and future cost trajectories.
Cost Projections, MMIS, Modular, Savings, Fiscal Year
false
Financial Performance
Government & Public Sector government-and-public-sector
Mixed Chart
Alvarez & Marsal
View slide
Presents a flow chart with elements classified into Traditional, Next Generation, and Digital Optimization phases, each with icons and text.
Strategic Planning
Professional Services
Explores the evolution of cost reduction programs, from traditional levers focused on operating model efficiency to digital optimization incorporating advanced technologies for real-time insights and automation.
Cost Reduction, Digital Optimization, Traditional Levers, Next Generation, Evolution
false
Strategic Planning
Professional Services professional-services
Table
Deloitte
View slide
Contains several column charts displaying the likelihood of cost programs, ambition levels, and success rates, with specific focus on the Nordic regions compared to others.
Market Analysis and Trends
Professional Services
The slide provides statistical data on the likelihood, ambition, and success rates of cost reduction programs globally, emphasizing lower initiation but higher ambition and failure rates in Nordic countries, compared to other regions.
Cost Reduction, Nordic, Ambition, Success Rates, Global Comparison
false
Market Analysis and Trends
Professional Services professional-services
Multiple Chart
Deloitte
View slide
Features two column charts comparing data from 2014 and 2019. It has headers for 'Engagement' and 'Expenses and Simplification', along with descriptive text and icons.
Operational Efficiency
Financial Services
The slide discusses how shifting to self-service has decreased transaction costs and the optimization of branch networks, pointing towards an increase in efficiency and engagement.
Cost Reduction, Self-Service, Branch Optimization, Banking, Efficiency
false
Operational Efficiency
Financial Services financial-services
Multiple Chart
JP Morgan
View slide
This slide shows two sets of column charts. The first chart displays 'Cost Saves Limiting Expense Growth' over time, and the second chart shows 'Merger Costs Fading'. There is a clear visual trend of decreasing costs highlighted by the arrow.
Operational Efficiency
Financial Services
Illustrates cost savings over time and the reduction of merger-related expenses. It effectively uses visual trends to demonstrate financial discipline and the benefits realized from the merger, such as reducing operational costs and achieving synergies.
Cost Savings, Merger, Expense Management, Financial Discipline, Synergies
false
Operational Efficiency
Financial Services financial-services
Multiple Chart
Goldman Sachs
View slide
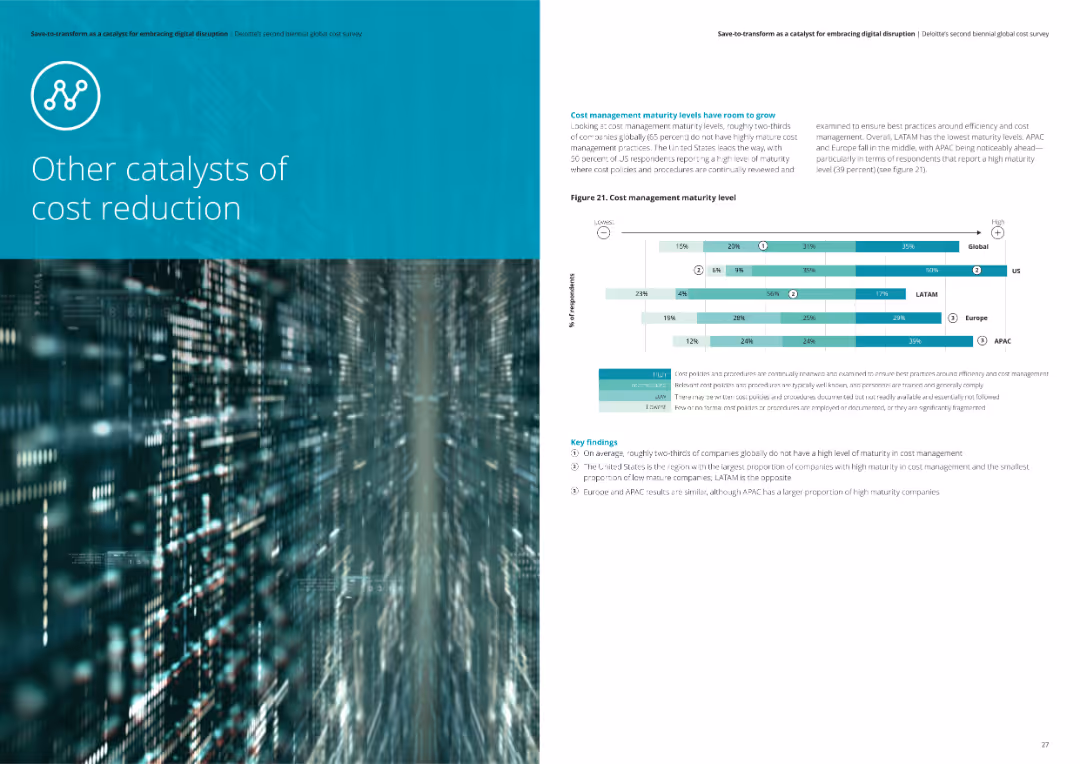
The slide displays a horizontal bar chart showing cost management maturity levels across different regions. Key findings are noted in text boxes.
Operational Efficiency
Financial Services
The slide examines the maturity levels of cost management practices globally and by region, identifying areas with low, moderate, and high maturity levels.
Cost management, maturity levels, analysis, financial services
false
Operational Efficiency
Financial Services financial-services
Mixed Chart
Deloitte
View slide
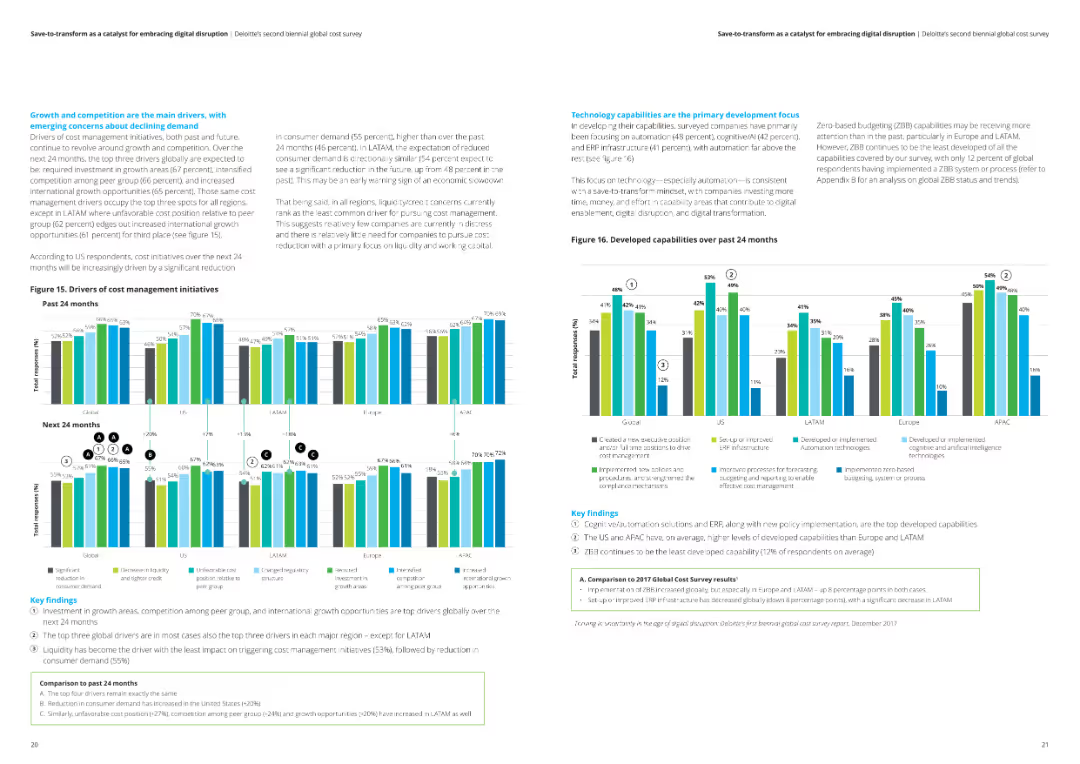
This slide has two column charts displaying drivers of cost management initiatives and developed capabilities over the past 24 months. Key findings are outlined in text boxes.
Operational Efficiency
Financial Services
The slide discusses the main drivers of cost management and the focus on developing technology capabilities over the past 24 months. Key insights are provided for each region.
Cost management, technology capabilities, drivers, analysis, financial services
false
Operational Efficiency
Financial Services financial-services
Multiple Chart
Deloitte
View slide
This slide features a line chart displaying the sensitivity of the levelized cost of energy for different energy sources to changes in the cost of capital.
Financial Performance
Energy & Utilities
The slide explores how changes in the cost of capital affect the levelized cost of energy for renewable and conventional sources, emphasizing the financial implications for energy project investments.
Cost of Capital, Energy Investment, LCOE, Sensitivity, Financial Analysis
false
Financial Performance
Energy & Utilities energy-and-utilities
Single Chart
Roland Berger
View slide
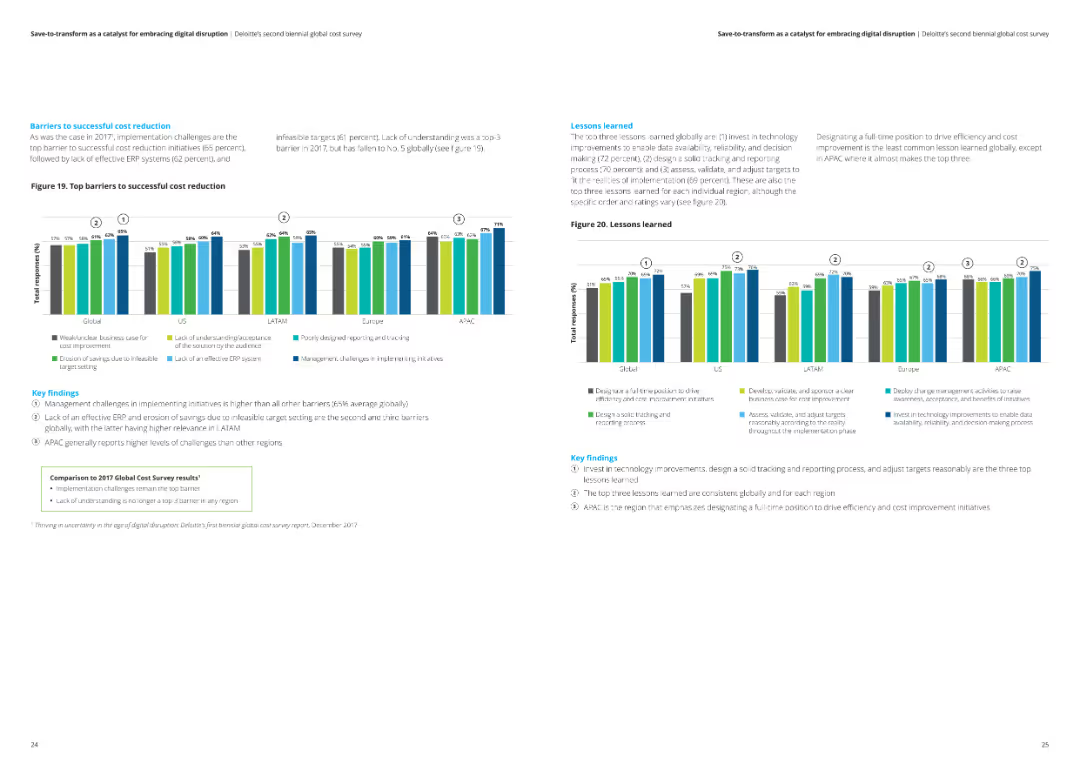
This slide includes a column chart illustrating the top barriers to successful cost reduction globally and regionally. Key findings are summarized in text boxes.
Risk Assessment and Management
Financial Services
The slide highlights the key barriers to successful cost reduction, including management challenges and ineffective ERP systems, with a comparison to the 2017 survey results.
Cost reduction, barriers, challenges, analysis, financial services
false
Risk Assessment and Management
Financial Services financial-services
Multiple Chart
Deloitte
View slide
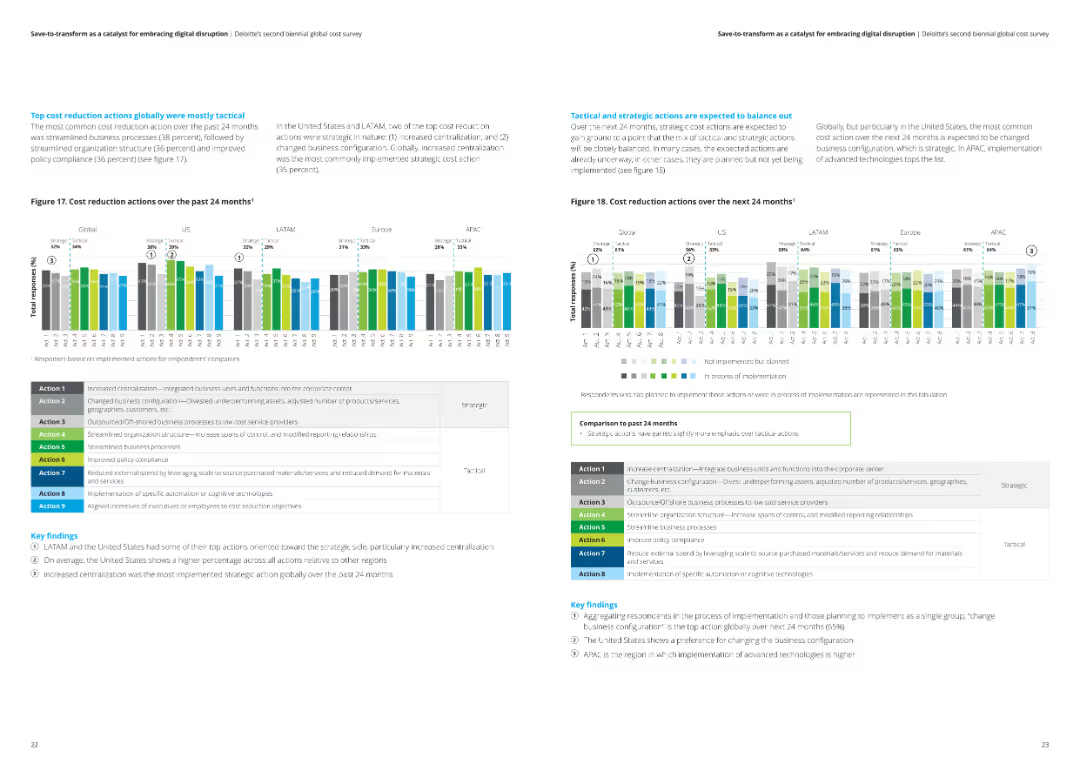
The slide features two column charts showing cost reduction actions over the past and next 24 months across different regions. Key findings are included in text boxes.
Operational Efficiency
Financial Services
The slide details tactical and strategic cost reduction actions taken in various regions over the past 24 months and projected for the next 24 months.
Cost reduction, tactical actions, strategic actions, analysis, financial services
false
Operational Efficiency
Financial Services financial-services
Multiple Chart
Deloitte
View slide
This slide consists of a column chart and a flow diagram. The chart shows a decrease in advisor loans from 2017 to 2020, marked with a downward arrow and percentage. The diagram depicts a talent development program with timelines for training and roles, using arrows and a dashed line.
Strategic Planning
Financial Services
The slide compares advisor recruitment costs and the reallocation of those funds into advisor development. It suggests a strategic shift in investing more in talent development rather than recruitment, aligning with long-term growth and operational efficiency.
Cost saving, talent development, advisor recruitment, investment strategy, training program, operational efficiency, long-term growth, financial planning, human resources, strategic shift
false
Strategic Planning
Financial Services financial-services
Multiple Chart
Morgan Stanley
View slide
This slide features a diagram illustrating potential cost savings in rail and port operations if Australia could match the efficiencies of other countries.
Strategic Planning
Transportation & Logistics
The slide proposes that reducing the cost gap in rail and port operations between Australia and other countries could save the Australian wheat export industry approximately $130 million annually, with detailed data and scenarios.
Cost savings, Australia, rail costs, port costs, wheat export, strategic planning, transportation, logistics
false
Strategic Planning
Transportation & Logistics transportation-and-logistics
Mixed Chart
LEK
View slide
Slide displays two column charts comparing cost/income ratios for 2022 and a 2025 target, alongside a breakdown of efficiency measures.
Operational Efficiency
Financial Services
Details strategies to reduce Deutsche Bank's cost-income ratio through operational efficiencies and technological improvements.
Cost-income ratio, operational efficiency, Deutsche Bank, reduction, strategy, technology
false
Operational Efficiency
Financial Services financial-services
Multiple Chart
Deutsche Bank
View slide
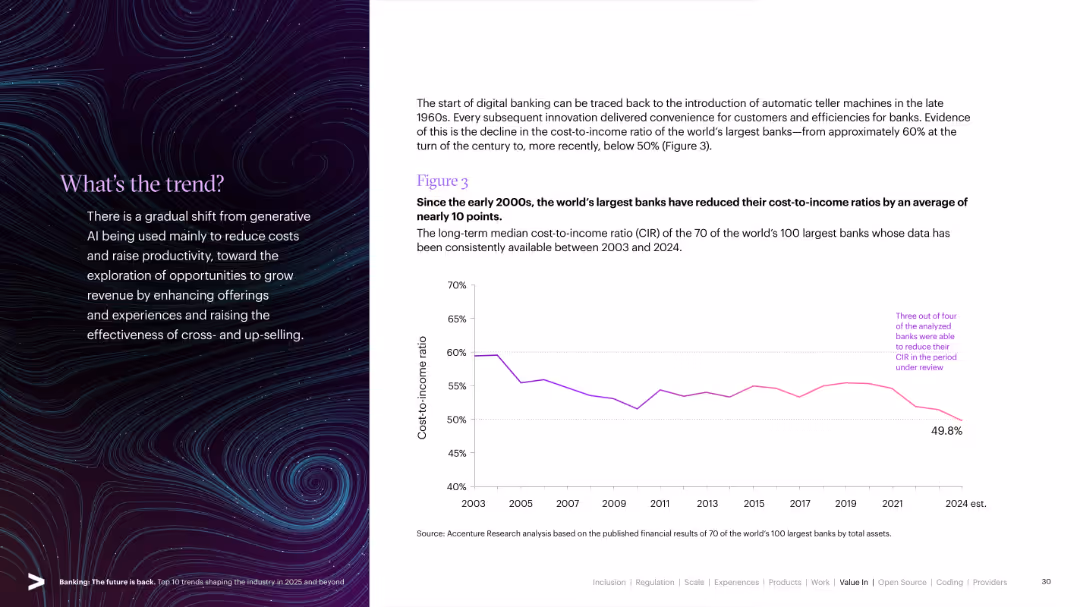
Split slide: left side has a stylized visual with text; right side features a line graph showing cost-to-income ratio trends from 2003 to 2024.
Operational Efficiency
Financial Services
Demonstrates how the world's largest banks have successfully reduced their cost-to-income ratios over two decades, highlighting improvements in digital banking and operational efficiency.
Cost-to-Income, Efficiency, Digital Banking, CIR, Banking Trends, Global Banks, Operational Metrics
false
Operational Efficiency
Financial Services financial-services
Mixed Chart
Accenture
Previous
Loading...
Hold On!
We are searching in our database
If nothing, comes up, please try different filters!
Column Chart
Heatmap
Chevron
Org Chart
Infographic
Callouts
Timeline
List
Graphic
Picture
Process Flow
Diagram
Paragraph
Map
Table
Framework
Subtitle
Takeaway Box
Icon
Other Chart
Radar Chart
Waterfall Chart
Mekko Chart
Pie Chart
Scatter Plot
Line Chart
Bar chart
Bullet points
Create a FREE account to continue browsing
Receive Instant Access to 1,000+ slides from companies like McKinsey, Google, and Goldman Sachs
First Name
Last Name
Email
Password
I agree to all
Terms & Privacy Policy
Thank you! Your submission has been received!
Oops! Something went wrong while submitting the form.
Have an account?
Sign in
Upgrade to PRO to Save slides
Advanced Search and Filters
Access to 15,000+ slides
Access to Category Pages
Save/Bookmark Slides
PowerPoint Template Library
Pick a Plan
MONTHLY
$12/month
Billed every month, Cancel anytime.
YEARLY
$9/year
Billed $108 annually, Cancel anytime.
Checkout for $12/month
Checkout for $108/yr
Secured by Stripe | AES-256 bit encryption