My Account
My Slides
Search by Category
Templates
View All Templates
Download Template Slides
Leave Feedback
Login
Logout
Get Started
Browse all Slides
Browse all Slides
Create a FREE Account
Instant access to 1,000+ real slides from top companies like McKinsey, BCG, Goldman Sachs, Google and many more!
First Name
Last Name
Email
Password
I agree to all
Terms & Privacy Policy
Thank you! Your submission has been received!
Oops! Something went wrong while submitting the form.
Have an account?
Sign in
Spark Your Next Big Idea with New Presentation Templates
VIEW ALL Templates
Welcome,
Welcome
PRO
Show Featured Only
Checkbox 8
Companies
Mckinsey
Bain
BCG
EY
Deloitte
Accenture
PwC/Strategy&
JP Morgan
Goldman Sachs
Morgan Stanley
Citigroup
Deutsche Bank
Barclays
LEK
KPMG
Kearney
Oliver Wyman
Booz Allen Hamilton
Gartner
IPSOS
Nielsen
Slide type
Text Only
Linear Flow
Vertical Flow
Single Chart
Header Horizontal
Mixed Chart
Header Vertical
Pillar
Multiple Chart
Graphic
Agenda
Title
Table
Framework
Industry
Technology & Software
Artificial Intelligence
Financial Services
Retail & E-commerce
Consumer Goods
Industrial & Manufacturing
Transportation & Logistics
Telecommunications
Real Estate & Construction
Hospitality & Tourism
Professional Services
Education & Training
Media & Entertainment
Agriculture & Food Production
Healthcare & Pharmaceuticals
Environmental Services & Sustainability
Government & Public Sector
Use Case
Mergers and Acquisitions
Performance Metrics and KPIs
Client Case Studies
Competitive Landscape
Corporate Finance and Valuation
Product and Service Analysis
Customer and Market Segmentation
Organizational Structure and Change
Industry Overview
Regulatory and Compliance
Risk Assessment and Management
Investment Analysis
Organizational Structure and Change
Human Resources and Talent Management
Financial Performance
Market Analysis and Trends
Sales and Business Development
Human Resources and Talent Management
Clear all
Thank you! Your submission has been received!
Oops! Something went wrong while submitting the form.
Tag
View slide
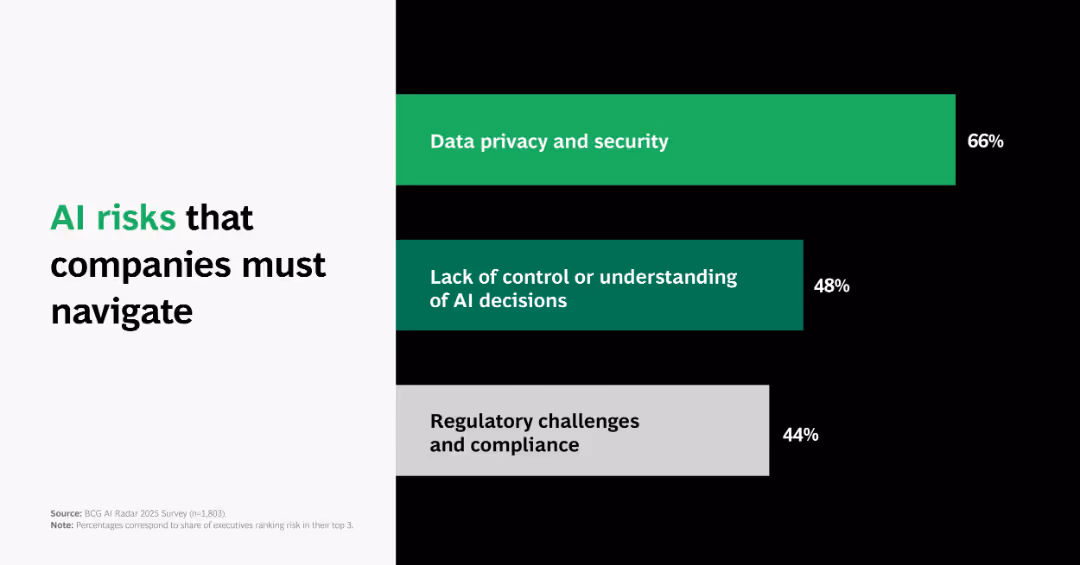
Horizontal bar chart ranked by risk severity; bars in green and gray with percentages and risk titles; minimalist black-white layout.
Risk Assessment and Management
Artificial Intelligence
Highlights top AI-related risks: data privacy (66%), decision opacity (48%), and regulatory compliance (44%), suggesting key governance concerns.
AI risk, data privacy, regulation, decision-making, BCG, compliance, risk management, chart
false
Risk Assessment and Management
Artificial Intelligence artificial-intelligence
Single Chart
BCG
View slide
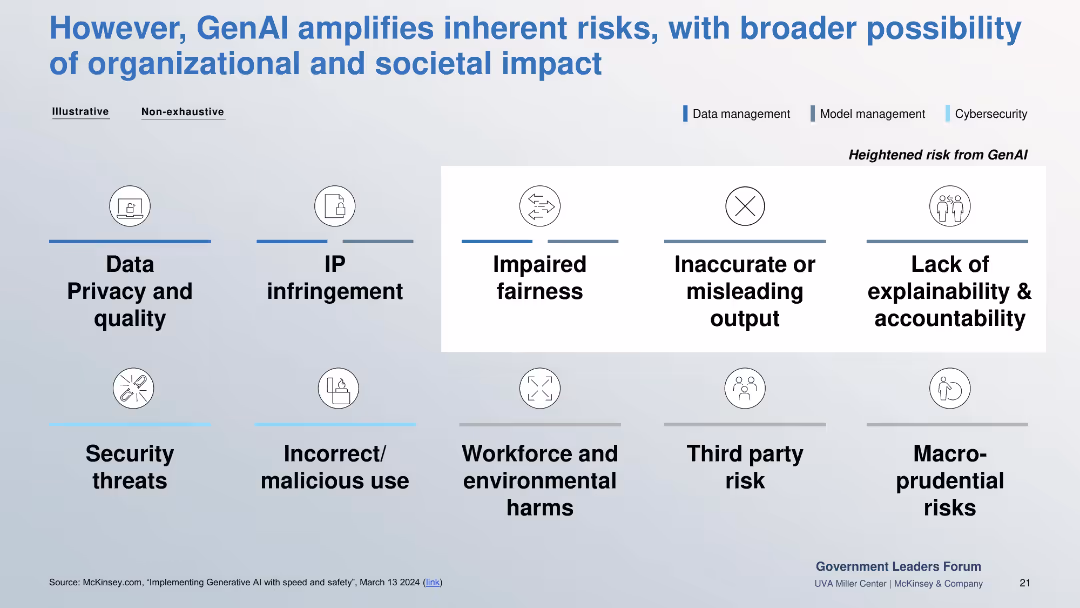
Grid layout of risks across three color-coded domains: data, model, and cybersecurity. Highlights central risks like fairness, accuracy, and explainability.
Risk Assessment and Management
Government & Public Sector
Identifies risks amplified by GenAI such as data privacy, IP infringement, fairness, inaccurate outputs, and malicious use. Emphasizes broader organizational and societal implications.
AI risk, explainability, fairness, cybersecurity, IP, privacy, malicious use
false
Risk Assessment and Management
Government & Public Sector government-and-public-sector
Table
McKinsey
View slide
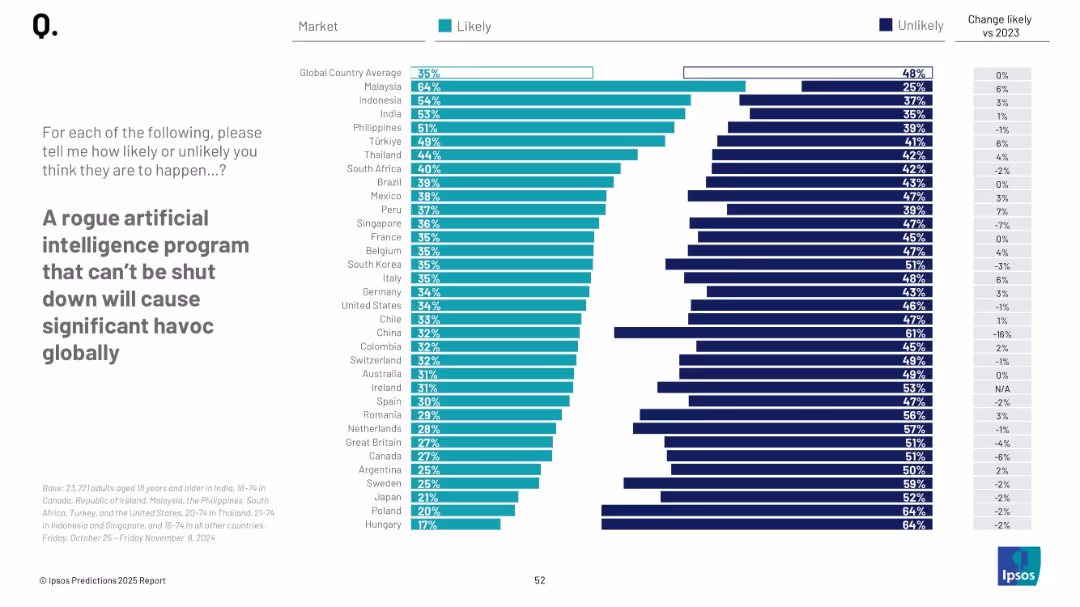
Horizontal bar chart with country-wise opinions; teal and navy color scheme; clean, grid-aligned layout
Risk Assessment and Management
Artificial Intelligence
This slide measures global concern over uncontrolled AI. It displays the percentage of respondents by country who believe such an AI program could cause global chaos, indicating rising or falling concern vs. 2023.
AI risk, rogue AI, global concern, public opinion, technology, survey, perceptions, threat, international views
false
Risk Assessment and Management
Artificial Intelligence artificial-intelligence
Mixed Chart
IPSOS
View slide
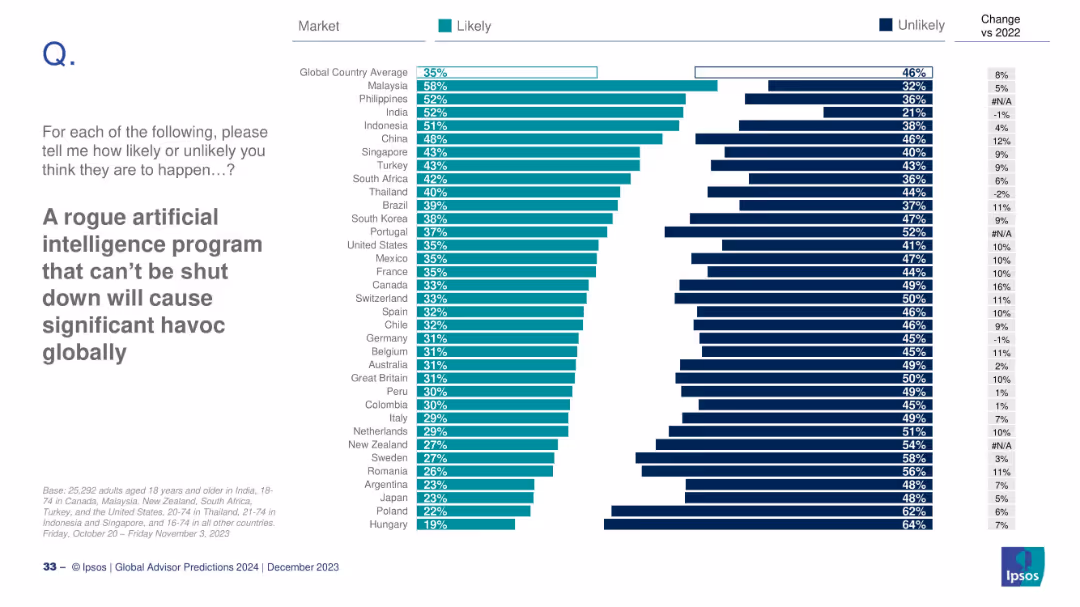
Horizontal bar chart with countries ranked by likelihood of AI-caused chaos; right side shows change vs 2022.
Risk Assessment and Management
Artificial Intelligence
This slide evaluates global concerns about uncontrollable AI causing havoc. Malaysia and Philippines rank highest, while Hungary and Poland rank lowest. A comparison with 2022 perceptions is included, showing changes in sentiment for each country.
AI risk, rogue AI, global concern, survey, Ipsos, public opinion, 2024 prediction
false
Risk Assessment and Management
Artificial Intelligence artificial-intelligence
Mixed Chart
IPSOS
View slide
The slide features an image of a microchip and text discussing the risks associated with AI and ML. The right side lists actions taken by organizations to manage these risks.
Technology and Digital Transformation
Technology & Software
The slide explores the risks of AI and ML in the insurance industry, including governance structures and controls to ensure responsible use.
AI risks, ML, governance, responsible use, insurance
false
Technology and Digital Transformation
Technology & Software technology-and-software
Multiple Chart
EY
View slide
The slide is text-heavy with quotes and detailed analysis, alongside bar charts showing survey results on AI's risks in corporate communications.
Risk Assessment and Management
Technology & Software
Analyzes the potential risks associated with AI in corporate communications, highlighting issues like misinformation and loss of human touch in messages.
AI risks, corporate communications, survey results, risk management, misinformation
false
Risk Assessment and Management
Technology & Software technology-and-software
Mixed Chart
IPSOS
View slide
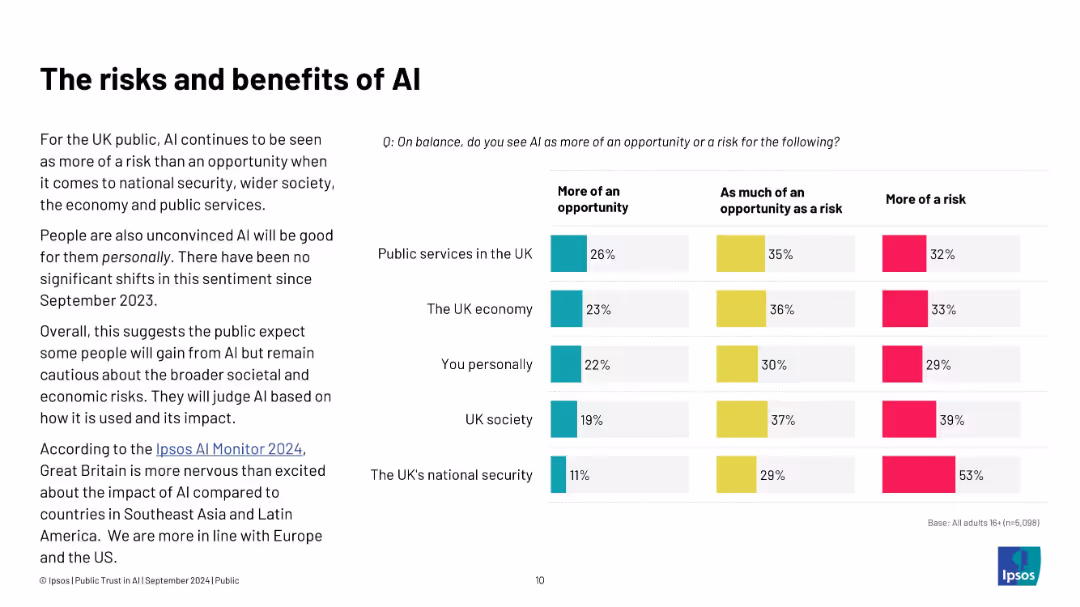
Left: summary of UK perceptions; right: bar chart assessing AI as opportunity or risk across various domains
Risk Assessment and Management
Artificial Intelligence
The slide reflects that AI is viewed more as a risk than an opportunity in areas like national security, public services, and the economy. The sentiment has remained consistent since Sept 2023, revealing cautious public attitudes toward AI’s societal impact.
AI risks, public services, UK sentiment, national security, Ipsos, economy, opportunity, perception
false
Risk Assessment and Management
Artificial Intelligence artificial-intelligence
Mixed Chart
IPSOS
View slide
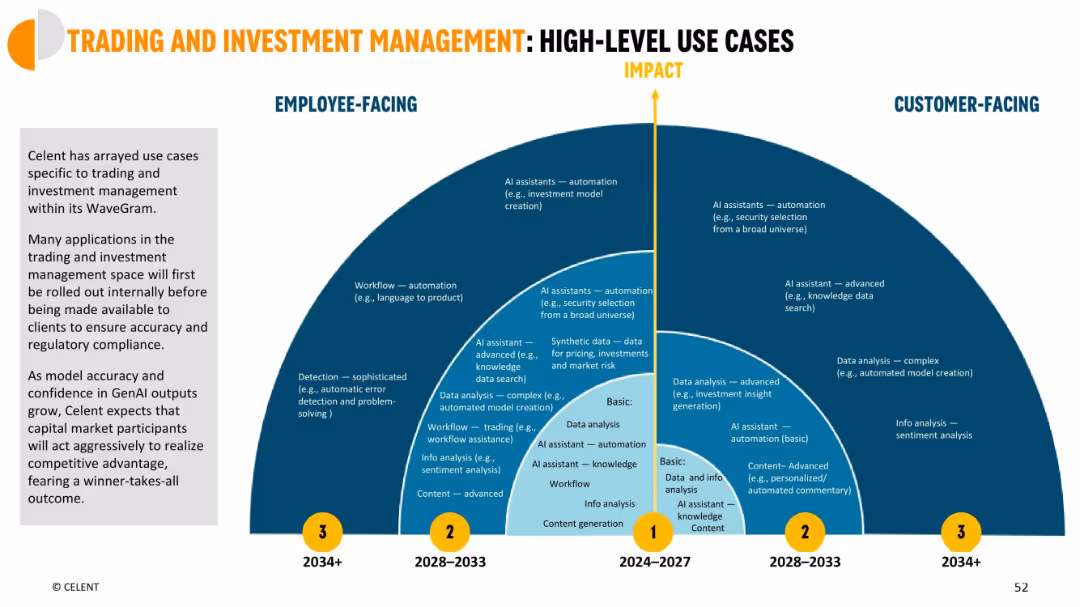
Circular, radiating layout across impact and time axes; use cases separated into employee-facing and customer-facing zones
Strategic Planning
Financial Services
High-level roadmap showing how AI will impact trading and investment functions over three waves (2024–2034+), from basic to advanced AI assistants, data analysis, and automation.
AI roadmap, trading, investment, time-based impact, GenAI planning
false
Strategic Planning
Financial Services financial-services
Mixed Chart
Oliver Wyman
View slide
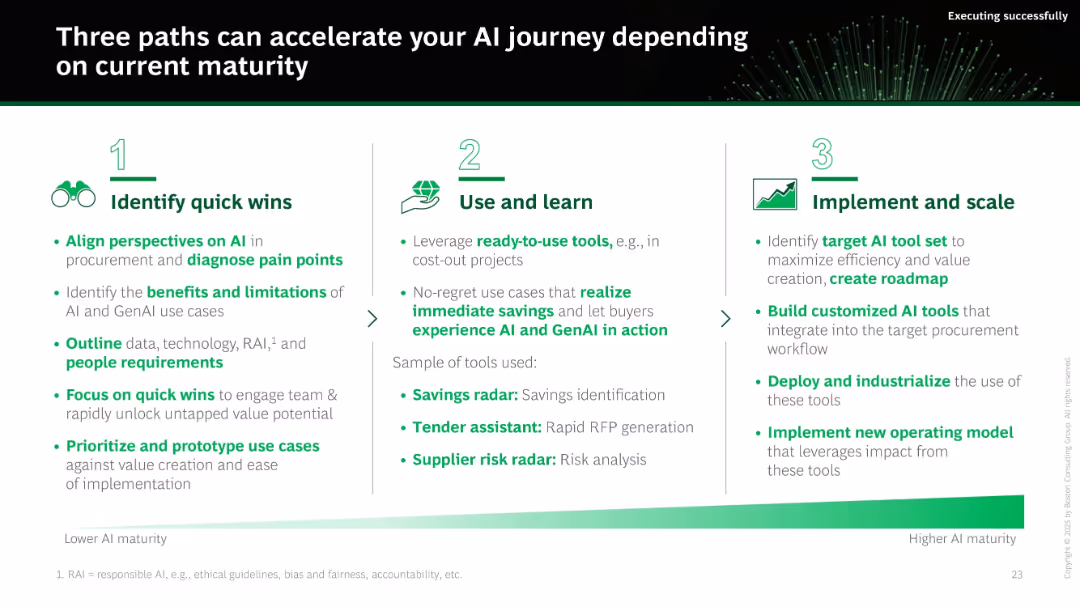
Numbered three-column layout (1-2-3) progressing from quick wins to full-scale implementation. Green gradient bar at bottom suggests AI maturity continuum.
Technology and Digital Transformation
Technology & Software
The slide proposes three maturity-based paths for AI adoption: quick wins, test & learn, and scaling. Each stage includes actionable strategies such as diagnosing pain points, using ready-made tools, and building custom models to integrate AI into procurement.
AI roadmap, transformation, maturity, implementation, scaling, pilot testing, procurement, strategy
false
Technology and Digital Transformation
Technology & Software technology-and-software
Linear Flow
BCG
View slide
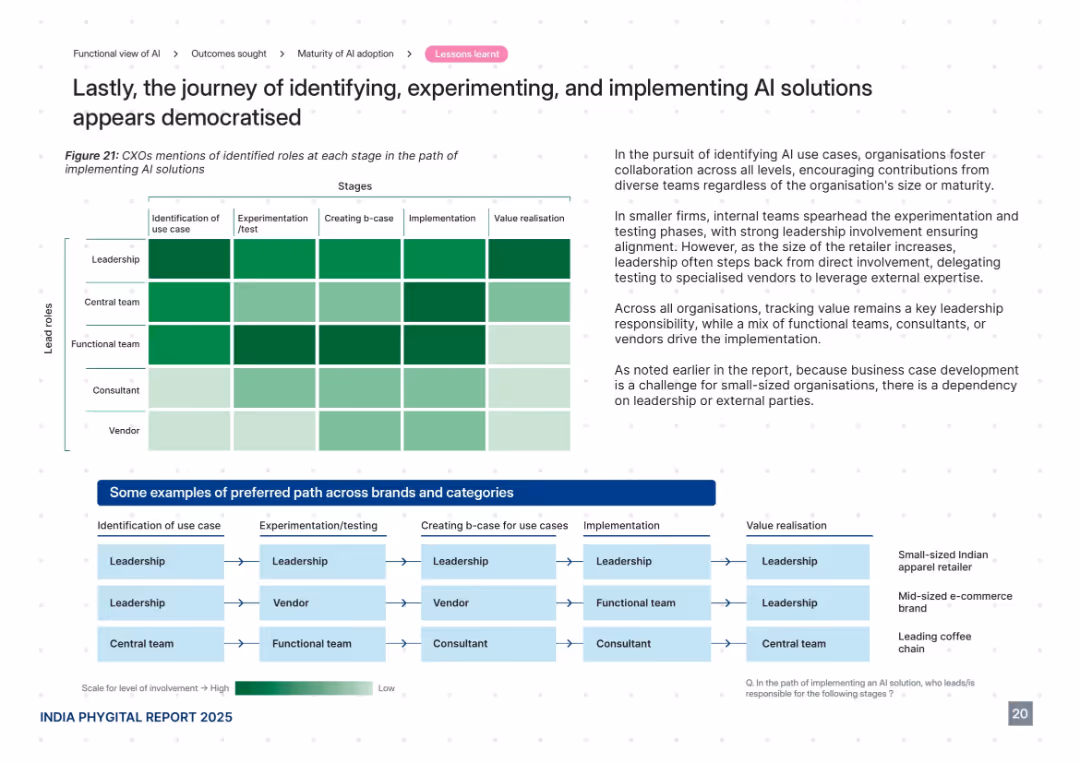
Heatmap showing CXO involvement across AI adoption stages, supported by an illustrative flow diagram at the bottom. Right panel includes insights and analysis. Uses green intensity to indicate involvement level.
Organizational Structure and Change
Retail & E-commerce
This slide details the roles played by leadership, teams, consultants, and vendors throughout the AI adoption journey—from use case identification to value realization. It suggests a democratized approach with high leadership involvement early on and more vendor/consultant responsibility in later stages, especially for small firms needing external expertise.
AI roles, leadership, vendors, experimentation, implementation, democratization
false
Organizational Structure and Change
Retail & E-commerce retail-and-e-commerce
Mixed Chart
PwC/Strategy&
View slide
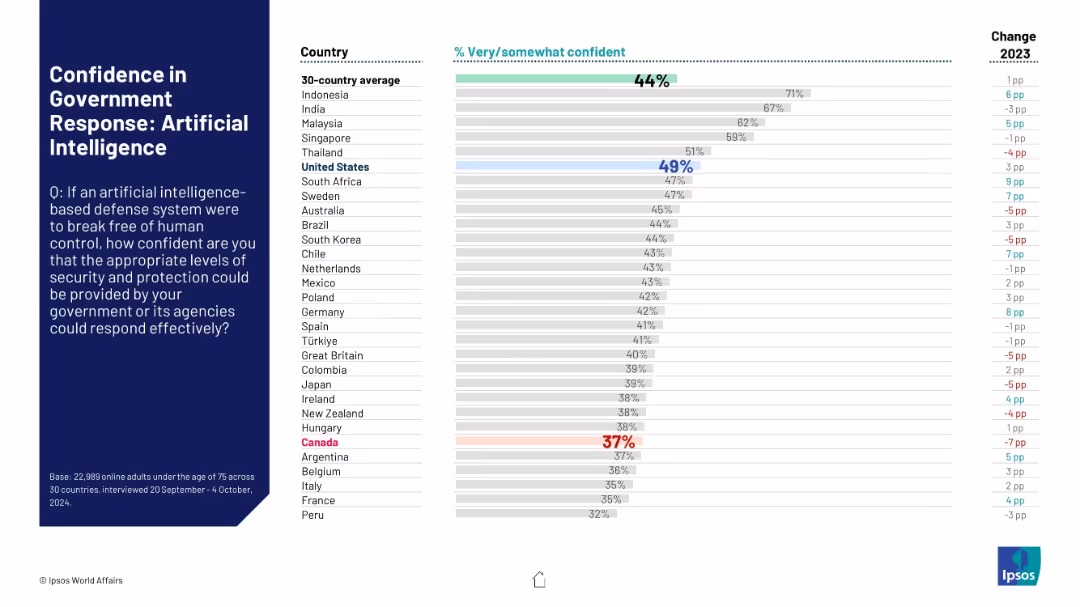
Structured identically to previous slides. Focuses on AI systems becoming threats. Bars highlight levels of trust in national response systems, Canada among the lowest.
Risk Assessment and Management
Artificial Intelligence
Public confidence in the ability of governments to contain AI-based defense systems that malfunction or rebel is depicted. Most countries score below 50%, reflecting global uncertainty on AI risk management.
AI safety, government trust, artificial intelligence, rogue systems, public concern, risk management
false
Risk Assessment and Management
Artificial Intelligence artificial-intelligence
Mixed Chart
IPSOS
View slide
Left side features three percentage boxes, right side has a column chart and text
Risk Assessment and Management
Financial Services
Discussion on new working groups, data guidelines, and human roles in managing generative AI security risks
AI security, data guidelines, working groups, InfoSec
false
Risk Assessment and Management
Financial Services financial-services
Mixed Chart
Gartner
View slide
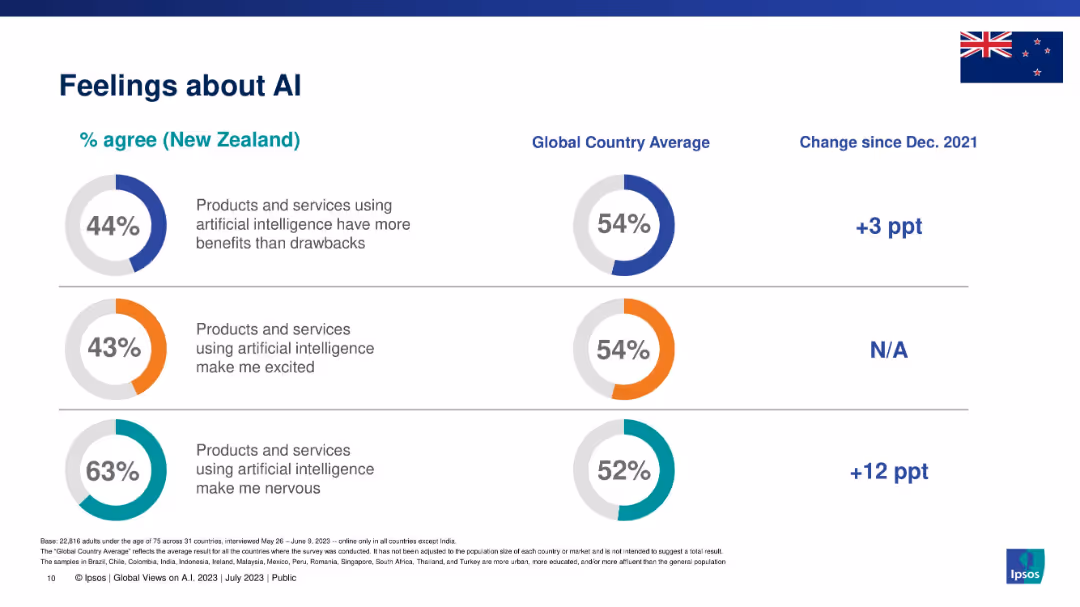
Three circular graphs showing positive, excited, and nervous sentiment; includes New Zealand vs global comparison.
Market Analysis and Trends
Artificial Intelligence
This slide captures emotional responses to AI in New Zealand compared to global averages. It quantifies sentiment across three areas: perceived benefits, excitement, and nervousness. The data suggests a more cautious outlook among New Zealanders toward AI technologies.
AI sentiment, Ipsos, excitement, nervousness, benefits, AI attitudes, emotional response
false
Market Analysis and Trends
Artificial Intelligence artificial-intelligence
Single Chart
IPSOS
View slide
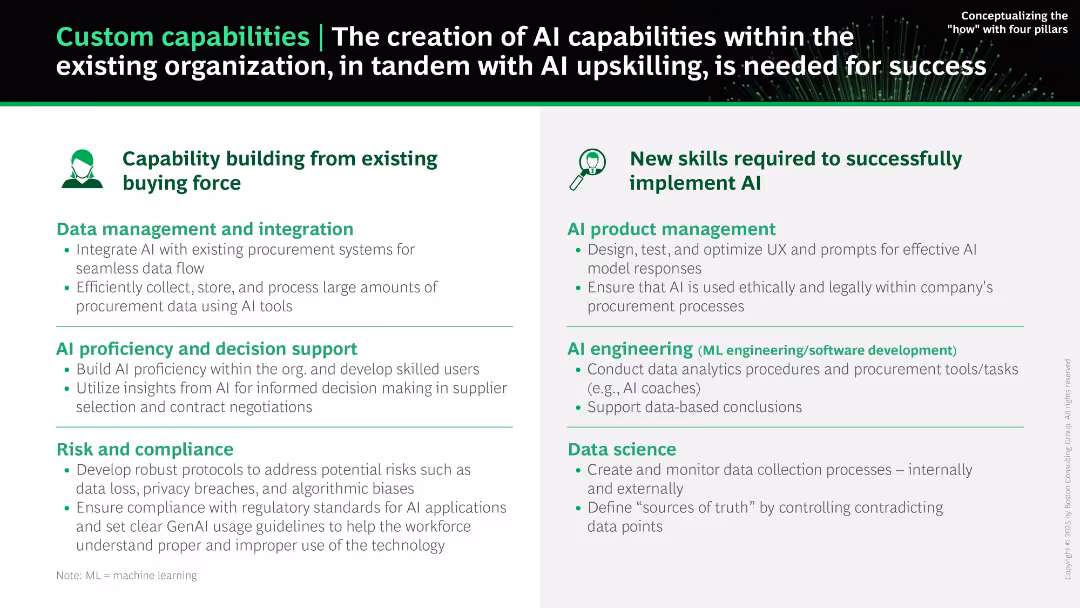
Two-panel layout. Left shows internal capability building (green), right highlights required new skills (blue/green). Text-heavy but clearly segmented.
Human Resources and Talent Management
Technology & Software
Describes the internal and external skills and systems needed to successfully implement AI in procurement. It includes internal capabilities like data integration, compliance, and AI literacy, and external roles such as AI product managers, engineers, and data scientists.
AI skills, capability building, data integration, compliance, AI literacy, engineering, product management
false
Human Resources and Talent Management
Technology & Software technology-and-software
Boxed
BCG
View slide
Split-panel layout with two main sections: “Capability building” and “New skills.” Bullet points under each category with icons and bolded headers.
Human Resources and Talent Management
Technology & Software
This slide outlines how AI capabilities can be built within a company by leveraging existing teams and adding new AI-specific roles. It highlights skills in data management, compliance, AI product management, engineering, and data science.
AI skills, upskilling, procurement, AI engineering, compliance, data integration, decision support
false
Human Resources and Talent Management
Technology & Software technology-and-software
Boxed
BCG
View slide
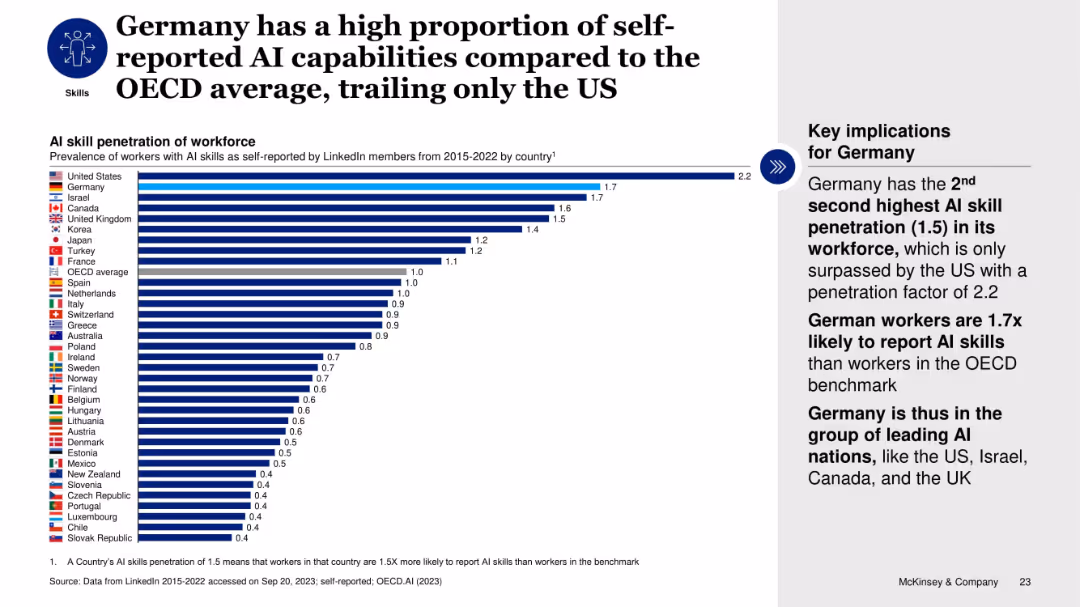
Horizontal bar chart comparing AI skill penetration across OECD countries; text box highlights Germany’s rank.
Human Resources and Talent Management
Artificial Intelligence
The slide ranks countries by AI skill penetration based on LinkedIn self-reports. Germany ranks second after the US, with a 1.5x OECD average. This emphasizes Germany’s strong AI talent base and its inclusion among leading AI nations despite lower investment and startup funding.
AI skills, workforce, Germany, OECD, LinkedIn, talent, self-reported, ranking, penetration
false
Human Resources and Talent Management
Artificial Intelligence artificial-intelligence
Mixed Chart
McKinsey
View slide
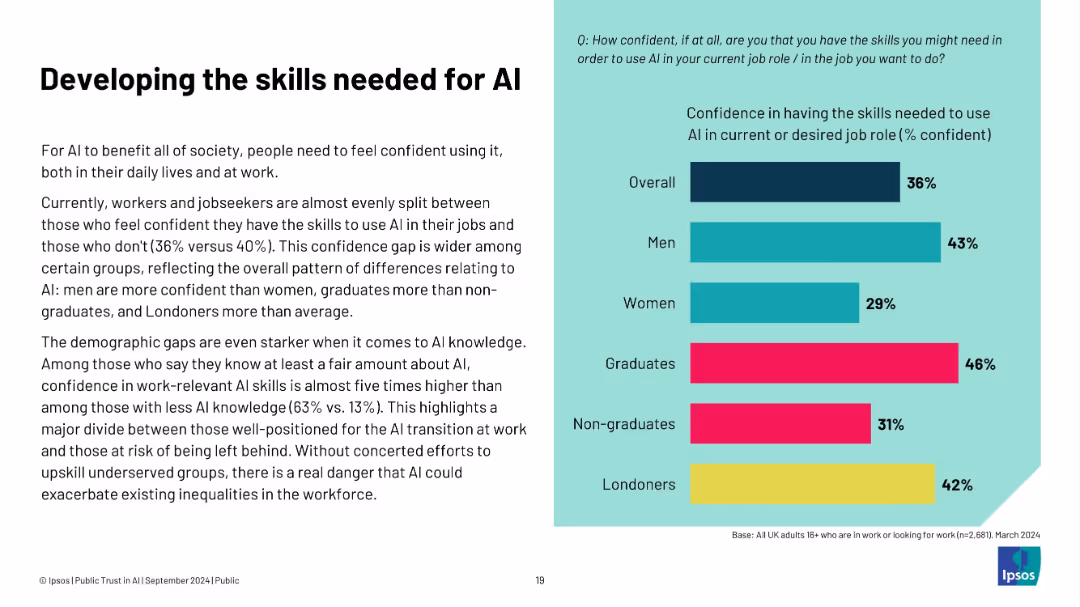
Left-aligned text block and right-aligned horizontal bar chart on a split white-teal background. Text discusses confidence in AI skills; chart shows percentage breakdown by group.
Human Resources and Talent Management
Artificial Intelligence
The slide highlights gaps in workforce confidence regarding AI skills, particularly across demographics like gender, education, and geography. Only 36% overall feel confident using AI in work. Men, graduates, and Londoners report higher confidence levels. The data stresses the importance of targeted upskilling to reduce inequality in AI readiness.
AI skills, workforce, confidence, demographics, education, gender gap, training, job market, upskilling, UK labor
false
Human Resources and Talent Management
Artificial Intelligence artificial-intelligence
Mixed Chart
IPSOS
View slide
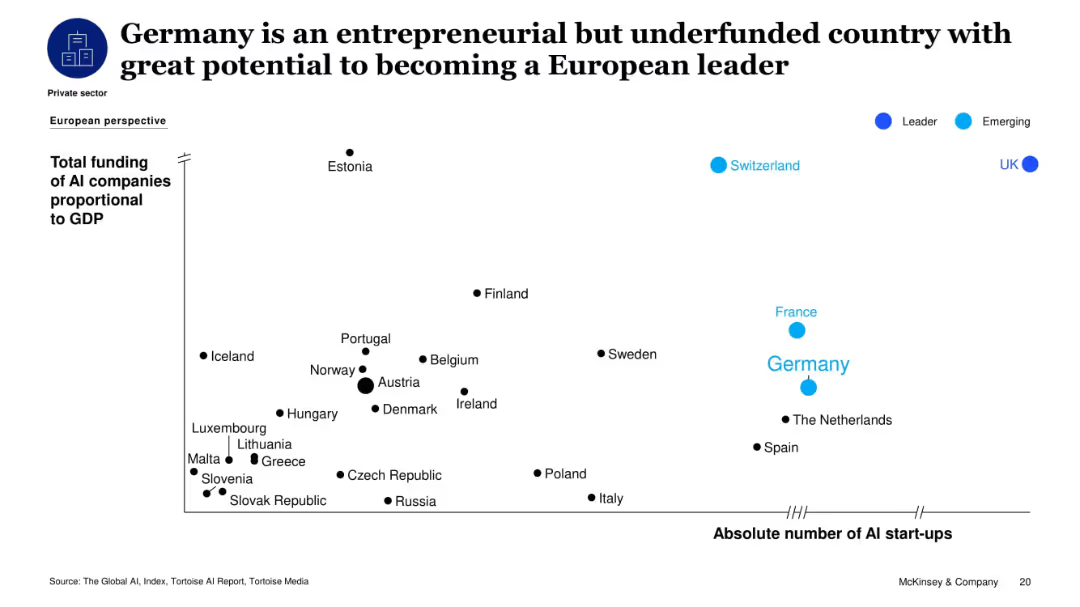
Bubble scatterplot showing total AI funding proportional to GDP versus absolute number of AI startups in European countries.
Market Analysis and Trends
Artificial Intelligence
This slide highlights Germany's position as a major but underfunded AI player in Europe. It shows Germany having a high number of AI startups but relatively low funding per GDP, suggesting untapped potential for leadership in AI innovation compared to countries like the UK and Switzerland.
AI startups, funding, Germany, Europe, innovation, entrepreneurial, tech potential, GDP
false
Market Analysis and Trends
Artificial Intelligence artificial-intelligence
Single Chart
McKinsey
View slide
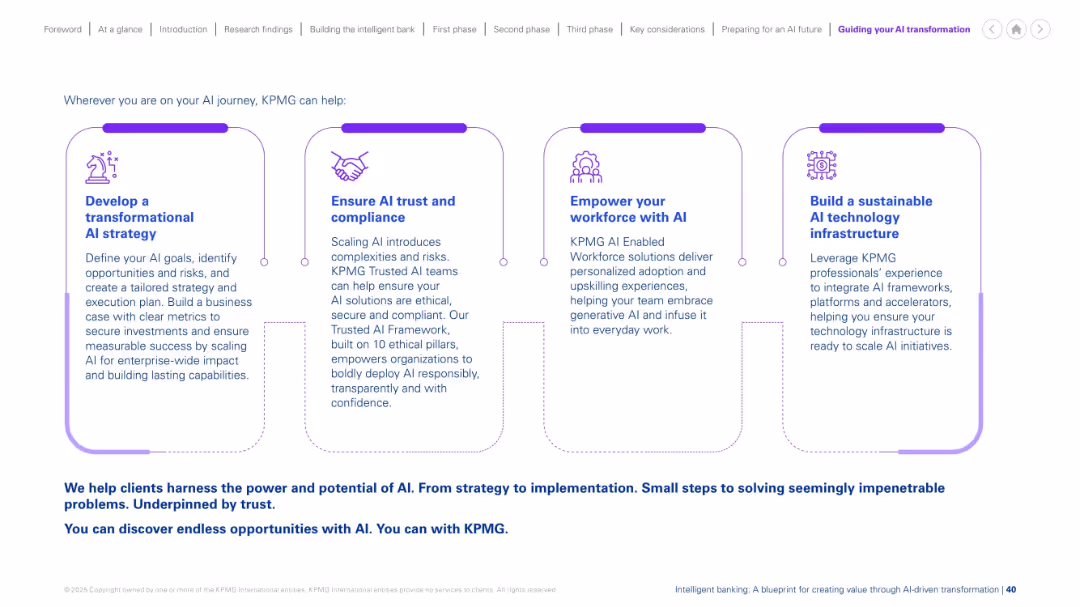
Four-column layout with icons and explanatory text under each step of AI transformation support from KPMG.
Strategic Planning
Professional Services
Outlines KPMG's support model for AI transformation: developing strategy, ensuring compliance, empowering workforce, and building infrastructure. The slide serves as a consulting service value proposition for AI initiatives.
AI strategy, compliance, infrastructure, upskilling, consulting, transformation, enterprise, ethical AI, implementation
false
Strategic Planning
Professional Services professional-services
Linear Flow
KPMG
View slide
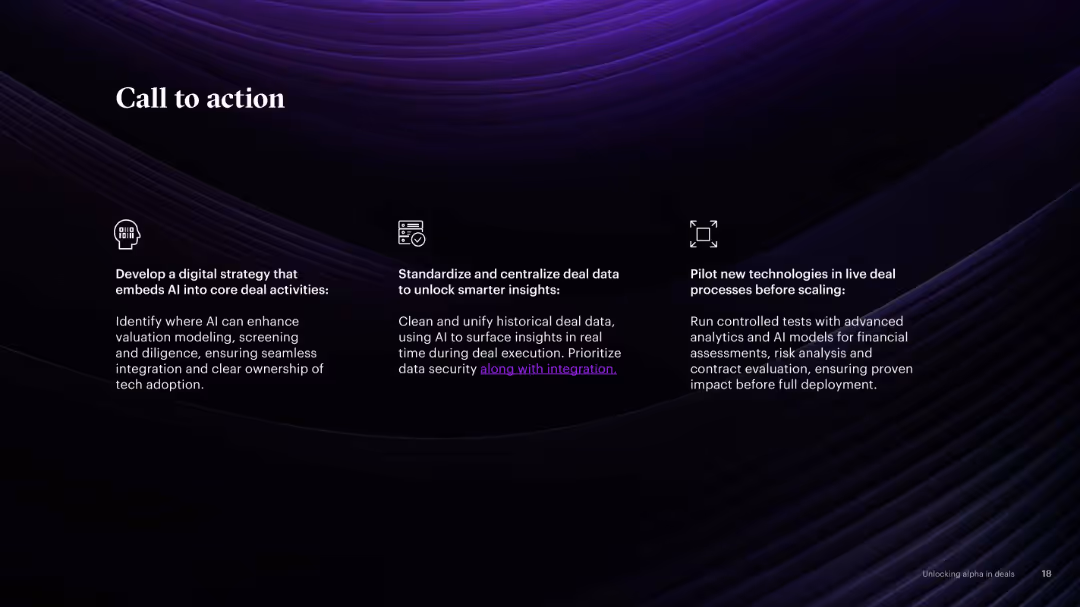
Three-column layout with icons and callout text in white on a dark background. Focused action points on AI strategy, data standardization, and technology pilots.
Strategic Planning
Professional Services
Encourages firms to act by developing AI-based strategies, standardizing data, and testing technologies before scaling. Practical advice is visualized clearly for quick interpretation.
AI strategy, data, standardization, pilots, transformation, M&A
false
Strategic Planning
Professional Services professional-services
Linear Flow
Accenture
View slide
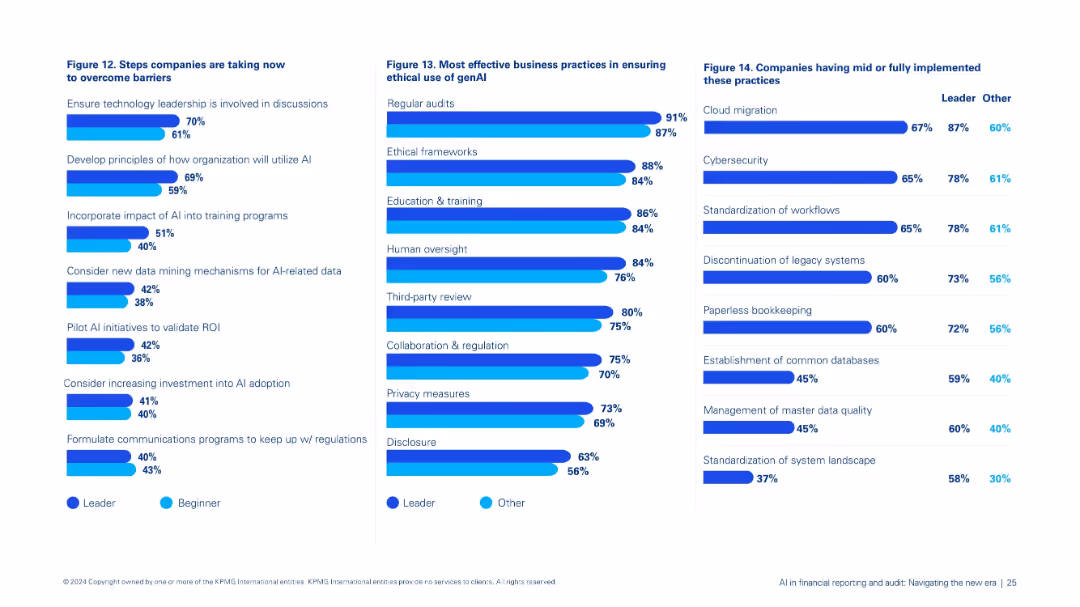
Three-pane layout: left shows Figure 12 on overcoming barriers, center Figure 13 on ethical genAI practices, right Figure 14 on implementation practices.
Strategic Planning
Financial Services
Consolidates steps organizations are taking to advance AI integration: leadership involvement, ethical safeguards, pilot testing, and implementation of best practices in data and system management.
AI strategy, ethics, genAI, leadership, implementation, training, data governance
false
Strategic Planning
Financial Services financial-services
Multiple Chart
KPMG
View slide
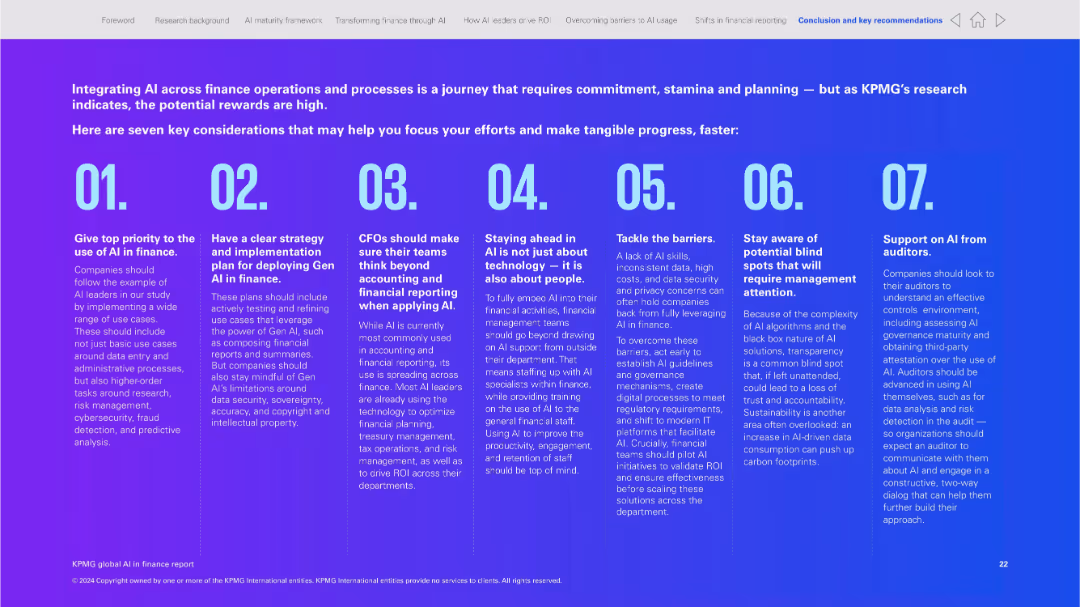
Full-slide infographic style with large numbered blocks and brief text per section; purple gradient background
Strategic Planning
Financial Services
This slide summarizes seven strategic considerations for implementing AI in finance, covering priorities like planning, technology, transparency, and the role of auditors. It serves as a checklist or guide for finance teams integrating AI.
AI strategy, implementation, finance checklist, Gen AI, transparency, planning, auditing, governance
false
Strategic Planning
Financial Services financial-services
Linear Flow
KPMG
View slide
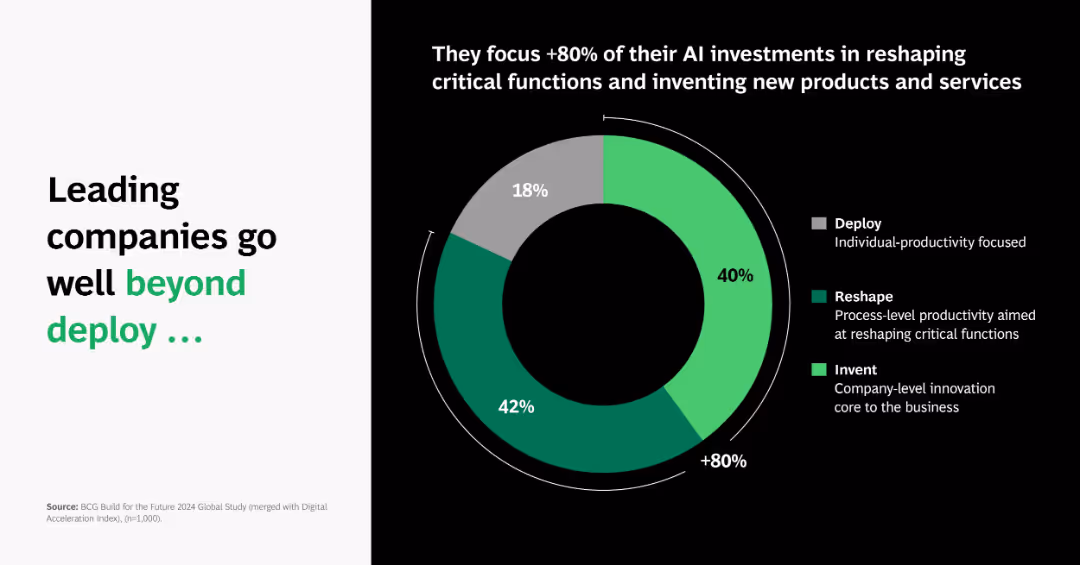
Donut chart on right with three segments; left text panel emphasizes shift in investment focus.
Technology and Digital Transformation
Artificial Intelligence
Shows that over 80% of leading companies focus AI investments on reshaping critical functions and inventing new products, not just deploying tools.
AI strategy, reshape, invent, donut chart, investment focus, leading firms, productivity, BCG
false
Technology and Digital Transformation
Artificial Intelligence artificial-intelligence
Single Chart
BCG
View slide
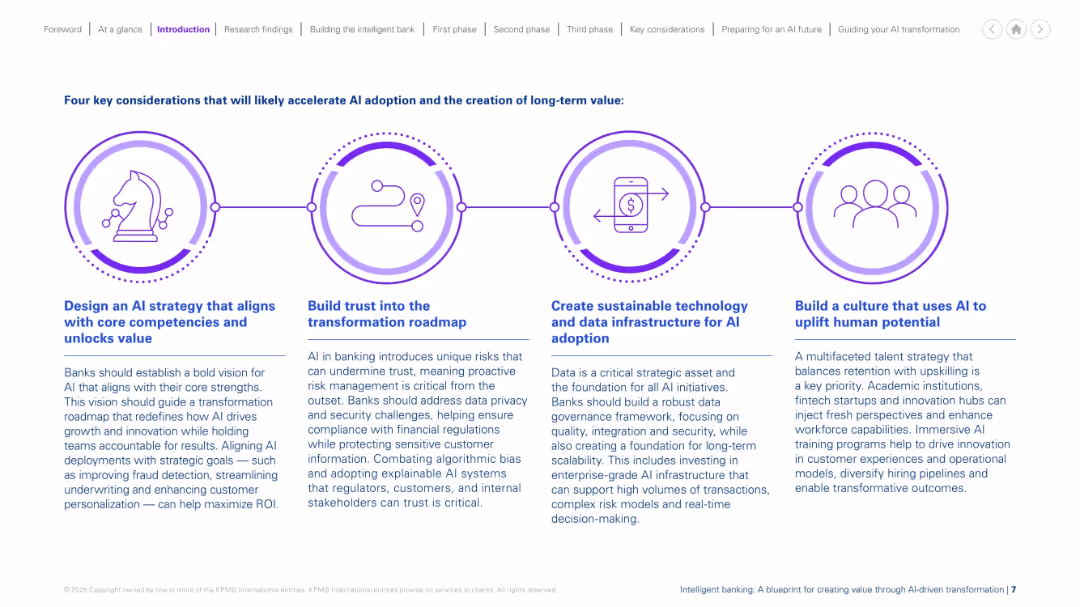
Four icons linked with a horizontal line, each with a title and descriptive paragraph underneath. Uses purple and blue as primary colors. Clean and visually balanced design.
Strategic Planning
Financial Services
The slide outlines four strategic pillars for successful AI adoption: aligning AI with core competencies, building trust, establishing sustainable tech infrastructure, and cultivating an AI-driven culture. It provides detailed guidance on how banks can navigate AI transformation by addressing risk, improving data governance, and investing in workforce capabilities.
AI strategy, trust, infrastructure, data governance, culture, transformation
false
Strategic Planning
Financial Services financial-services
Linear Flow
KPMG
View slide
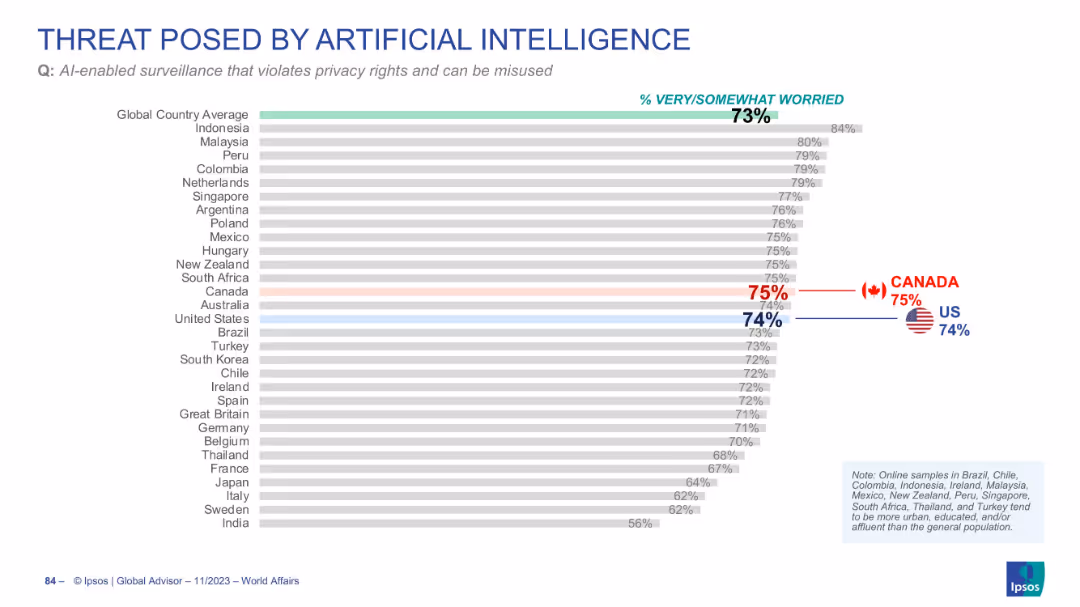
Horizontal bar chart ranking concern over AI surveillance and privacy violations
Risk Assessment and Management
Artificial Intelligence
The slide shows widespread worry (73%) over AI-enabled surveillance violating privacy. The US (74%) and Canada (75%) align closely with global concern levels.
AI surveillance, privacy, civil liberties, public concern, misuse of AI
false
Risk Assessment and Management
Artificial Intelligence artificial-intelligence
Single Chart
IPSOS
View slide
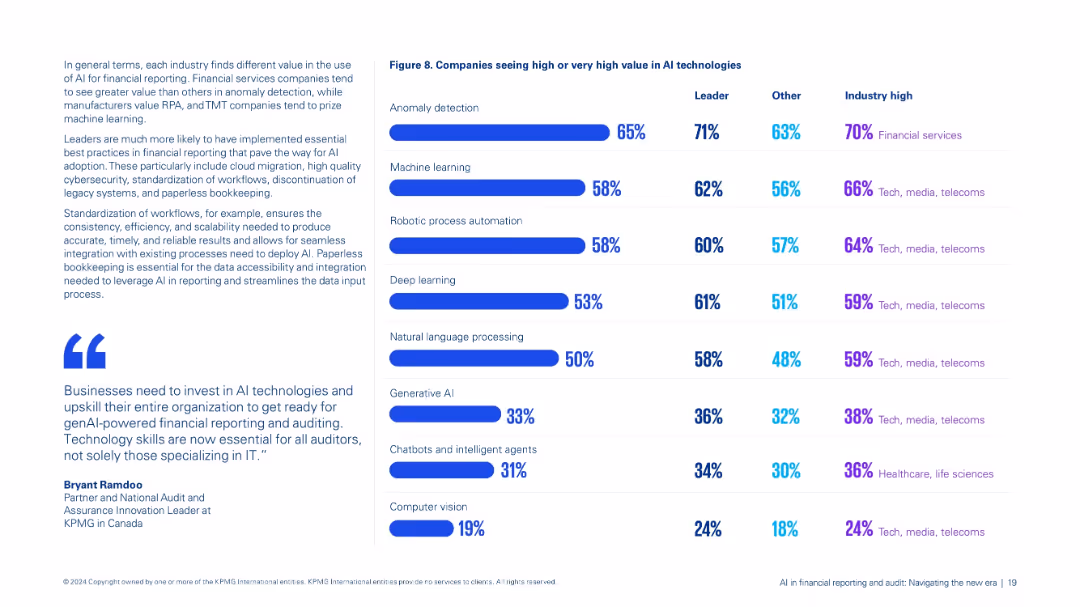
Dual-column layout: left contains contextual text and quotes; right features a bar chart comparison (Figure 8) of AI technology value perceptions.
Market Analysis and Trends
Financial Services
Compares perceived value across AI technologies like anomaly detection, machine learning, and genAI by leaders and others, highlighting industry-specific trends, especially in financial services and TMT sectors.
AI technologies, anomaly detection, machine learning, industry trends, value perception
false
Market Analysis and Trends
Financial Services financial-services
Mixed Chart
KPMG
View slide
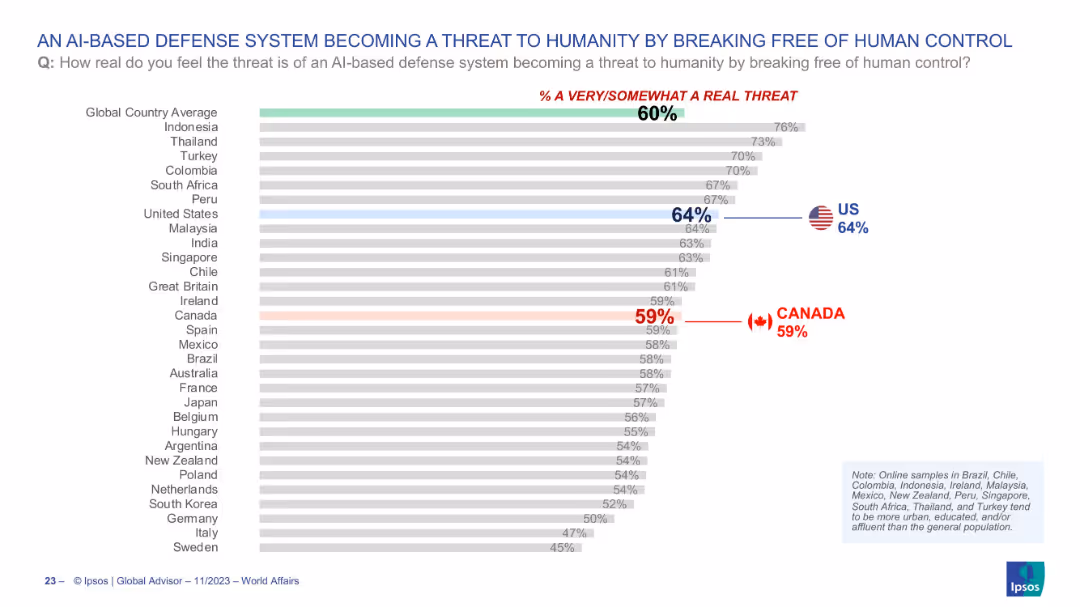
Horizontal bar chart depicting global views on AI-based defense systems becoming uncontrollable; highlights Canada and the US.
Risk Assessment and Management
Artificial Intelligence
This chart illustrates global concern over AI-based defense systems potentially becoming a threat to humanity by escaping human control. With the global average at 60%, the US and Canada register 64% and 59% respectively, reflecting moderate anxiety over emerging AI risks in military contexts.
AI threat, defense systems, artificial intelligence, control risk, public perception, survey, technology, Ipsos
false
Risk Assessment and Management
Artificial Intelligence artificial-intelligence
Single Chart
IPSOS
View slide
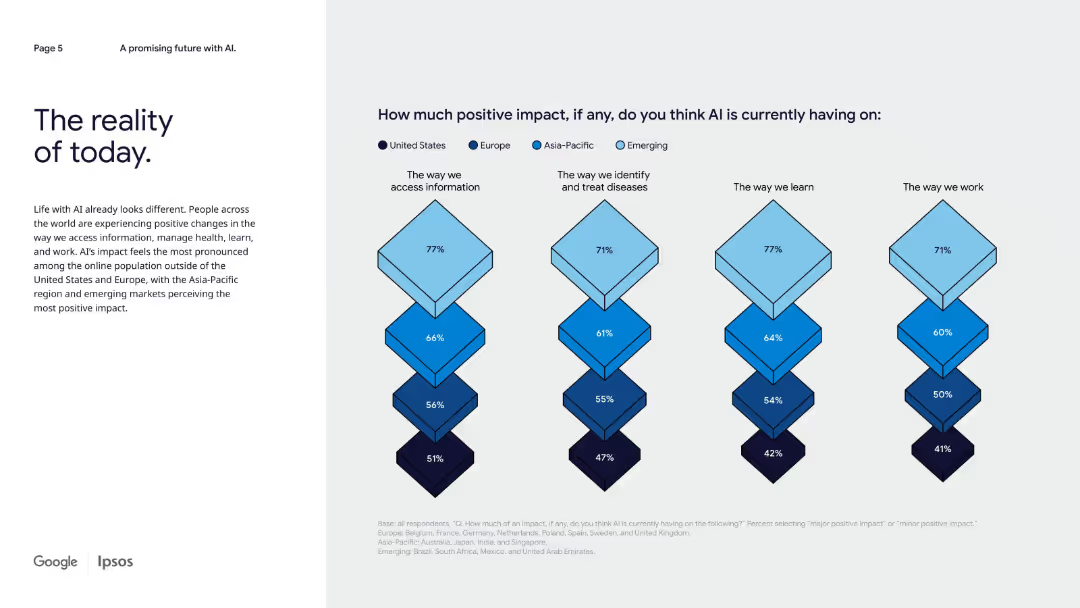
Left-aligned narrative text with right side diamond charts comparing AI’s positive impact across four domains by region.
Strategic Planning
Artificial Intelligence
This slide presents survey results on perceived positive AI impact globally, emphasizing that emerging and Asia-Pacific markets see more benefits across information access, healthcare, learning, and work compared to the U.S. and Europe.
AI today, regional comparison, impact by domain, emerging markets, health, learning, information access
false
Strategic Planning
Artificial Intelligence artificial-intelligence
Mixed Chart
IPSOS
View slide
Includes a column chart showing the percentage usage of AI tools by different types of risks.
Risk Assessment and Management
Technology & Software
Illustrates how AI tools are utilized across various risk types within organizations.
AI tools, risk types, usage, percentage
false
Risk Assessment and Management
Technology & Software technology-and-software
Single Chart
PwC/Strategy&
View slide
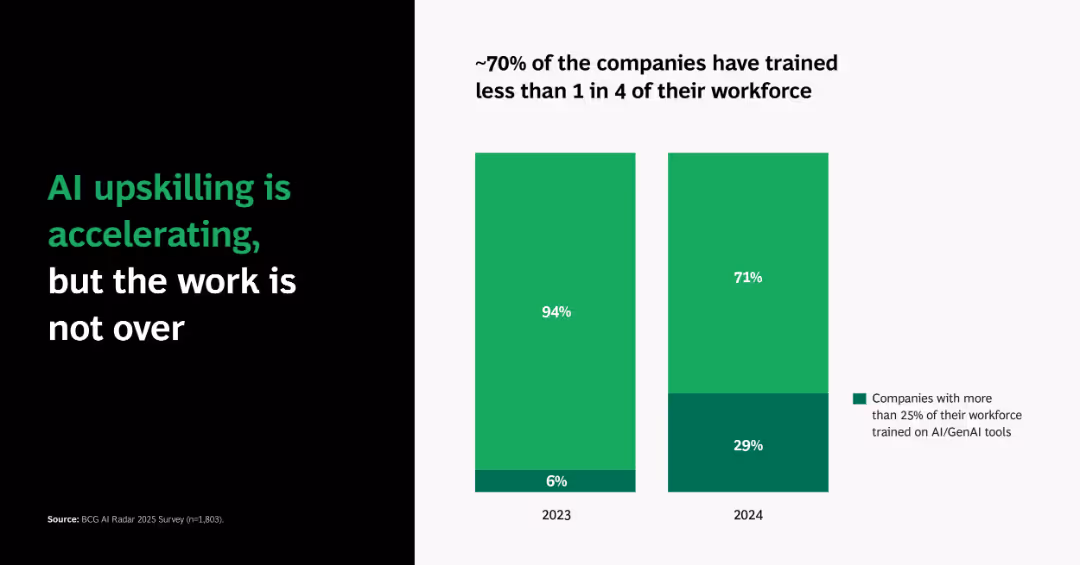
Dual vertical bar charts comparing 2023 vs. 2024 percentages of companies training more than 25% of staff on AI/GenAI tools.
Human Resources and Talent Management
Artificial Intelligence
Emphasizes growth in AI workforce training—from just 6% in 2023 to 29% in 2024. Despite the improvement, ~70% of firms still lag, suggesting a gap in full AI adoption readiness.
AI training, workforce development, GenAI, adoption, corporate learning
false
Human Resources and Talent Management
Artificial Intelligence artificial-intelligence
Single Chart
BCG
Previous
Loading...
Hold On!
We are searching in our database
If nothing, comes up, please try different filters!
Column Chart
Heatmap
Chevron
Org Chart
Infographic
Callouts
Timeline
List
Graphic
Picture
Process Flow
Diagram
Paragraph
Map
Table
Framework
Subtitle
Takeaway Box
Icon
Other Chart
Radar Chart
Waterfall Chart
Mekko Chart
Pie Chart
Scatter Plot
Line Chart
Bar chart
Bullet points
Create a FREE account to continue browsing
Receive Instant Access to 1,000+ slides from companies like McKinsey, Google, and Goldman Sachs
First Name
Last Name
Email
Password
I agree to all
Terms & Privacy Policy
Thank you! Your submission has been received!
Oops! Something went wrong while submitting the form.
Have an account?
Sign in
Upgrade to PRO to Save slides
Advanced Search and Filters
Access to 15,000+ slides
Access to Category Pages
Save/Bookmark Slides
PowerPoint Template Library
Pick a Plan
MONTHLY
$12/month
Billed every month, Cancel anytime.
YEARLY
$9/year
Billed $108 annually, Cancel anytime.
Checkout for $12/month
Checkout for $108/yr
Secured by Stripe | AES-256 bit encryption