My Account
My Slides
Search by Category
Templates
View All Templates
Download Template Slides
Leave Feedback
Login
Logout
Get Started
Browse all Slides
Browse all Slides
Create a FREE Account
Instant access to 1,000+ real slides from top companies like McKinsey, BCG, Goldman Sachs, Google and many more!
First Name
Last Name
Email
Password
I agree to all
Terms & Privacy Policy
Thank you! Your submission has been received!
Oops! Something went wrong while submitting the form.
Have an account?
Sign in
Spark Your Next Big Idea with New Presentation Templates
VIEW ALL Templates
Welcome,
Welcome
PRO
Show Featured Only
Checkbox 8
Companies
Mckinsey
Bain
BCG
EY
Deloitte
Accenture
PwC/Strategy&
JP Morgan
Goldman Sachs
Morgan Stanley
Citigroup
Deutsche Bank
Barclays
LEK
KPMG
Kearney
Oliver Wyman
Booz Allen Hamilton
Gartner
IPSOS
Nielsen
Slide type
Text Only
Linear Flow
Vertical Flow
Single Chart
Header Horizontal
Mixed Chart
Header Vertical
Pillar
Multiple Chart
Graphic
Agenda
Title
Table
Framework
Industry
Technology & Software
Artificial Intelligence
Financial Services
Retail & E-commerce
Consumer Goods
Industrial & Manufacturing
Transportation & Logistics
Telecommunications
Real Estate & Construction
Hospitality & Tourism
Professional Services
Education & Training
Media & Entertainment
Agriculture & Food Production
Healthcare & Pharmaceuticals
Environmental Services & Sustainability
Government & Public Sector
Use Case
Mergers and Acquisitions
Performance Metrics and KPIs
Client Case Studies
Competitive Landscape
Corporate Finance and Valuation
Product and Service Analysis
Customer and Market Segmentation
Organizational Structure and Change
Industry Overview
Regulatory and Compliance
Risk Assessment and Management
Investment Analysis
Organizational Structure and Change
Human Resources and Talent Management
Financial Performance
Market Analysis and Trends
Sales and Business Development
Human Resources and Talent Management
Clear all
Thank you! Your submission has been received!
Oops! Something went wrong while submitting the form.
Tag
View slide
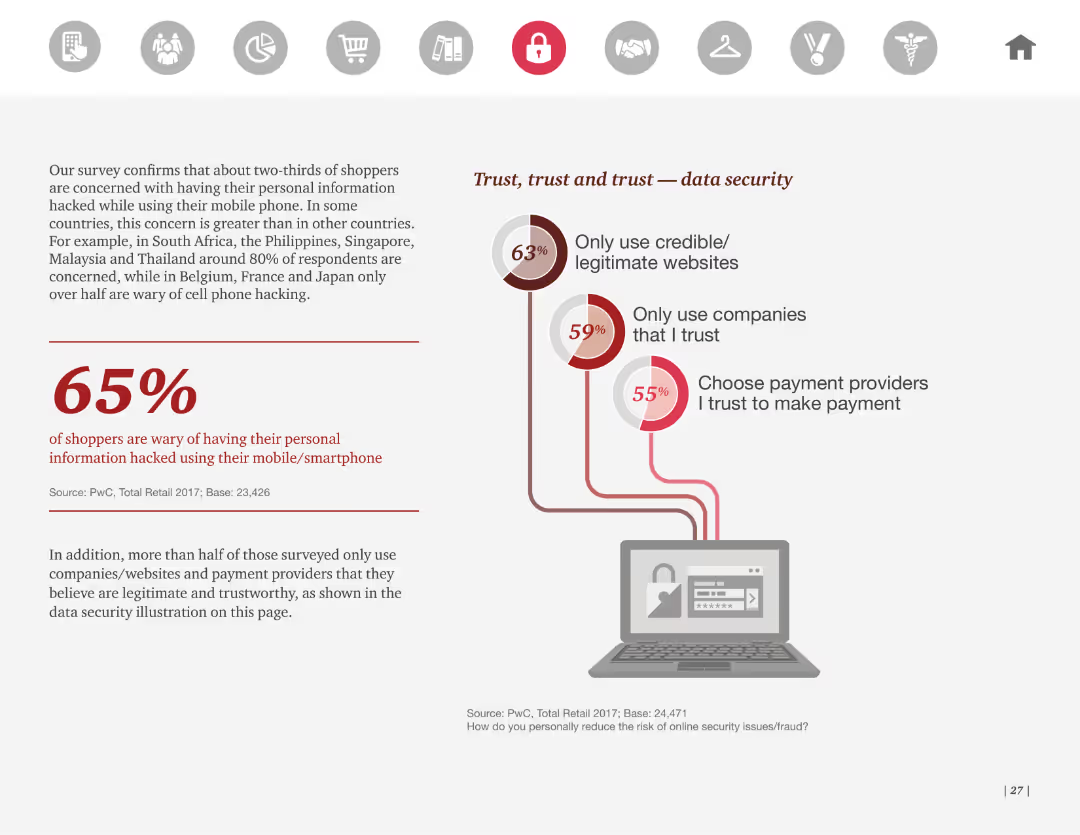
This slide features a pie chart and a large percentage figure prominently displayed. The layout is clean with a focus on statistics regarding shoppers' concerns about data security on mobile devices. It uses minimal text with a clear and concise design.
Risk Assessment and Management
Retail & E-commerce
The slide presents survey results highlighting that 65% of shoppers are wary of having their personal information hacked using their mobile phones. It emphasizes the importance of credible websites, trusted companies, and secure payment providers.
Data security, mobile, hacking, trust, survey
false
Risk Assessment and Management
Retail & E-commerce retail-and-e-commerce
Mixed Chart
PwC/Strategy&
View slide
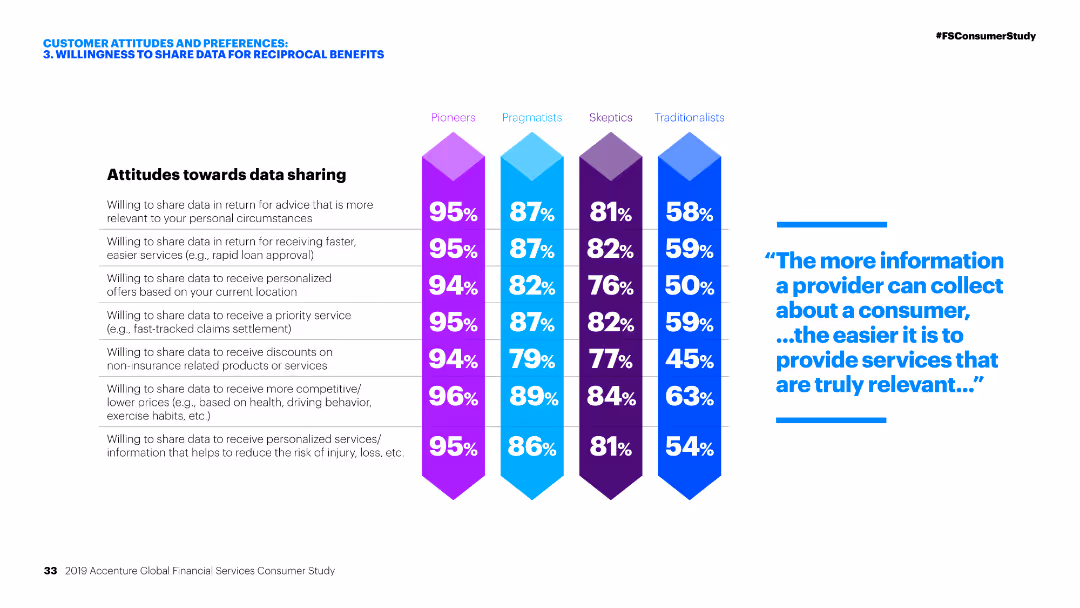
Column chart showing percentages of different customer segments (Pioneers, Pragmatists, Skeptics, Traditionalists) and their willingness to share data for various benefits.
Customer and Market Segmentation
Financial Services
The slide displays customer attitudes towards data sharing, highlighting percentages of willingness among different customer segments for various data sharing incentives.
Data sharing, Customer segments, Financial services, Attitudes, Incentives
false
Customer and Market Segmentation
Financial Services financial-services
Table
Accenture
View slide
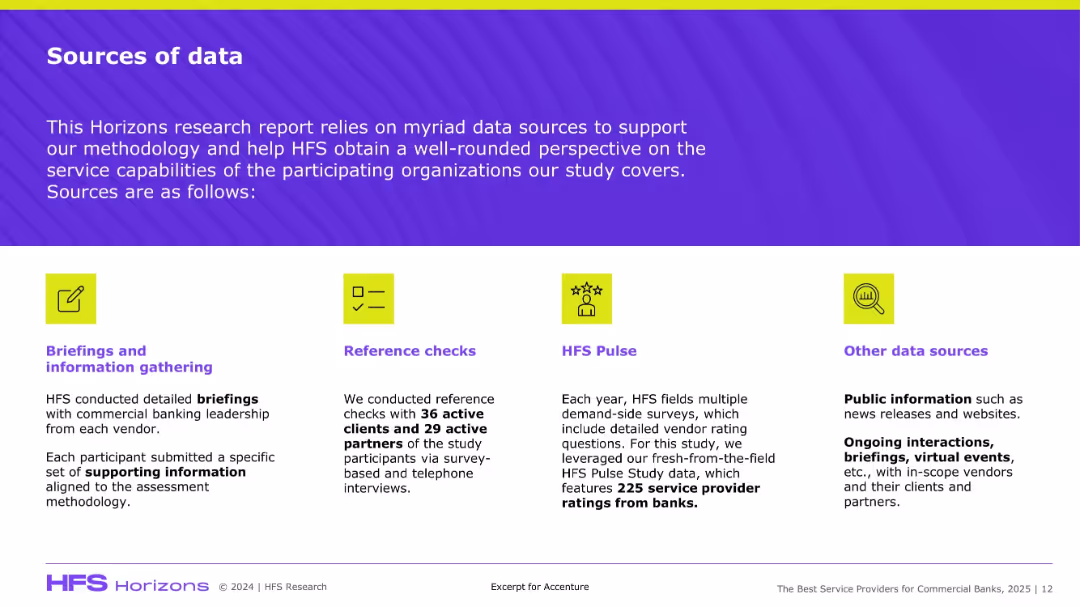
Four-block layout with icons, each detailing a type of data source; uses bright visuals and concise descriptions.
Regulatory and Compliance
Professional Services
This slide explains the methodology for gathering insights in the HFS Horizons study, covering briefings, reference checks, surveys (HFS Pulse), and public data sources to support vendor evaluation.
Data sources, HFS, methodology, research, banks, reference checks, vendor ratings
false
Regulatory and Compliance
Professional Services professional-services
Pillar
Accenture
View slide
The layout includes values, icons, and a data flow diagram. The design is clean, with blue color accents and data-related imagery.
Technology and Digital Transformation
Technology & Software
Details how the breadth and scale of the firm's data are being transformed into value-added products for clients through various tools and services.
Data transformation, payment accounts, merchant acquiring, digital identity, data governance, biometrics, customer insights, identity verification
false
Technology and Digital Transformation
Technology & Software technology-and-software
Header Horizontal
JP Morgan
View slide
The slide features a large image of a network globe with text on the right and a trend assessment.
Technology and Digital Transformation
Technology & Software
Covers the significance of data and AI in creating personalized consumer experiences and improving supply chain automation.
Data, AI, Personalization, Consumer Experience, Supply Chain, Automation, Blockchain
false
Technology and Digital Transformation
Technology & Software technology-and-software
Multiple Chart
Deloitte
View slide
Data visualization slide with charts and a photo, presenting statistics related to the report's findings on women's well-being.
Technology and Digital Transformation
Professional Services
Provides a visual representation of data regarding improvements and continuing challenges in women's well-being at work, emphasizing both progress and areas needing attention.
Data, Women, Well-Being, Progress, Challenges
false
Technology and Digital Transformation
Professional Services professional-services
Agenda
Deloitte
View slide
Features table style displaying branch consolidations, savings, deposit share gains, and new builds. Highlights key market data points.
Operational Efficiency
Financial Services
Presents a data-driven approach for optimizing the branch network to align with customer demand in various markets.
Data-Driven, Branch Optimization, Customer Demand, Market Expansion, Financial Efficiency, Savings
false
Operational Efficiency
Financial Services financial-services
Table
JP Morgan
View slide
The slide contains a line chart showing the number of mentions of "De-risk" or "Decouple" in company documents from 2013 to 2024, along with annotations for significant events.
Risk Assessment and Management
Financial Services
The slide discusses the diversification of global supply chains, government incentives for local production, technology and security concerns, and weaker market growth in China.
De-risking, supply chains, government incentives, security concerns, China
false
Risk Assessment and Management
Financial Services financial-services
Mixed Chart
Accenture
View slide
The slide features a column chart showing various DeFi uses for crypto assets in 2022 and 2023, with percentage breakdowns for activities like yield earning.
Market Analysis and Trends
Financial Services
It explores how crypto owners engage in DeFi activities, such as yield earning and trading on decentralized exchanges, with comparative data from 2022 to 2023.
DeFi, crypto assets, 2023, 2022, yield earning, decentralized exchanges, trading, activities
false
Market Analysis and Trends
Financial Services financial-services
Mixed Chart
IPSOS
View slide
This slide showcases a column chart comparing awareness of DeFi marketing from crypto trading platforms between 2022 and 2023, with percentages of responses.
Market Analysis and Trends
Financial Services
It presents data on the awareness of DeFi marketing, showing a drop in people recalling such ads, and highlighting differences across age and gender demographics.
DeFi, crypto trading platforms, marketing, 2023, 2022, awareness, demographics, ads
false
Market Analysis and Trends
Financial Services financial-services
Mixed Chart
IPSOS
View slide
The slide features a donut chart displaying the percentage of people who have seen DeFi advertisements from crypto trading platforms. It includes a breakdown of responses on the left. The layout is moderate in complexity.
Technology and Digital Transformation
Financial Services
This slide shows the percentage of people who recall seeing advertisements from crypto trading platforms about DeFi, with a significant portion not remembering any such ads. It aims to gauge the reach of these advertisements.
DeFi, crypto, advertising, platforms, recall
false
Technology and Digital Transformation
Financial Services financial-services
Mixed Chart
IPSOS
View slide
The slide features a column chart on the right displaying the percentage of people using DeFi applications for various purposes. It is accompanied by a list of activities on the left. The layout is moderately complex.
Technology and Digital Transformation
Financial Services
This slide outlines the use of DeFi applications among crypto asset holders, with earning yields and minting NFTs being popular activities. It provides insights into DeFi usage trends.
DeFi, crypto, applications, activities, trends
false
Technology and Digital Transformation
Financial Services financial-services
Mixed Chart
IPSOS
View slide
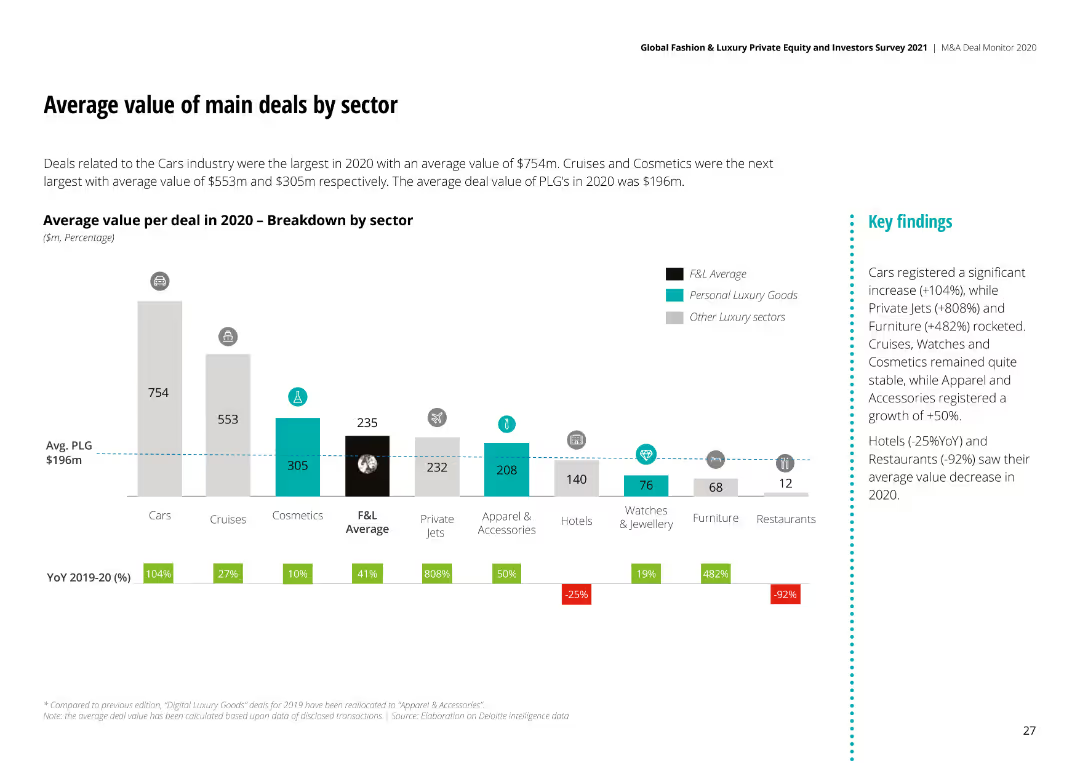
The slide features a bar chart with the average value per deal in 2020 for different sectors, including Cars, Cruises, and Cosmetics.
Market Analysis and Trends
Consumer Goods
It presents the average deal values across various sectors, noting significant increases and decreases in value.
Deal Value, Sector, 2020, Cars, Cruises, Cosmetics
false
Market Analysis and Trends
Consumer Goods consumer-goods
Mixed Chart
Deloitte
View slide
Bar and line graph hybrid illustrating the number of deals and deal value from 2017 to H1 2021. The design includes different shades of blue for distinction, with a clear indication of the upward trend and investment sources noted below.
Investment Analysis
Financial Services
Showcasing the explosive growth in deal value in Vietnam for 2021, the slide credits foreign and domestic investment, alongside government incentives, as key drivers for this increase.
Deal Value, Vietnam, Investment, Foreign, Domestic, Government, Incentives, Growth
false
Investment Analysis
Financial Services financial-services
Single Chart
Bain
View slide
A multi-stacked column chart displays deal values across sectors from 2017 to H1 2021. It’s a complex visual with varied colors for each sector, requiring more focus to interpret the layered information.
Market Analysis and Trends
Financial Services
Provides a detailed breakdown of deal values within sectors such as e-commerce, transport & food, and digital financial services over multiple years, pinpointing the sustained focus and prominence of e-commerce and financial services deals.
Deal Values, Sectors, E-commerce, Financial Services
false
Market Analysis and Trends
Financial Services financial-services
Single Chart
Bain
View slide
Moderate complexity featuring a column chart detailing deal value in US dollars over time, segmented by unicorn and other investments, accompanied by a text block explaining the chart.
Market Analysis and Trends
Financial Services
Analyzes the growth of deal activity within a region, with specific emphasis on the tech investment landscape and the trend of unicorn and non-unicorn investments.
Deal activity, investment, unicorn, tech landscape
false
Market Analysis and Trends
Financial Services financial-services
Mixed Chart
Bain
View slide
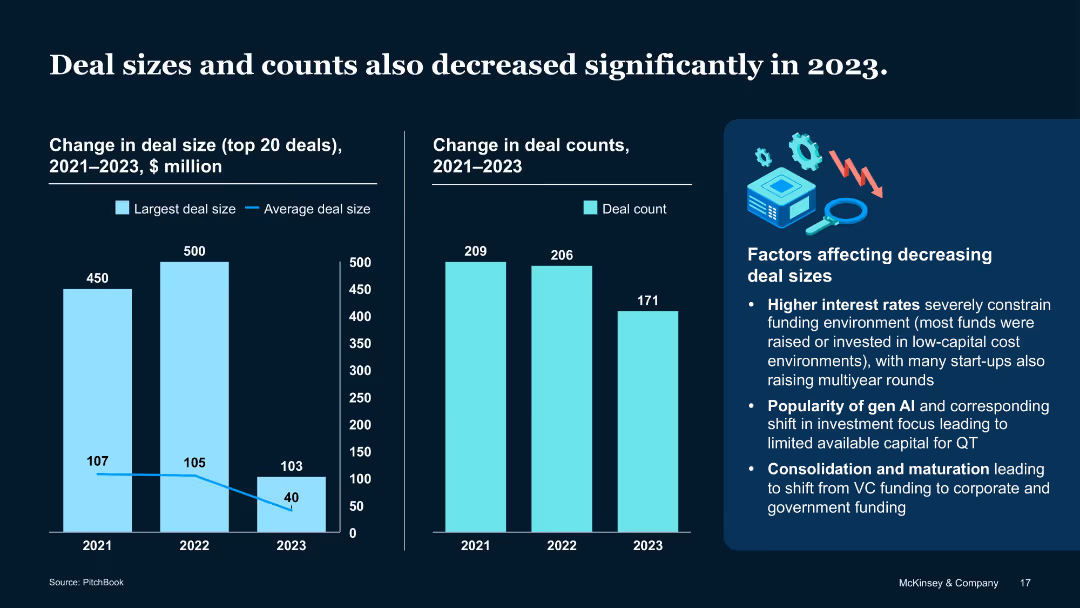
Dual column charts and text box on influencing factors
Performance Metrics and KPIs
Artificial Intelligence
Examines shrinking average deal size ($40M in 2023) and falling deal count (171). Cites high interest rates, AI investment popularity, and funding consolidation as major drivers.
Deal count, VC environment, QT investment, capital size, 2023 trends
false
Performance Metrics and KPIs
Artificial Intelligence artificial-intelligence
Multiple Chart
McKinsey
View slide
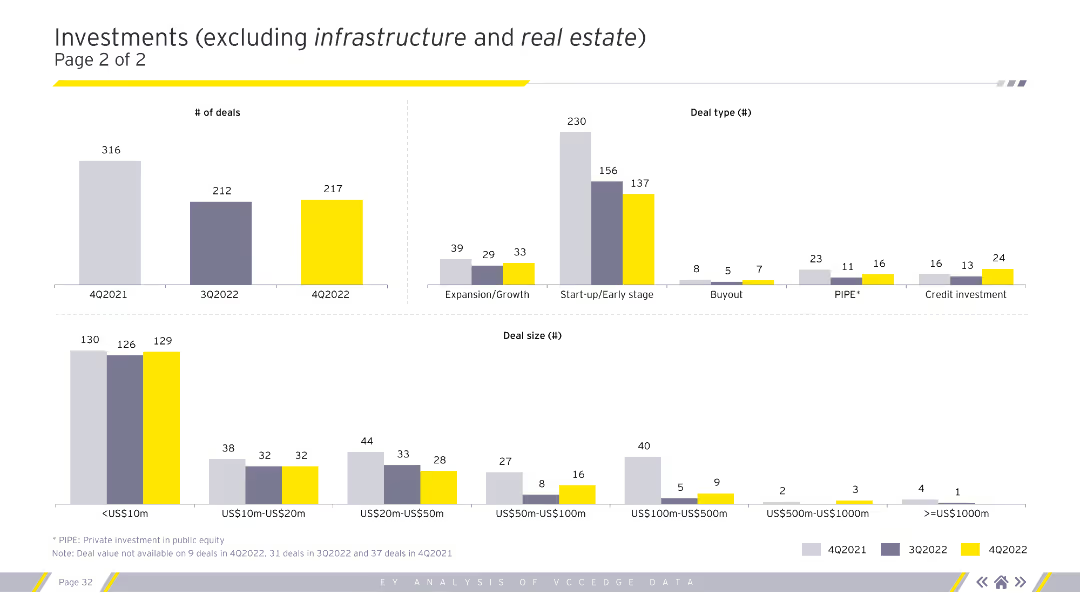
The slide includes column charts depicting the number of deals, deal types, and deal sizes for different quarters. Different colors represent distinct quarters, enhancing comparative analysis.
Market Analysis and Trends
Financial Services
This slide continues the analysis of investments excluding infrastructure and real estate, emphasizing the number of deals and their distribution across deal types and sizes.
Deal types, number of deals, deal sizes, investments
false
Market Analysis and Trends
Financial Services financial-services
Multiple Chart
EY
View slide
A simple design with a blue-toned bar chart depicting deal values over recent years. Annotations provide additional context to the data shown.
Investment Analysis
Financial Services
Presents data on the deal values in the Philippines, with a specific focus on the significant increase in H1 2021, offering insights into the investment climate.
Deal value, Investment climate, Yearly comparison, Market insight
false
Investment Analysis
Financial Services financial-services
Single Chart
Bain
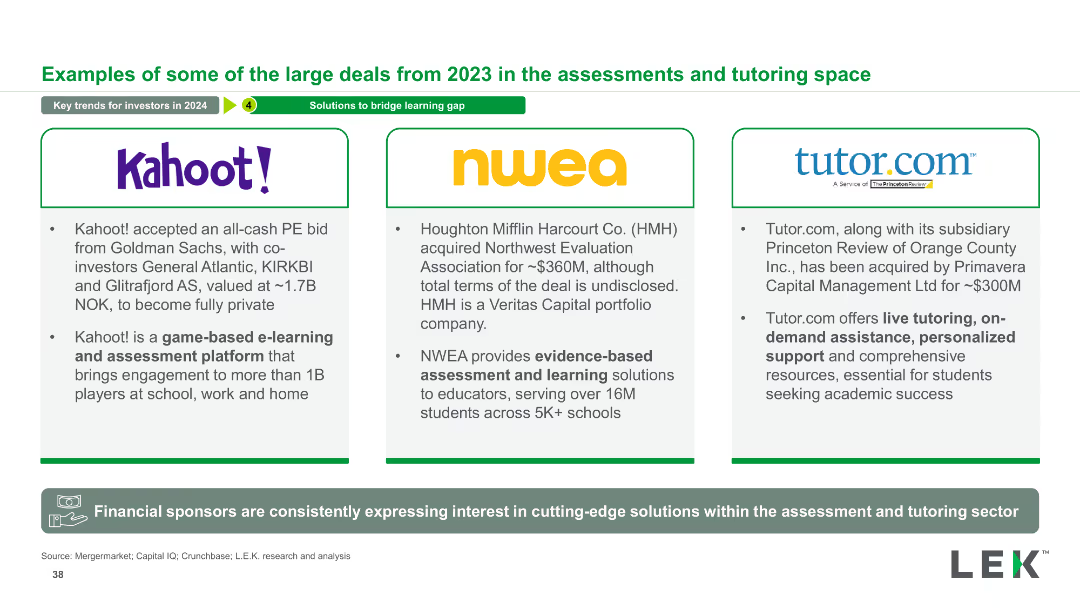
View slide
The slide features three sections, each highlighting a major deal in the assessments and tutoring space, with details about the companies involved and the nature of the deals.
Mergers and Acquisitions
Education & Training
This slide presents examples of significant deals in the assessments and tutoring sector, showcasing investments and acquisitions in this market.
Deals, Assessments, Tutoring, Mergers, Acquisitions, Investments, Education, Companies, Market, Sector
false
Mergers and Acquisitions
Education & Training education-and-training
Pillar
LEK
View slide
The slide presents bar graphs with deal values and numbers, using shades of blue for differentiation and clarity in data presentation.
Investment Analysis
Financial Services
The slide compares the deal values and number of deals in Thailand, suggesting a trend towards another record year in 2021.
Deals, Thailand, 2021, Record, Values, Investments, Analysis, Financial
false
Investment Analysis
Financial Services financial-services
Single Chart
Bain
View slide
Bar graphs display the deal value over years, with a focus on 2021. Simple color coding, well-spaced elements, and clear labelling.
Investment Analysis
Financial Services
Displays Singapore's deal values from 2017 to 2021 with a focus on H1 of each year, predicting a year comparable to 2018 in terms of activity.
Deals, Value, Singapore, 2018, 2021, Investments, Trends, Forecast, Financial
false
Investment Analysis
Financial Services financial-services
Single Chart
Bain
View slide
Structured with bullet points, the slide presents debated topics regarding the implementation of connectivity.
Market Analysis and Trends
Telecommunications
The slide prompts discussions on the current debates surrounding advanced connectivity technologies.
Debate, Connectivity, 5G, LEO, LPWA, Technology Implementation
false
Market Analysis and Trends
Telecommunications telecommunications
Header Vertical
McKinsey
View slide
Featuring a digital avatar, the slide presents a question-answer format with a focus on debate topics. The dark background emphasizes the text and the avatar, guiding the viewer's attention directly to the content. The layout facilitates an easy-to-follow structure, highlighting key discussion points.
Strategic Planning
Technology & Software
Aimed at sparking conversation, this slide presents debate questions surrounding the adoption and implications of next-generation software development. It encourages critical thinking about the cultural, legal, and operational challenges of integrating these new technologies in various settings.
Debate, Software Development, Automation, Intellectual Property, Culture, Responsibility
false
Strategic Planning
Technology & Software technology-and-software
Text Only
McKinsey
View slide
Bullet points addressing key debates about immersive tech, with a background graphic symbolizing connectivity.
Strategic Planning
Technology & Software
Discusses key debate points surrounding immersive reality in the workplace, including scalability, integration with enterprise architecture, and virtual crimes.
Debates, immersive reality, workplace, scalability, integration, virtual crimes
false
Strategic Planning
Technology & Software technology-and-software
Header Vertical
McKinsey
View slide
The slide includes pie charts and textual highlights, showing the composition of the debt portfolio and the proportions of secured vs. unsecured loans.
Investment Analysis
Financial Services
Analyzes the debt balance sheet for asset management, focusing on the diversification of debt investments by type and geography. It is helpful for investment strategy discussions and risk assessments related to debt portfolios.
Debt Balance Sheet, Asset Management, Loan Types, Secured Debt, Unsecured Debt, TMT, Healthcare, Financials, Real Estate, Geographical Distribution
false
Investment Analysis
Financial Services financial-services
Multiple Chart
Goldman Sachs
View slide
The slide includes two pie charts showing the distribution of interest-bearing debt and interest rate distribution, accompanied by labels and percentages.
Financial Performance
Financial Services
It conveys the debt composition and interest rates as of a specific date, for financial analysis or investor relations.
Debt Structure, Interest Rates, Financial Analysis, Distribution, Pie Charts, Bonds, Loans
false
Financial Performance
Financial Services financial-services
Multiple Chart
Goldman Sachs
View slide
Slide displays a flowchart with icons representing different companies and processes in debt negotiation. Blue, red, and green arrows indicate different paths and transactions. Uses a clean, structured layout with distinct sections.
Market Analysis and Trends
Financial Services
Explains the operational flow of the Limpa Nome marketplace, detailing each step in the debt negotiation process for Brazilian users. It also shows how revenue is shared and payments are processed.
Debt negotiation, Brazil, flowchart
false
Market Analysis and Trends
Financial Services financial-services
Linear Flow
Barclays
View slide
Pie chart and column charts present. Light and dark blue shades used to denote different bond types and maturities. High data density.
Financial Performance
Financial Services
Discusses the composition and maturity of the hold-to-collect debt portfolio, focusing on risk and asset management.
Debt securities, portfolio, maturities, fair value, risk management, bonds, financial assets
false
Financial Performance
Financial Services financial-services
Multiple Chart
Deutsche Bank
View slide
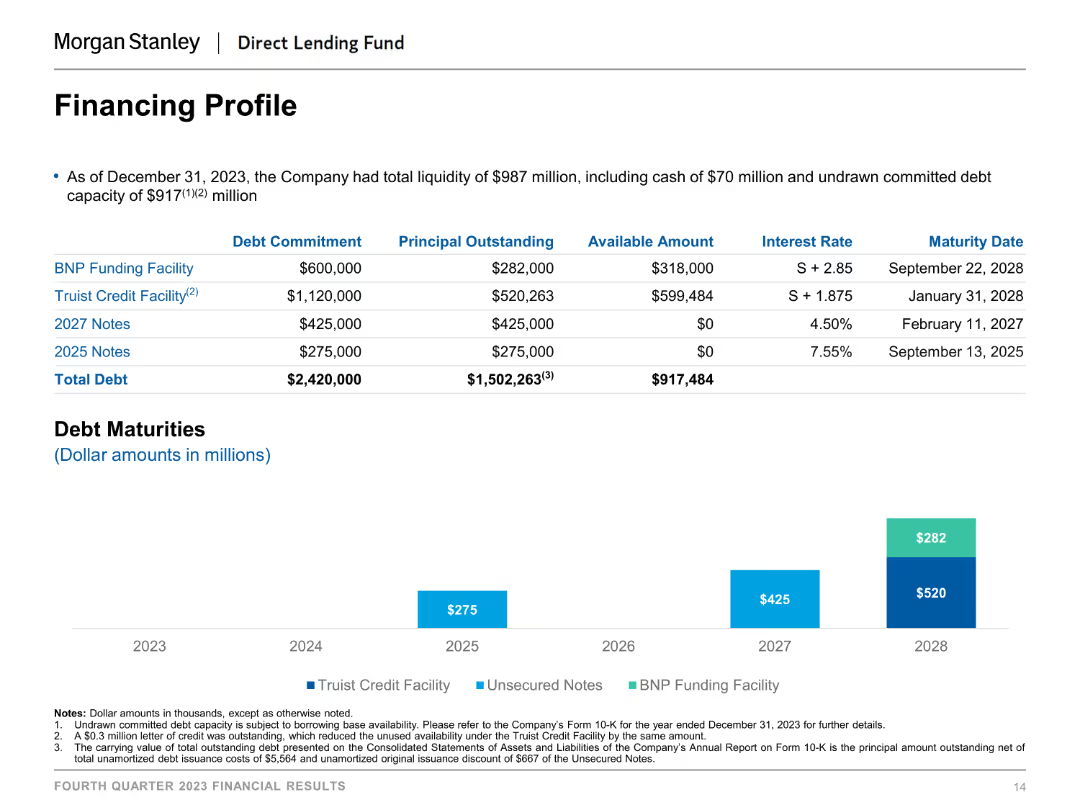
A table detailing debt commitments, principal outstanding, available amounts, interest rates, and maturity dates.
Financial Performance
Financial Services
This slide provides an overview of the company’s financing profile as of December 31, 2023, showing various funding facilities, notes, and debt maturities.
Debt, Financing, Interest Rates, Maturity Dates, Liquidity
false
Financial Performance
Financial Services financial-services
Mixed Chart
Morgan Stanley
Previous
Loading...
Hold On!
We are searching in our database
If nothing, comes up, please try different filters!
Column Chart
Heatmap
Chevron
Org Chart
Infographic
Callouts
Timeline
List
Graphic
Picture
Process Flow
Diagram
Paragraph
Map
Table
Framework
Subtitle
Takeaway Box
Icon
Other Chart
Radar Chart
Waterfall Chart
Mekko Chart
Pie Chart
Scatter Plot
Line Chart
Bar chart
Bullet points
Create a FREE account to continue browsing
Receive Instant Access to 1,000+ slides from companies like McKinsey, Google, and Goldman Sachs
First Name
Last Name
Email
Password
I agree to all
Terms & Privacy Policy
Thank you! Your submission has been received!
Oops! Something went wrong while submitting the form.
Have an account?
Sign in
Upgrade to PRO to Save slides
Advanced Search and Filters
Access to 15,000+ slides
Access to Category Pages
Save/Bookmark Slides
PowerPoint Template Library
Pick a Plan
MONTHLY
$12/month
Billed every month, Cancel anytime.
YEARLY
$9/year
Billed $108 annually, Cancel anytime.
Checkout for $12/month
Checkout for $108/yr
Secured by Stripe | AES-256 bit encryption