My Account
My Slides
Search by Category
Templates
View All Templates
Download Template Slides
Leave Feedback
Login
Logout
Get Started
Browse all Slides
Browse all Slides
Create a FREE Account
Instant access to 1,000+ real slides from top companies like McKinsey, BCG, Goldman Sachs, Google and many more!
First Name
Last Name
Email
Password
I agree to all
Terms & Privacy Policy
Thank you! Your submission has been received!
Oops! Something went wrong while submitting the form.
Have an account?
Sign in
Spark Your Next Big Idea with New Presentation Templates
VIEW ALL Templates
Welcome,
Welcome
PRO
Show Featured Only
Checkbox 8
Companies
Mckinsey
Bain
BCG
EY
Deloitte
Accenture
PwC/Strategy&
JP Morgan
Goldman Sachs
Morgan Stanley
Citigroup
Deutsche Bank
Barclays
LEK
KPMG
Kearney
Oliver Wyman
Booz Allen Hamilton
Gartner
IPSOS
Nielsen
Slide type
Text Only
Linear Flow
Vertical Flow
Single Chart
Header Horizontal
Mixed Chart
Header Vertical
Pillar
Multiple Chart
Graphic
Agenda
Title
Table
Framework
Industry
Technology & Software
Artificial Intelligence
Financial Services
Retail & E-commerce
Consumer Goods
Industrial & Manufacturing
Transportation & Logistics
Telecommunications
Real Estate & Construction
Hospitality & Tourism
Professional Services
Education & Training
Media & Entertainment
Agriculture & Food Production
Healthcare & Pharmaceuticals
Environmental Services & Sustainability
Government & Public Sector
Use Case
Mergers and Acquisitions
Performance Metrics and KPIs
Client Case Studies
Competitive Landscape
Corporate Finance and Valuation
Product and Service Analysis
Customer and Market Segmentation
Organizational Structure and Change
Industry Overview
Regulatory and Compliance
Risk Assessment and Management
Investment Analysis
Organizational Structure and Change
Human Resources and Talent Management
Financial Performance
Market Analysis and Trends
Sales and Business Development
Human Resources and Talent Management
Clear all
Thank you! Your submission has been received!
Oops! Something went wrong while submitting the form.
Tag
View slide
The slide features a stacked bar chart and a line chart showing debt dynamics over the years. It is visually complex, designed to convey detailed financial data clearly.
Financial Performance
Government & Public Sector
The slide analyzes debt stock trends from 2015 to 2023, highlighting the increase in domestic and external debt, and providing insights into fiscal deficit and debt servicing ratios.
Debt, Stock, Analysis, Trends, Fiscal
false
Financial Performance
Government & Public Sector government-and-public-sector
Mixed Chart
PwC/Strategy&
View slide
This slide includes a column chart depicting debt underwriting net revenues over time, with specific figures for selected years. Beneath, a league table ranking is provided for different types of debt.
Financial Performance
Financial Services
The slide highlights the growth in debt underwriting net revenues, demonstrating the company's successful execution of strategic focus and improved competitive position. League table rankings in various debt categories are shown to depict market standing.
Debt, Underwriting, Growth, Revenue, Competitive, Rankings, Strategy
false
Financial Performance
Financial Services financial-services
Single Chart
Goldman Sachs
View slide
Multi-topic slide with numbered headings, bullet points, and colored key for different consumption aspects.
Strategic Planning
Environmental Services & Sustainability
Discusses various points of debate regarding the future of sustainable consumption, focusing on policy and consumer behavior.
Decarbonization, Consumer Behavior, Sustainable Agriculture, Circular Economy, Carbon Removal
false
Strategic Planning
Environmental Services & Sustainability environmental-services-and-sustainability
Header Vertical
McKinsey
View slide
The slide includes a horizontal bar chart illustrating the impact of adopting various decarbonization levers on operational emissions changes, categorized by lever type.
Strategic Planning
Environmental Services & Sustainability
It analyzes how companies adopting multiple decarbonization levers show better emission reduction outcomes, highlighting the importance of comprehensive strategies.
Decarbonization, Emissions, Levers, Companies, Strategy
false
Strategic Planning
Environmental Services & Sustainability environmental-services-and-sustainability
Mixed Chart
Accenture
View slide
Multi-bar comparison across five inhibitors (returns, regulation, demand, finance, buy-in); includes contextual commentary
Risk Assessment and Management
Environmental Services & Sustainability
This slide identifies the major barriers to decarbonization faced by Middle East and GCC businesses, notably low returns and regulatory complexity. It suggests the need for policy alignment and financing strategies.
Decarbonization, Regulatory Barriers, Investment Returns, Climate Risk, Sustainability Challenges
false
Risk Assessment and Management
Environmental Services & Sustainability environmental-services-and-sustainability
Mixed Chart
PwC/Strategy&
View slide
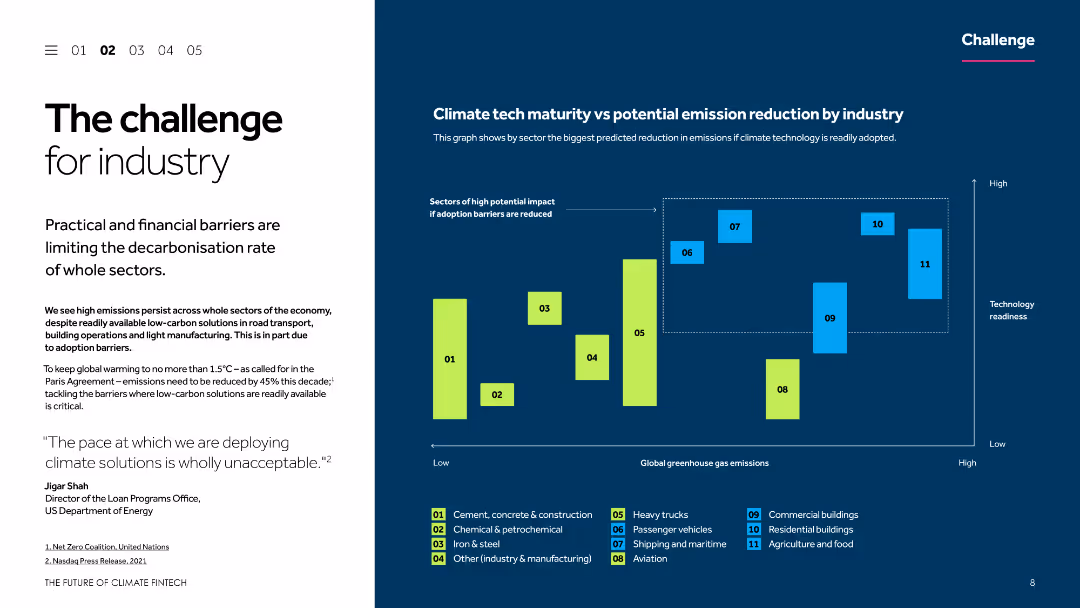
This slide uses a two-column layout with a text section on the left and a column chart on the right. The text describes the challenges faced by industries in decarbonization, while the chart illustrates the potential emission reduction by industry and technology readiness.
Risk Assessment and Management
Environmental Services & Sustainability
The slide discusses the practical and financial barriers limiting the decarbonization rate of various sectors. It includes a comparison of climate tech maturity versus potential emission reduction across different industries, emphasizing the need for overcoming adoption barriers.
Decarbonization, climate tech, emission reduction, industry challenges, technology readiness
false
Risk Assessment and Management
Environmental Services & Sustainability environmental-services-and-sustainability
Mixed Chart
Barclays
View slide
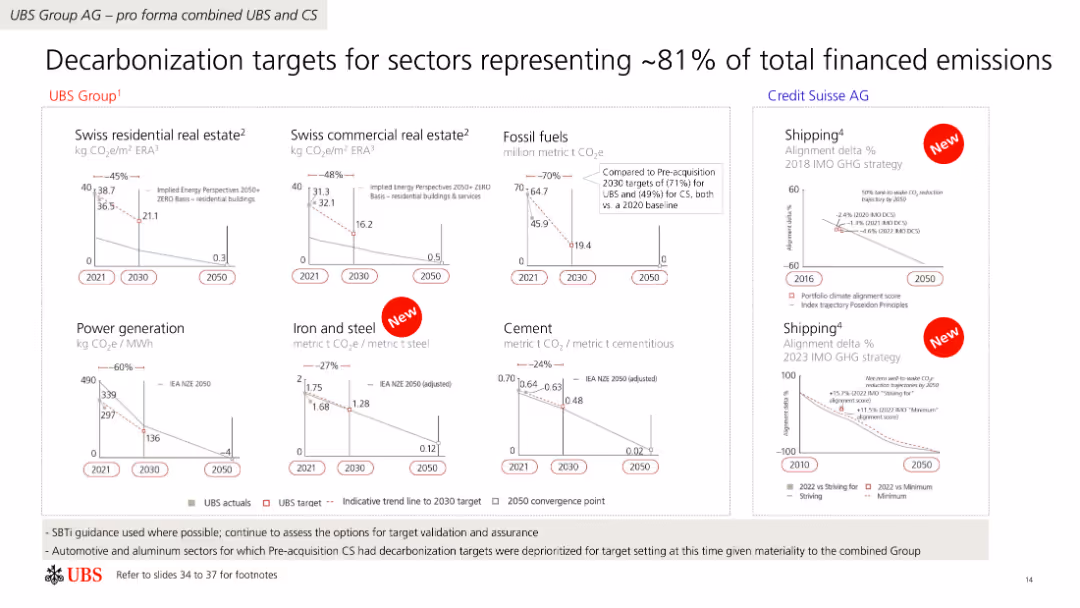
The slide includes multiple line charts comparing decarbonization targets across different sectors such as real estate, fossil fuels, and power generation.
Risk Assessment and Management
Financial Services
This slide outlines UBS Group AG's decarbonization targets for various sectors, representing a significant portion of total financed emissions, with specific reduction goals.
Decarbonization, targets, sectors, emissions, UBS
false
Risk Assessment and Management
Financial Services financial-services
Multiple Chart
UBS
View slide
The layout is similar to slides 113 and 114, featuring black and white design with green highlights. It includes two sections with bullet points, each led by an icon, discussing innovations and risks in financial services related to Web3.
Operational Efficiency
Financial Services
Describes how Web3 could bring about cost efficiencies and a shift in investment trends within financial services, and outlines the associated risks, particularly concerning regulatory uncertainties and consumer protections.
Decentralization, Financial Services, Smart Contracts, Risks
false
Operational Efficiency
Financial Services financial-services
Boxed
McKinsey
View slide
The slide presents a comparison between Germany and Global data in pie and column charts. It includes two pie charts showing the percentage of people's personal views on leadership permission, and three column charts comparing decision-making processes and data-driven insights usage in organizations.
Strategic Planning
Professional Services
The slide highlights differences in decision-making strategies and reliance on data-driven insights between German and Global executives, focusing on leadership permissions, decision-making processes, and data usage in strategic contexts.
Decision-making, Strategy, Data, Germany, Global, Leadership, Insights, Comparison
false
Strategic Planning
Professional Services professional-services
Multiple Chart
Deloitte
View slide
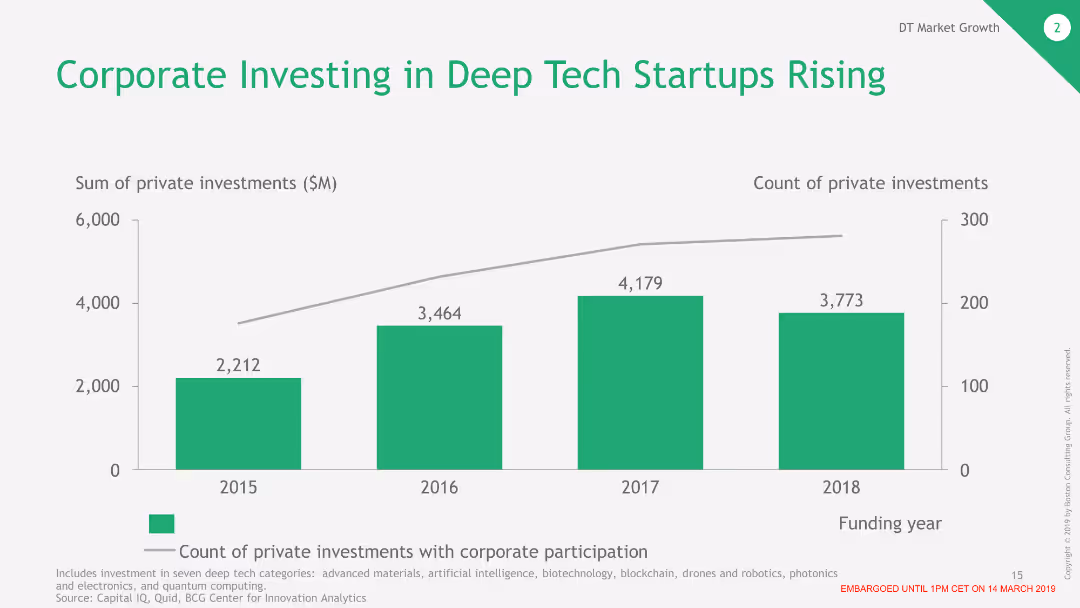
The slide features a column chart illustrating the rise in corporate investments in deep tech startups from 2015 to 2018. The columns represent the sum of private investments with corporate participation, shown in millions of dollars.
Investment Analysis
Financial Services
This slide provides data on the increasing trend of corporate investments in deep tech startups over the years. It shows the growing financial involvement of corporations in the deep tech sector and the rising number of investments.
Deep Tech, Corporate Investment, Startups, Financial Growth, Private Investment Trends
false
Investment Analysis
Financial Services financial-services
Single Chart
BCG
View slide
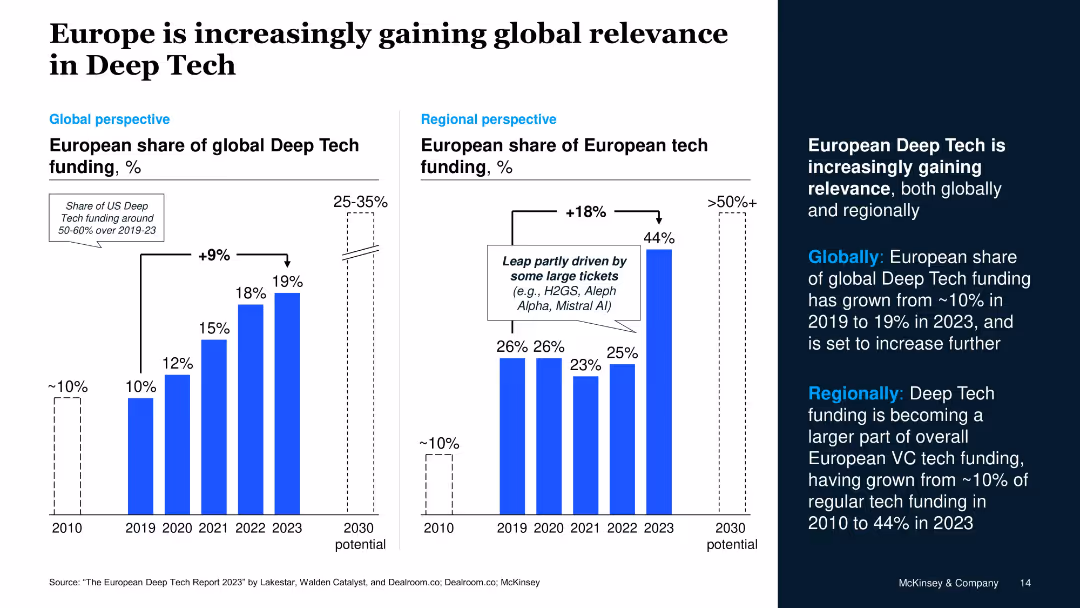
Two bar graphs comparing funding shares globally and regionally, with growth projections to 2030
Strategic Planning
Technology & Software
The slide shows Europe's growing global and regional relevance in Deep Tech. European global Deep Tech funding share rose from 10% in 2019 to 19% in 2023, and its share of European tech funding reached 44%, with projections exceeding 50%.
Deep Tech, Europe, global relevance, VC funding, market growth, projections
false
Strategic Planning
Technology & Software technology-and-software
Multiple Chart
McKinsey
View slide
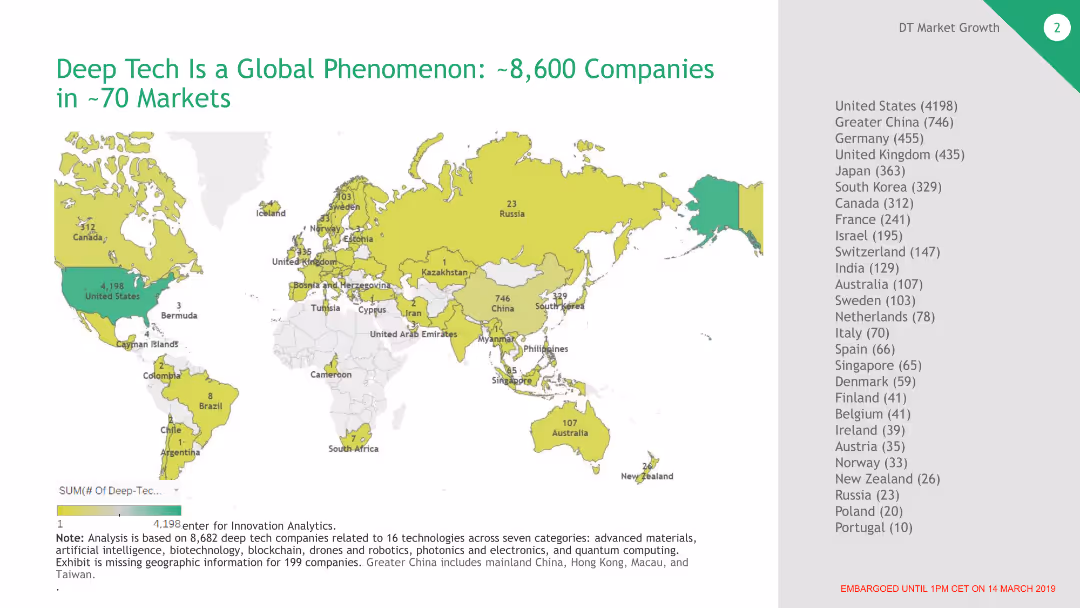
The slide contains a world map highlighting countries with deep tech companies. The map is color-coded to indicate the number of companies in each region, with a legend and a list of countries and their respective company counts on the right.
Industry Overview
Technology & Software
This slide demonstrates the global distribution of deep tech companies, showing that there are around 8,600 companies spread across 70 markets. It emphasizes the widespread adoption and development of deep tech worldwide.
Deep Tech, Global, Companies, Markets, Distribution, Map, Industry
false
Industry Overview
Technology & Software technology-and-software
Graphic
BCG
View slide
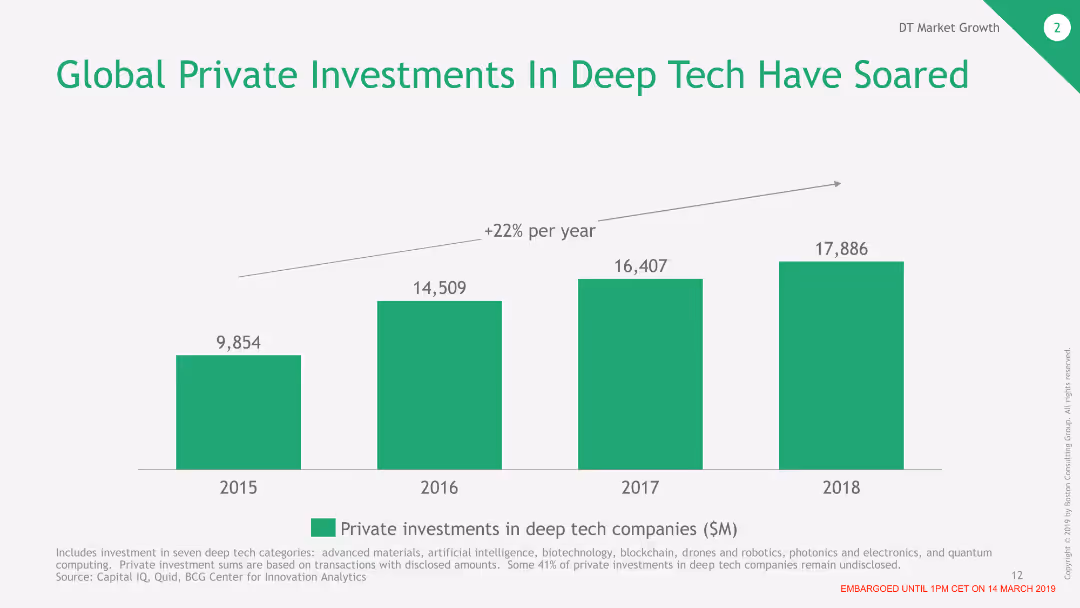
The slide features a column chart showing the increase in global private investments in deep tech from 2015 to 2018. The columns are color-coded and display the investment amounts in millions of dollars for each year.
Market Analysis and Trends
Financial Services
This slide presents data on the rising global private investments in deep tech companies over four years. It highlights a significant increase, indicating growing interest and confidence in deep tech sectors.
Deep Tech, Investment, Global, Private Investments, Growth, Financial Trends
false
Market Analysis and Trends
Financial Services financial-services
Single Chart
BCG
View slide
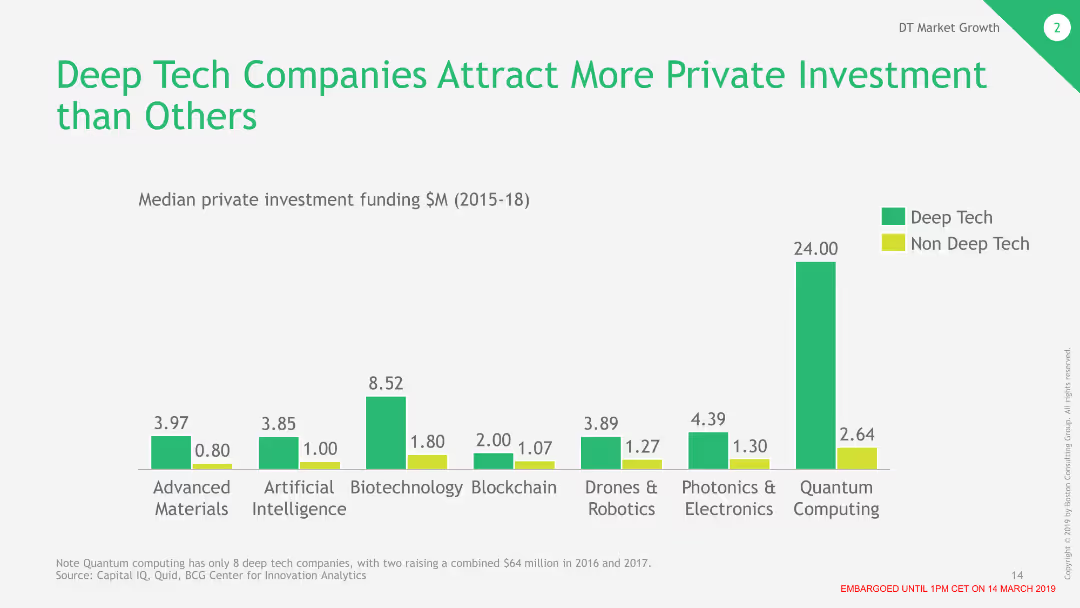
The slide shows a column chart comparing median private investment funding between deep tech companies and non-deep tech companies from 2015 to 2018. Deep tech categories are listed with higher median investments shown in green columns.
Investment Analysis
Financial Services
This slide highlights that deep tech companies attract significantly more private investment compared to non-deep tech companies. It provides a comparative analysis of investment amounts across various tech categories.
Deep Tech, Investment, Private Funding, Comparison, Financial Analysis, Median Funding
false
Investment Analysis
Financial Services financial-services
Single Chart
BCG
View slide
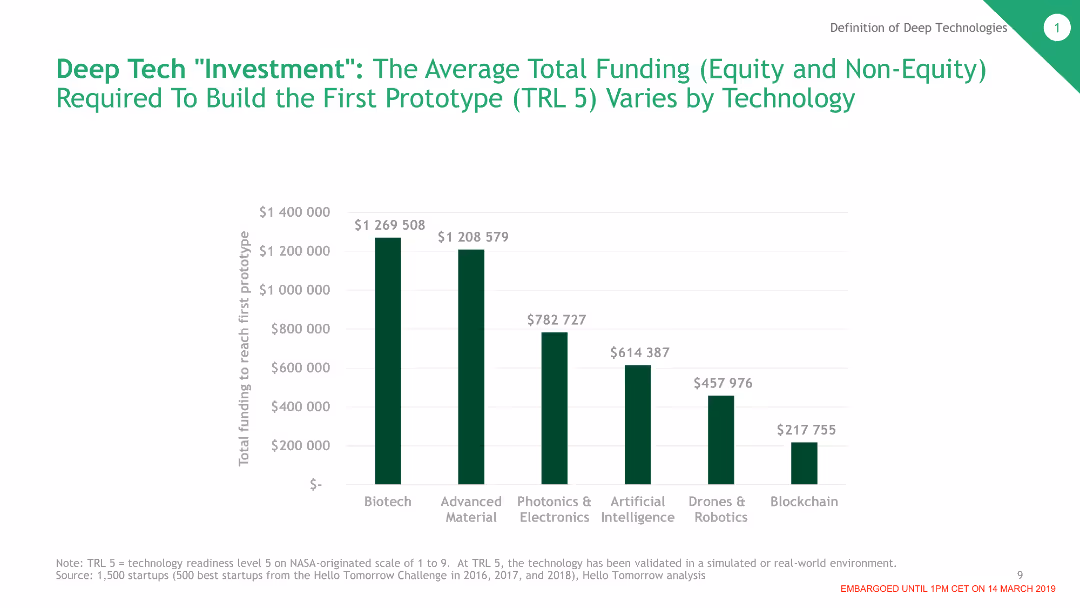
The slide includes a column chart displaying the average total funding required to build the first prototype for various deep tech categories. Each category's funding level is represented by different heights of columns.
Investment Analysis
Financial Services
This slide shows the Average Total Funding (Equity and Non-Equity) Required To Build the First Prototype (TRL 5) Varies by Technology
Deep Tech, Investment, Prototype, Funding, Biotech, AI, Robotics, Blockchain
false
Investment Analysis
Financial Services financial-services
Single Chart
BCG
View slide
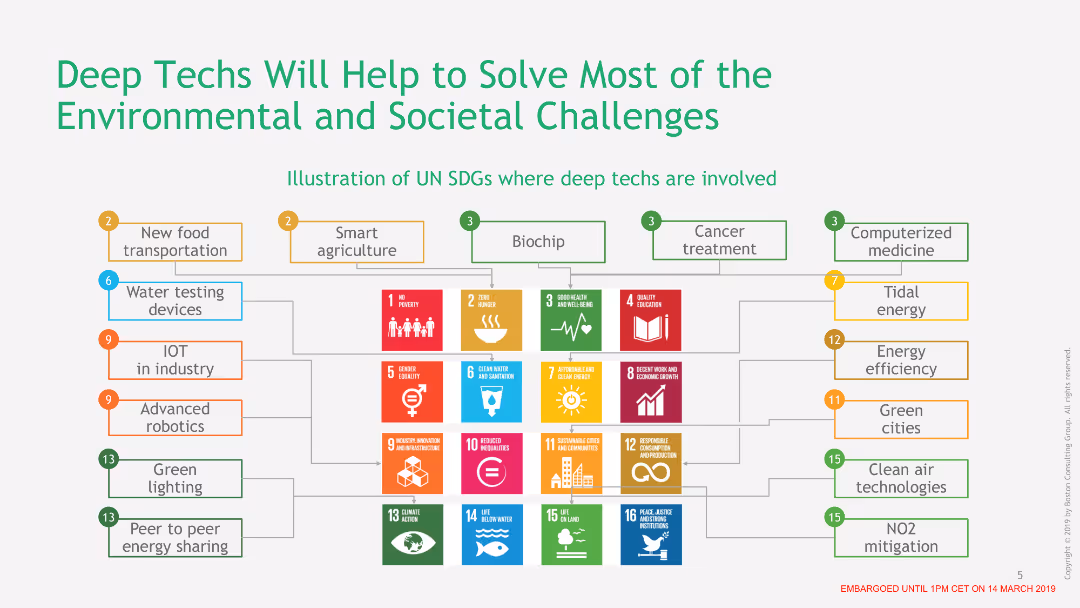
The slide shows a diagram illustrating the UN Sustainable Development Goals (SDGs) where deep technologies are involved. Various icons and arrows connect different tech solutions to specific SDGs.
Technology and Digital Transformation
Technology & Software
This slide explains how deep technologies like smart agriculture, biochips, and advanced robotics can help achieve various UN SDGs. It demonstrates the potential impact of these technologies on environmental and societal challenges.
Deep Tech, SDGs, Environmental, Societal, Technology, Impact
false
Technology and Digital Transformation
Technology & Software technology-and-software
Diagram
BCG
View slide
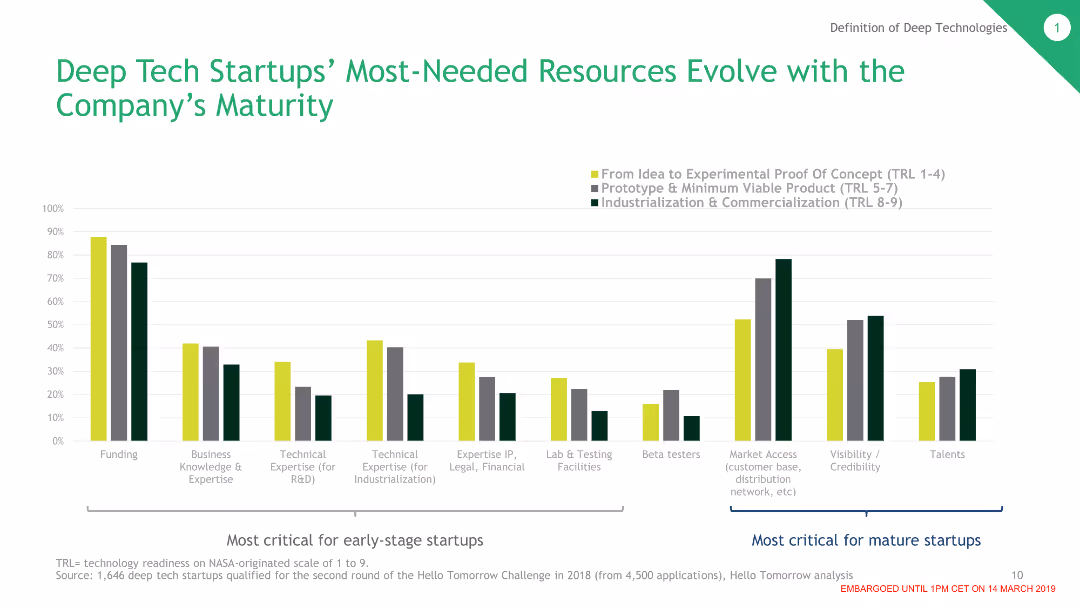
The slide shows a column chart indicating the most-needed resources for deep tech startups at different stages of maturity. Categories are color-coded and the chart shows varying needs from idea to experimental proof to commercialization.
Market Analysis and Trends
Technology & Software
This slide outlines the evolving resource needs for deep tech startups as they mature. It breaks down critical resources required at different stages, from initial idea and experimental proof to prototype and commercialization.
Deep Tech, Startups, Resources, Maturity, Funding, Expertise, Commercialization
false
Market Analysis and Trends
Technology & Software technology-and-software
Single Chart
BCG
View slide
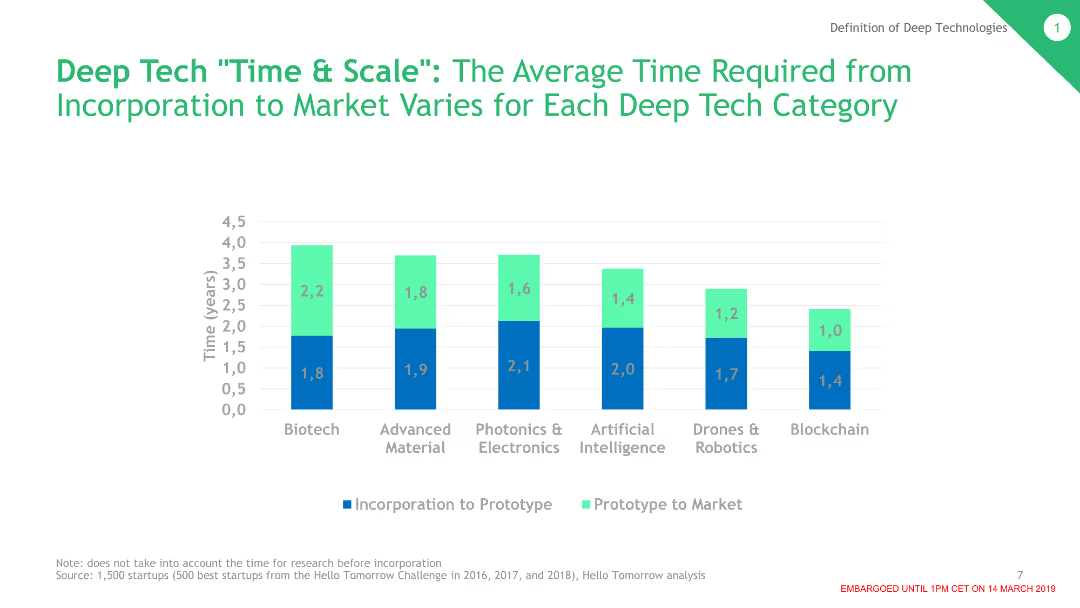
The slide contains a column chart showing the average time required from incorporation to market for various deep tech categories. Each category is represented with different colored columns indicating the stages from incorporation to prototype to market.
Technology and Digital Transformation
Technology & Software
This slide presents data on the time needed for different deep tech categories to go from incorporation to market. Categories include Biotech, Advanced Material, Photonics & Electronics, AI, Drones & Robotics, and Blockchain.
Deep Tech, Time to Market, Biotech, AI, Robotics, Blockchain
false
Technology and Digital Transformation
Technology & Software technology-and-software
Single Chart
BCG
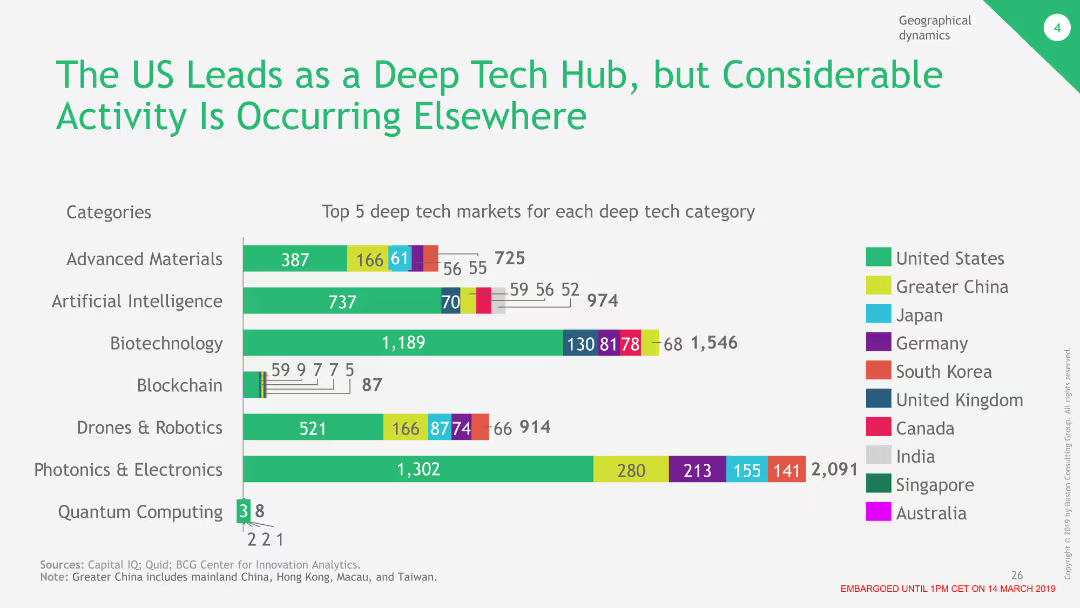
View slide
The slide contains a column chart showing the top 5 deep tech markets for various categories like advanced materials, AI, and biotechnology, with different colors representing different regions.
Market Analysis and Trends
Technology & Software
This slide compares the activity levels in deep tech across different countries, showing that while the US leads in several categories, other regions are also significant players in the market.
Deep Tech, US, Market, Comparison, Regions
false
Market Analysis and Trends
Technology & Software technology-and-software
Single Chart
BCG
View slide
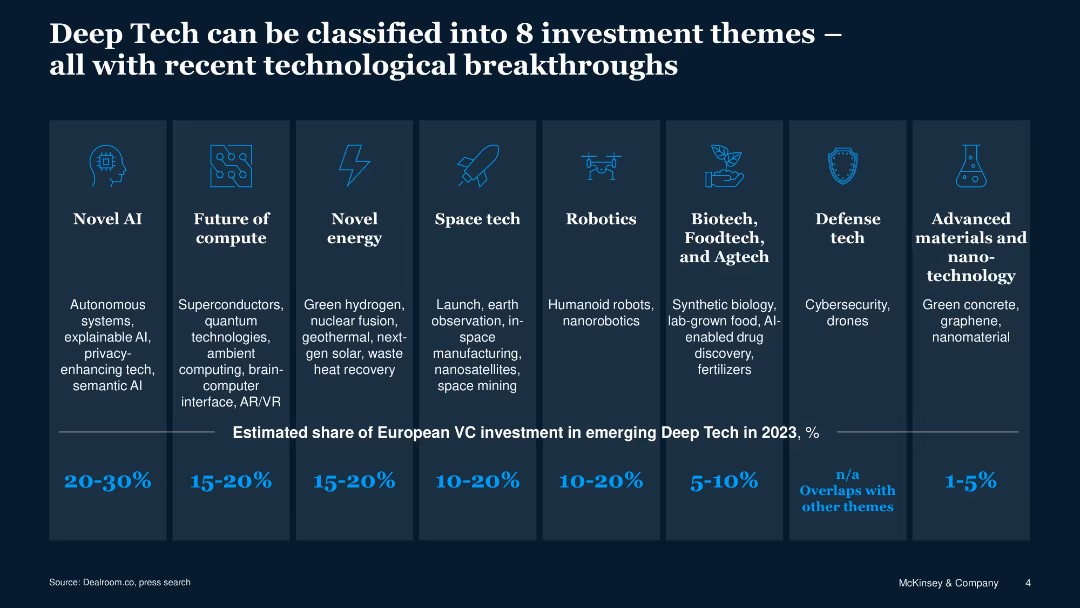
Grid layout with 8 vertical panels, each describing a different Deep Tech category; includes icons and text per panel
Product and Service Analysis
Artificial Intelligence
Categorizes Deep Tech into 8 investment themes such as Novel AI, Future of Compute, Robotics, and Space Tech, and shows their share in European VC investment in 2023.
Deep Tech, VC, themes, investment, AI, robotics, space, compute, biotech
false
Product and Service Analysis
Artificial Intelligence artificial-intelligence
Pillar
McKinsey
View slide
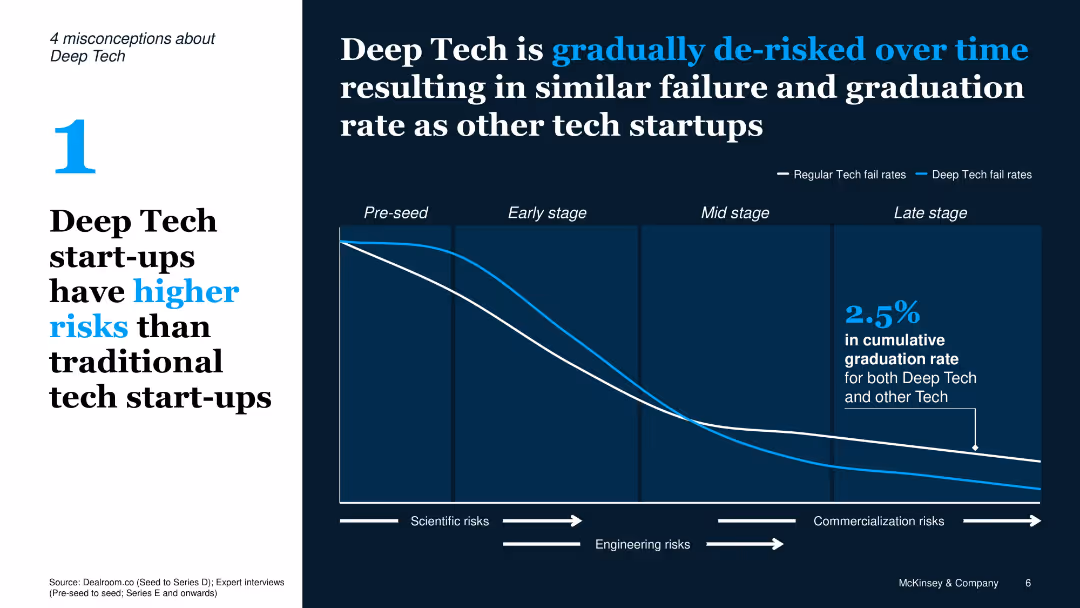
Split layout with misconception text on left and chart on right; line graph comparing fail rates of Deep Tech vs traditional tech over lifecycle stages
Risk Assessment and Management
Artificial Intelligence
Refutes the notion that Deep Tech has higher failure rates by showing it becomes de-risked over time; line graph compares failure rates of tech startups through different stages.
Deep Tech, risks, failure rate, tech lifecycle, de-risked, chart, misconception
false
Risk Assessment and Management
Artificial Intelligence artificial-intelligence
Single Chart
McKinsey
View slide
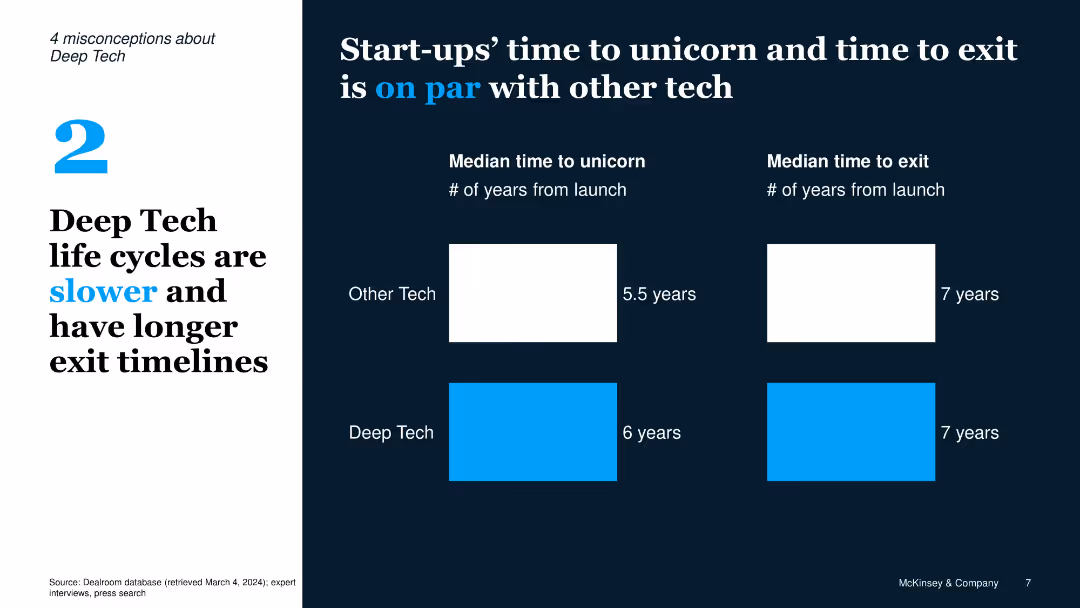
Two-column layout with text on left and infographic-style comparison on right; uses bars to compare median time to unicorn and exit
Strategic Planning
Artificial Intelligence
Dispels the myth that Deep Tech startups have longer life cycles; data shows time to unicorn and exit are nearly equal compared to traditional tech startups.
Deep Tech, unicorn, exit, timeline, comparison, misconception, lifecycle, startups
false
Strategic Planning
Artificial Intelligence artificial-intelligence
Single Chart
McKinsey
View slide
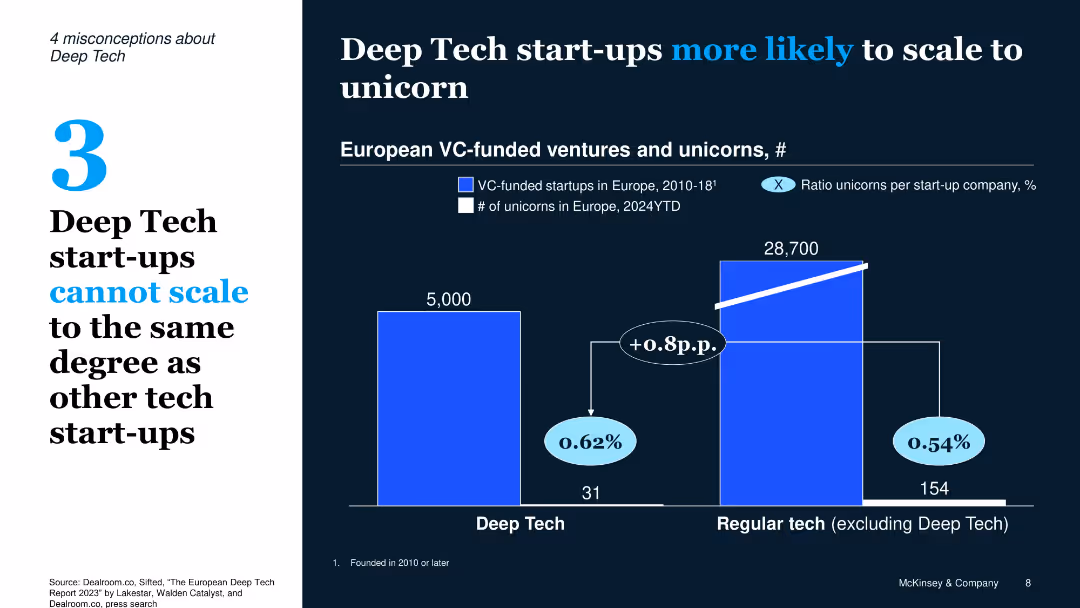
Dual-panel bar chart with bold contrast layout, white-on-dark theme, left-side callout with misconception number
Market Analysis and Trends
Technology & Software
The slide debunks the myth that Deep Tech start-ups can't scale, showing they have a slightly higher chance (0.62%) of becoming unicorns compared to regular tech (0.54%) based on VC-funded ventures and unicorn counts in Europe.
Deep Tech, unicorn, scalability, VC funding, Europe, start-ups, market analysis
false
Market Analysis and Trends
Technology & Software technology-and-software
Single Chart
McKinsey
View slide
The slide compares two aspects: market trends and defense budgets across different regions, using a map and red text boxes. A red outline frames the slide's main message.
Market Analysis and Trends
Industrial & Manufacturing
Analyzes defense market trends and budget growth to identify commercial opportunities. It provides a global outlook on market potential and the company’s position in it. This slide is likely used in market analysis and strategic planning sessions.
Defense Market, Trends, Commercial Opportunities, Budget Growth, Strategic Planning
false
Market Analysis and Trends
Industrial & Manufacturing industrial-and-manufacturing
Boxed
Goldman Sachs
View slide
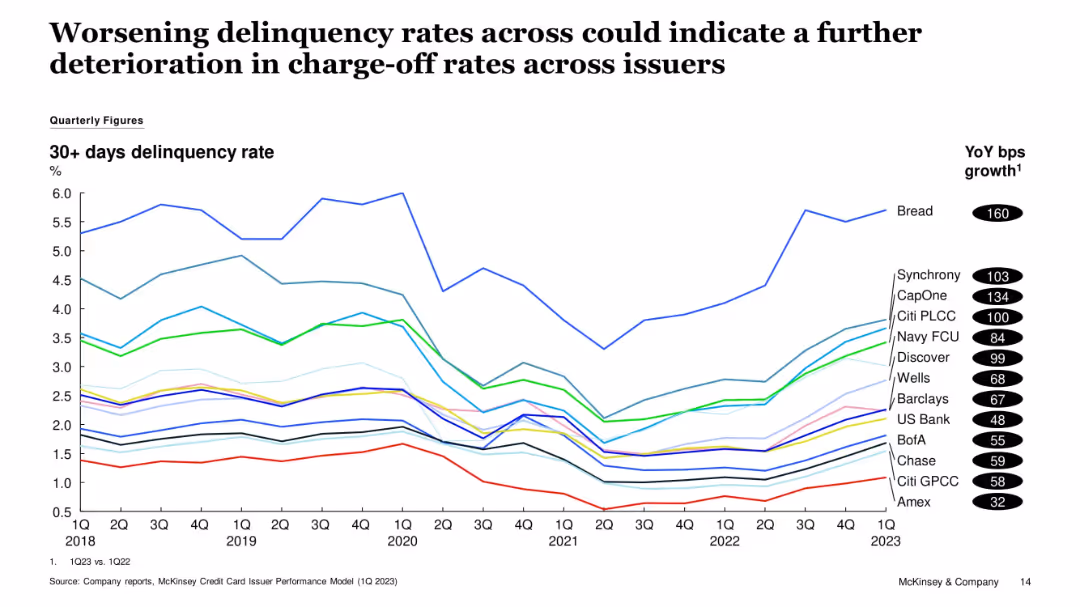
Time series line chart showing 30+ days delinquency rates by issuer from 1Q18 to 1Q23. Bread shows the highest increase. YoY bps growth listed on the right.
Risk Assessment and Management
Financial Services
The chart shows a worsening trend in delinquency rates among issuers, especially Bread, CapOne, and Synchrony. This suggests potential for higher future charge-off rates. The data spans 5 years with consistent issuer tracking.
Delinquencies, Credit Cards, CapOne, Synchrony, Bread, Risk Trends
false
Risk Assessment and Management
Financial Services financial-services
Single Chart
McKinsey
View slide
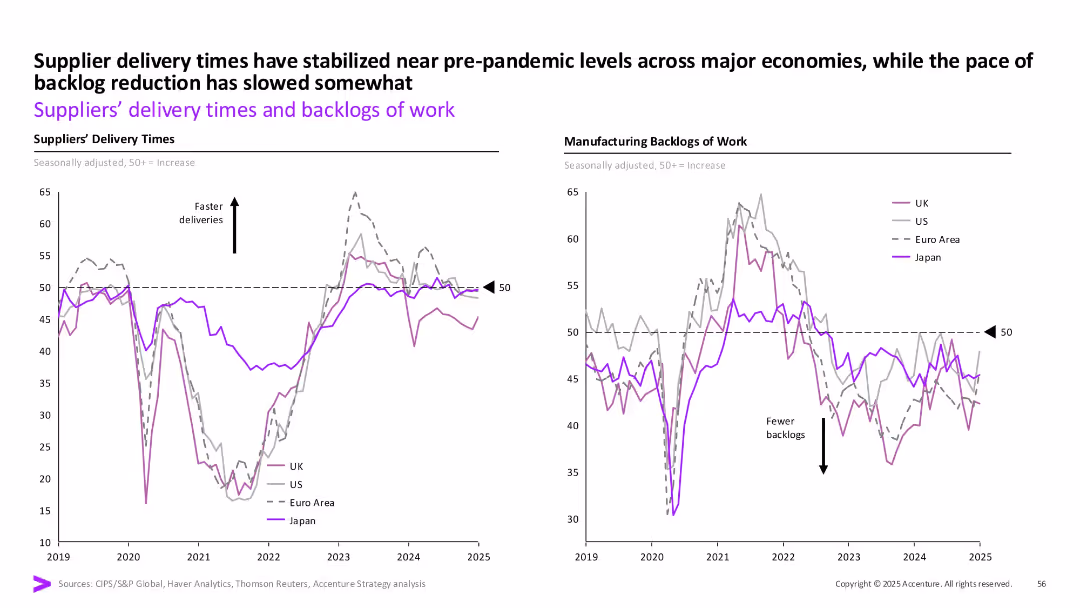
Dual line charts (delivery times left, backlogs right) by region with consistent styling, labeled axis and arrows.
Operational Efficiency
Industrial & Manufacturing
The slide shows that supplier delivery times have returned to near pre-pandemic levels across regions while backlog reduction has slowed. It emphasizes operational recovery with regional disparities post-COVID.
Delivery times, manufacturing, UK, US, Euro Area, Japan, backlog, stabilization
false
Operational Efficiency
Industrial & Manufacturing industrial-and-manufacturing
Multiple Chart
Accenture
View slide
Multiple sections, logos, screenshots, mixed layouts
Technology and Digital Transformation
Technology & Software
Outlines Deloitte's CAI solutions and partnerships
Deloitte, CAI, TrueServe, NVIDIA
false
Technology and Digital Transformation
Technology & Software technology-and-software
Framework
Deloitte
View slide
Features multiple icons and brief text descriptions organized in a grid, detailing different aspects of Deloitte's end-to-end support for digitizing finance functions.
Technology and Digital Transformation
Professional Services
Explains Deloitte’s capabilities in assisting organizations to go digital with their finance functions, covering diagnostics, data model design, technology deployment, and change management, highlighted by a visual framework.
Deloitte, digital finance, end-to-end support, technology deployment, change management, finance function, policy design, strategic value
false
Technology and Digital Transformation
Professional Services professional-services
Header Vertical
Deloitte
View slide
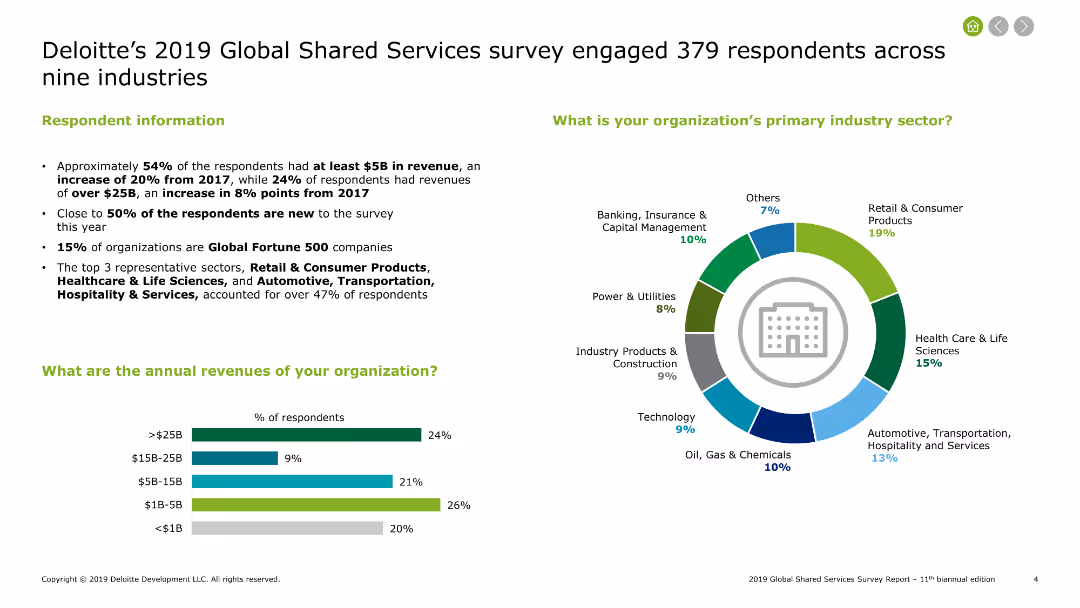
Text and charts showing survey respondent information, primary industry sectors, and annual revenues of organizations involved in shared services.
Market Analysis and Trends
Professional Services
Summarizes Deloitte's 2019 survey results on global shared services, including industry sectors, revenue ranges, and the distribution of respondents across various industries.
Deloitte, survey, shared services, industries, revenues
false
Market Analysis and Trends
Professional Services professional-services
Multiple Chart
Deloitte
View slide
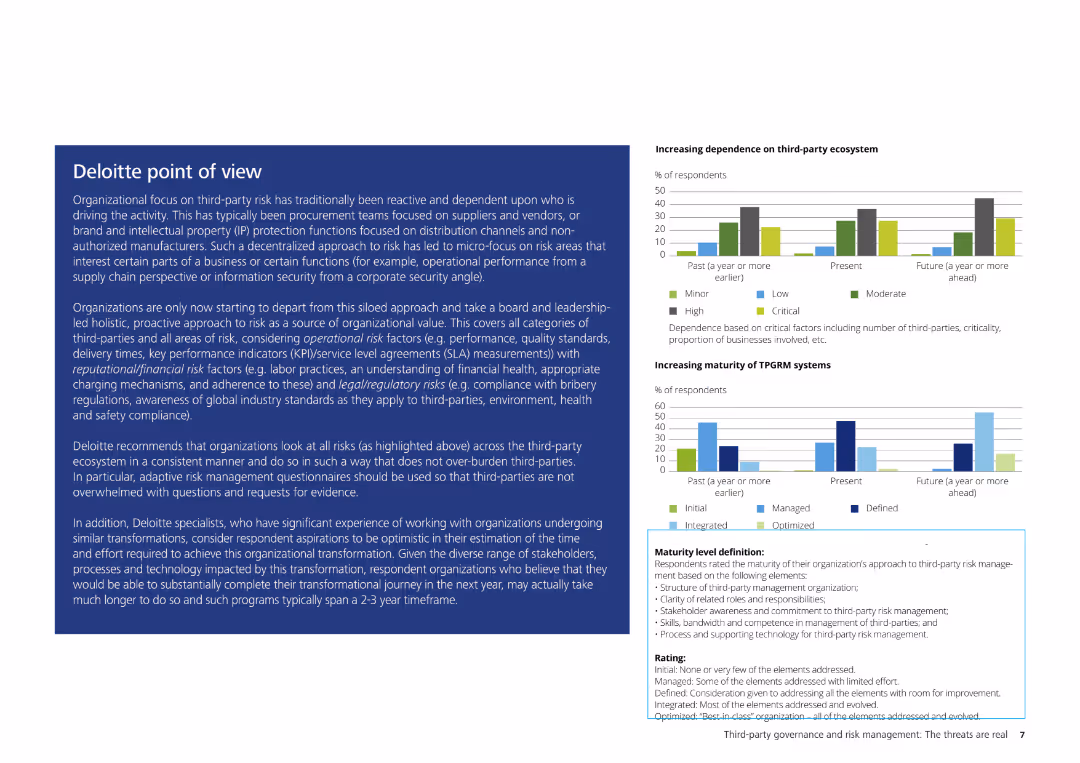
The slide contains a detailed text description of Deloitte's perspective on third-party risk, accompanied by small charts illustrating increasing dependence on third-party ecosystems and the maturity of TPRGM systems.
Risk Assessment and Management
Professional Services
This slide provides Deloitte's perspective on third-party risk management, highlighting the importance of a proactive, holistic approach to risk. It discusses various risk factors and offers recommendations for improving third-party risk management processes.
Deloitte, third-party risk, risk management, TPRGM systems, professional services, risk assessment, organizational strategy
false
Risk Assessment and Management
Professional Services professional-services
Multiple Chart
Deloitte
Previous
Loading...
Hold On!
We are searching in our database
If nothing, comes up, please try different filters!
Column Chart
Heatmap
Chevron
Org Chart
Infographic
Callouts
Timeline
List
Graphic
Picture
Process Flow
Diagram
Paragraph
Map
Table
Framework
Subtitle
Takeaway Box
Icon
Other Chart
Radar Chart
Waterfall Chart
Mekko Chart
Pie Chart
Scatter Plot
Line Chart
Bar chart
Bullet points
Create a FREE account to continue browsing
Receive Instant Access to 1,000+ slides from companies like McKinsey, Google, and Goldman Sachs
First Name
Last Name
Email
Password
I agree to all
Terms & Privacy Policy
Thank you! Your submission has been received!
Oops! Something went wrong while submitting the form.
Have an account?
Sign in
Upgrade to PRO to Save slides
Advanced Search and Filters
Access to 15,000+ slides
Access to Category Pages
Save/Bookmark Slides
PowerPoint Template Library
Pick a Plan
MONTHLY
$12/month
Billed every month, Cancel anytime.
YEARLY
$9/year
Billed $108 annually, Cancel anytime.
Checkout for $12/month
Checkout for $108/yr
Secured by Stripe | AES-256 bit encryption


![Q. To what extent, if at all, are the following factors inhibiting your company’s ability to decarbonise its business model? [NET: To a large extent & to a very large extent]](https://cdn.prod.website-files.com/654e70fb59937215cac87b19/689995e10727c755a849efc5_o1RhJtnqkTC-hu0CXC7T7uW162mbSiNYk370rFrRrQ8.avif)