My Account
My Slides
Search by Category
Templates
View All Templates
Download Template Slides
Leave Feedback
Login
Logout
Get Started
Browse all Slides
Browse all Slides
Create a FREE Account
Instant access to 1,000+ real slides from top companies like McKinsey, BCG, Goldman Sachs, Google and many more!
First Name
Last Name
Email
Password
I agree to all
Terms & Privacy Policy
Thank you! Your submission has been received!
Oops! Something went wrong while submitting the form.
Have an account?
Sign in
Spark Your Next Big Idea with New Presentation Templates
VIEW ALL Templates
Welcome,
Welcome
PRO
Show Featured Only
Checkbox 8
Companies
Mckinsey
Bain
BCG
EY
Deloitte
Accenture
PwC/Strategy&
JP Morgan
Goldman Sachs
Morgan Stanley
Citigroup
Deutsche Bank
Barclays
LEK
KPMG
Kearney
Oliver Wyman
Booz Allen Hamilton
Gartner
IPSOS
Nielsen
Slide type
Text Only
Linear Flow
Vertical Flow
Single Chart
Header Horizontal
Mixed Chart
Header Vertical
Pillar
Multiple Chart
Graphic
Agenda
Title
Table
Framework
Industry
Technology & Software
Artificial Intelligence
Financial Services
Retail & E-commerce
Consumer Goods
Industrial & Manufacturing
Transportation & Logistics
Telecommunications
Real Estate & Construction
Hospitality & Tourism
Professional Services
Education & Training
Media & Entertainment
Agriculture & Food Production
Healthcare & Pharmaceuticals
Environmental Services & Sustainability
Government & Public Sector
Use Case
Mergers and Acquisitions
Performance Metrics and KPIs
Client Case Studies
Competitive Landscape
Corporate Finance and Valuation
Product and Service Analysis
Customer and Market Segmentation
Organizational Structure and Change
Industry Overview
Regulatory and Compliance
Risk Assessment and Management
Investment Analysis
Organizational Structure and Change
Human Resources and Talent Management
Financial Performance
Market Analysis and Trends
Sales and Business Development
Human Resources and Talent Management
Clear all
Thank you! Your submission has been received!
Oops! Something went wrong while submitting the form.
Tag
View slide
The slide features three column charts displaying the adoption rates of digital solutions in hospitals, categorized into fundamental systems, patient-facing solutions, and physician support systems.
Technology and Digital Transformation
Healthcare & Pharmaceuticals
The slide outlines the adoption of various digital health solutions in hospitals, highlighting electronic medical records (EMR), patient information systems, and medication management systems as top priorities.
EMR, digital solutions, hospitals, adoption, IT systems
false
Technology and Digital Transformation
Healthcare & Pharmaceuticals healthcare-and-pharmaceuticals
Multiple Chart
LEK
View slide
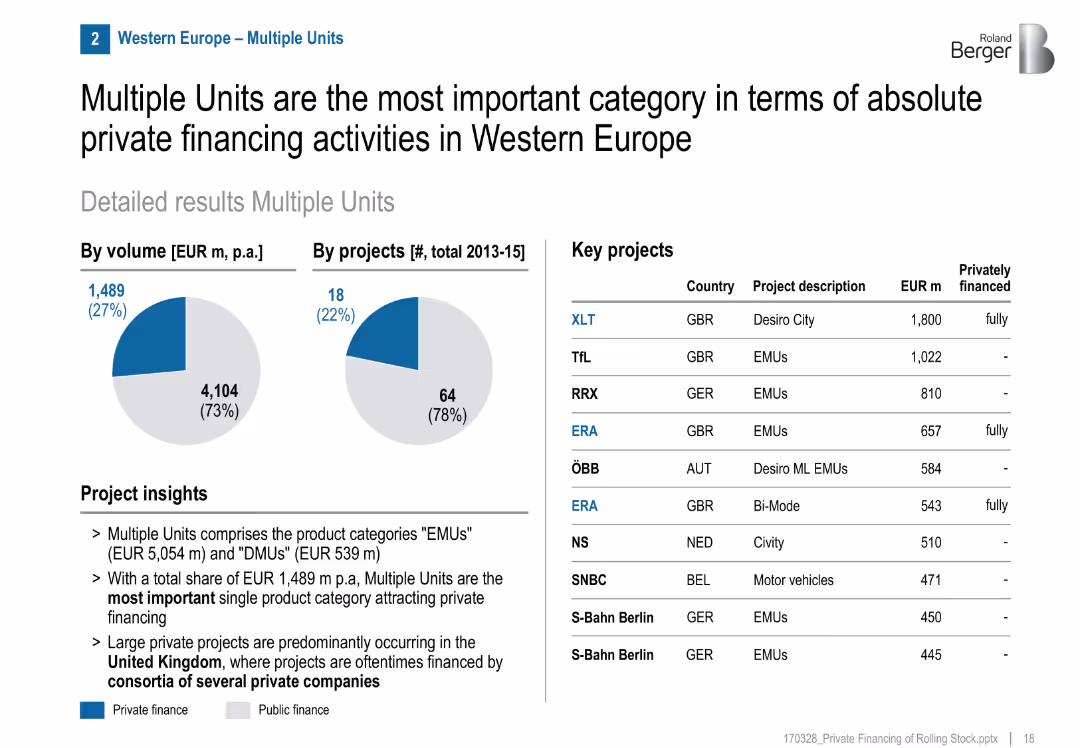
Pie charts for volume/projects, list of key projects, project insights section
Financial Performance
Transportation & Logistics
Multiple Units (EMU/DMU) are the leading category in private rail financing in Western Europe, especially in the UK. Several fully private projects were executed, often via consortia.
EMUs, DMUs, private investment, UK, consortia, rail, multiple units, GBR, financing structure
false
Financial Performance
Transportation & Logistics transportation-and-logistics
Mixed Chart
Roland Berger
View slide
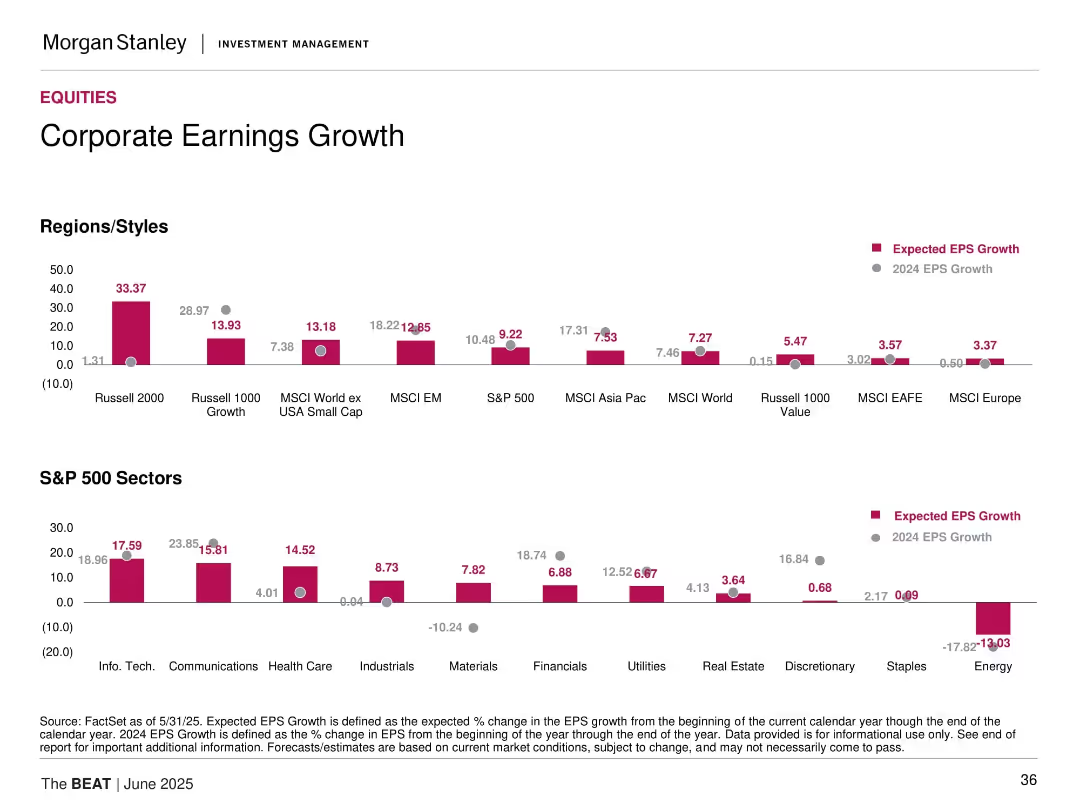
Two sets of column charts are present. The top set displays regional/style-based expected EPS growth versus actual EPS growth in 2022, using horizontal bars. The bottom set uses vertical bars to show S&P 500 sectors' EPS growth. Red and gray color schemes distinguish between expected and actual figures.
Investment Analysis
Financial Services
This slide examines the expected versus actual earnings per share growth for different regions and S&P 500 sectors, providing insights for investors and market analysts.
EPS growth, corporate earnings, regional analysis, sector performance, financial forecasting, investment strategy
false
Investment Analysis
Financial Services financial-services
Multiple Chart
Morgan Stanley
View slide
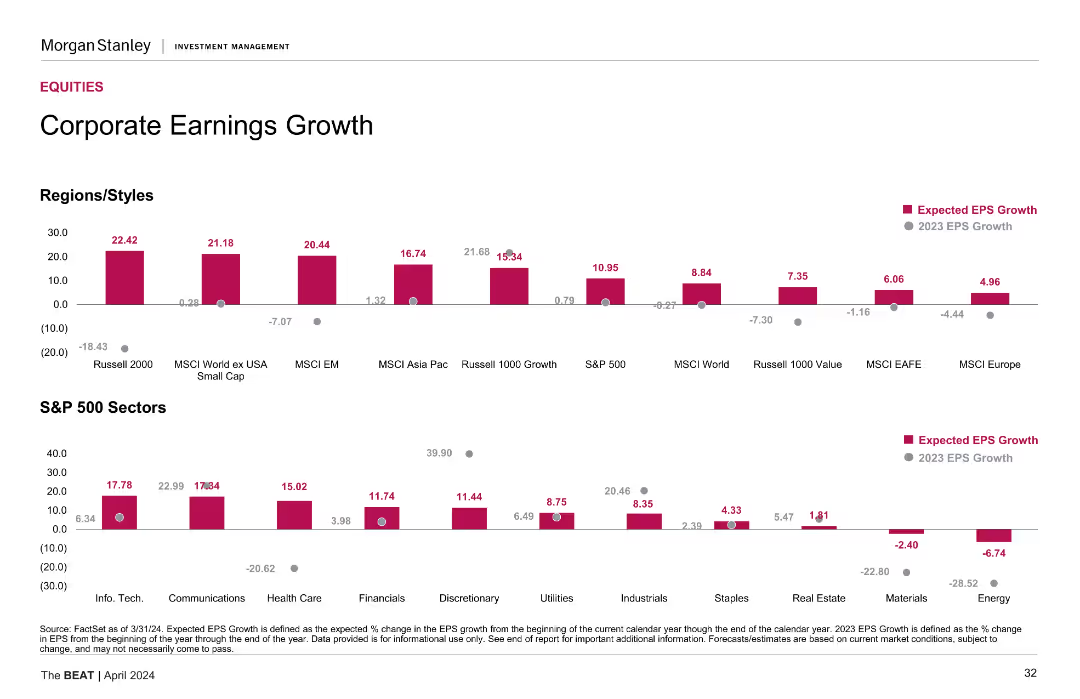
Vertical bar charts segmented by Regions/Styles and S&P 500 Sectors, with EPS growth data for 2024 and 2025.
Financial Performance
Financial Services
The slide presents projected earnings per share (EPS) growth for different global indices and S&P 500 sectors. It highlights strong expected growth in Russell 2000 and Technology, while sectors like Energy and Staples are forecasted to contract. A comparison with 2024 EPS growth is also provided.
EPS growth, earnings forecast, S&P 500 sectors, global indices, financial outlook, bar chart, projections, equities
false
Financial Performance
Financial Services financial-services
Multiple Chart
Morgan Stanley
View slide
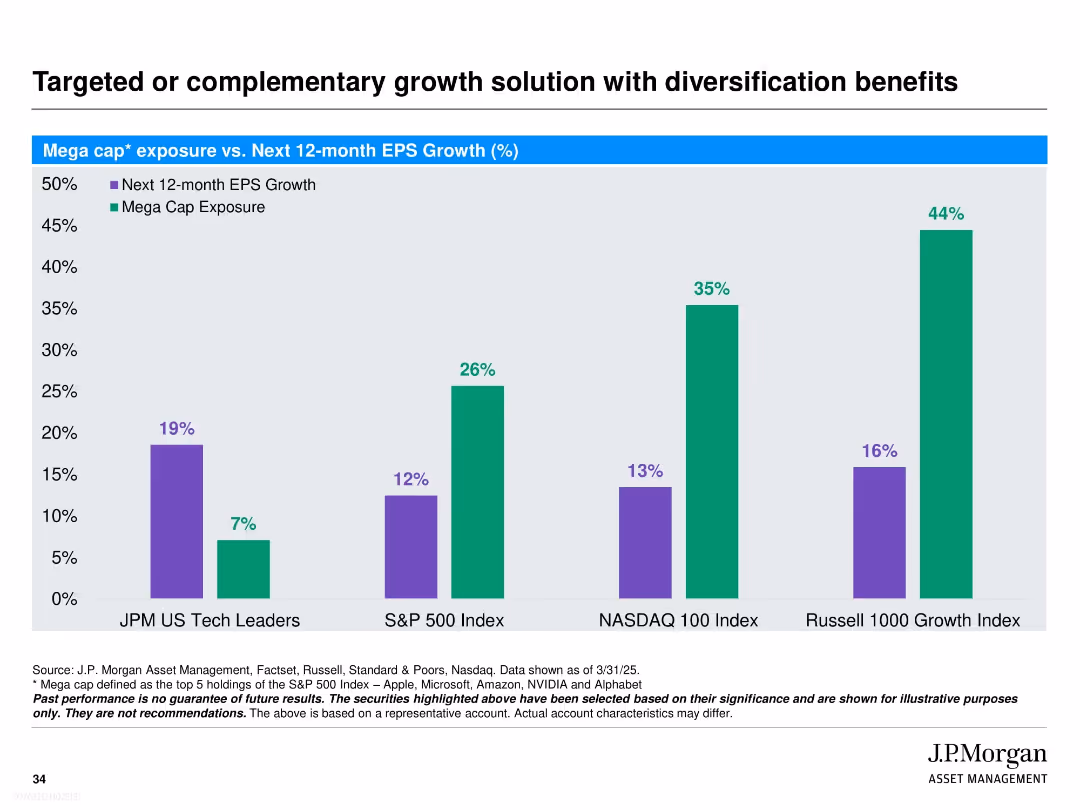
Bar chart compares next 12-month EPS growth vs. mega cap exposure across four indices. Two colors (purple and green) clearly distinguish variables. Simple structure with white background and bold headings.
Investment Analysis
Financial Services
This slide contrasts J.P. Morgan’s US Tech Leaders strategy with broader indices (S&P 500, NASDAQ 100, Russell 1000 Growth) on two metrics: expected EPS growth and mega cap exposure. It demonstrates that the JPM strategy offers higher expected growth with significantly lower mega cap concentration, suggesting a diversified approach with strong upside potential.
EPS growth, mega cap exposure, diversification, J.P. Morgan, tech leaders, S&P 500, NASDAQ, Russell 1000, investment strategy, index comparison
false
Investment Analysis
Financial Services financial-services
Single Chart
JP Morgan
View slide
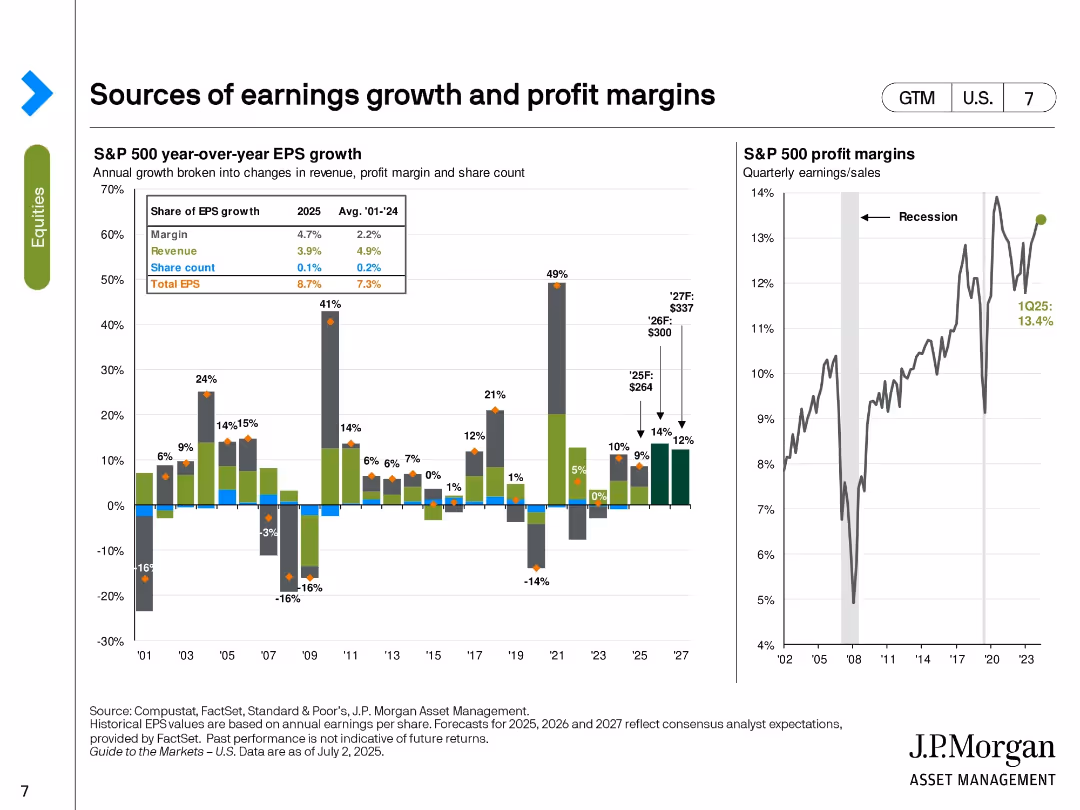
Bar and line charts showing EPS growth components and historical profit margins. EPS is broken down by margin, revenue, and share count changes.
Performance Metrics and KPIs
Financial Services
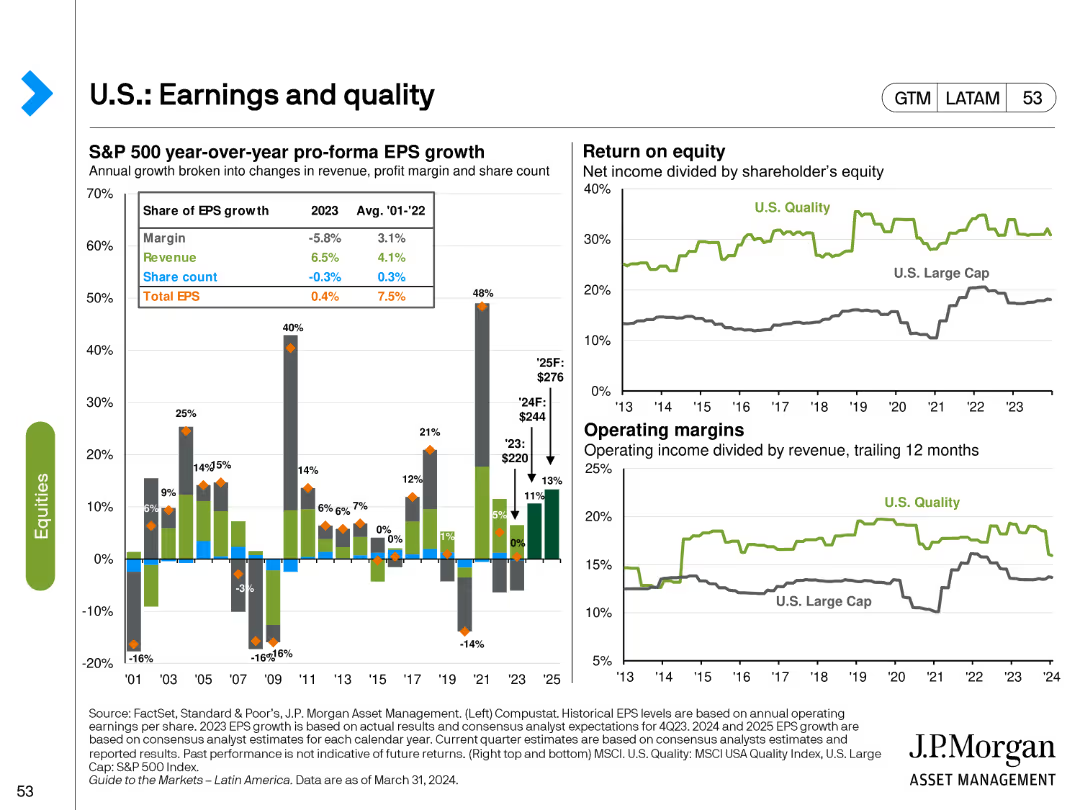
The slide illustrates the breakdown of S&P 500 EPS growth in 2025, emphasizing margins as the largest contributor (4.7%). It also includes a line chart tracking profit margins over time, highlighting a recent level of 13.4% in Q1 2025. Forecasts for EPS and margins through 2027 are included.
EPS growth, profit margin, revenue, share count, S&P 500, forecast, earnings, financial performance, historical trends
false
Performance Metrics and KPIs
Financial Services financial-services
Multiple Chart
JP Morgan
View slide
The slide features two column charts: one for EPS growth of various regions/styles and one for S&P 500 sectors, comparing expected EPS growth with previous year's growth.
Market Analysis and Trends
Financial Services
This slide analyzes the expected corporate earnings growth across different regions, styles, and S&P 500 sectors, comparing it with the previous year's growth figures.
EPS growth, regions, S&P 500, earnings, analysis
false
Market Analysis and Trends
Financial Services financial-services
Multiple Chart
Morgan Stanley
View slide
The slide features a bar chart for S&P 500 EPS growth components and line charts for return on equity and operating margins. Different colors and markers highlight various aspects of earnings growth and quality.
Financial Performance
Financial Services
It analyzes the components of EPS growth, return on equity, and operating margins for U.S. equities, providing insights into the quality and sustainability of earnings in the S&P 500 index.
EPS growth, return on equity, operating margins, S&P 500, financial quality
false
Financial Performance
Financial Services financial-services
Multiple Chart
JP Morgan
View slide
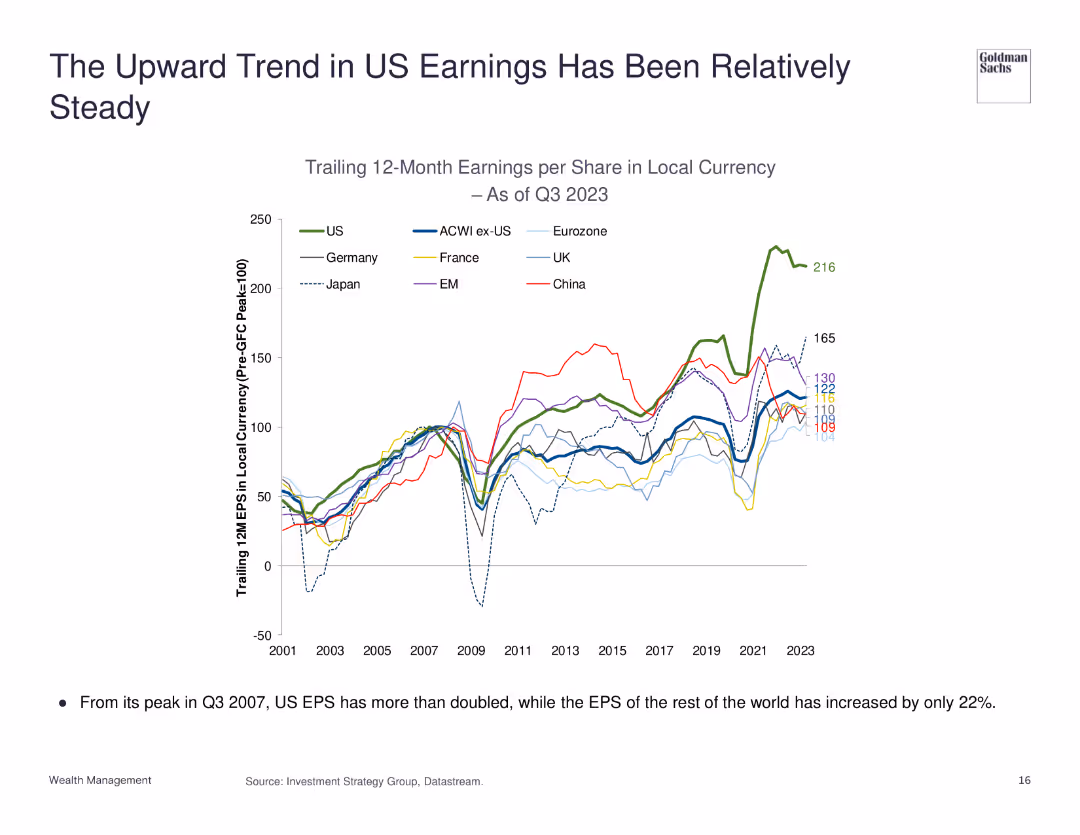
The slide presents a line chart showing the earnings per share (EPS) trends for various regions, with US EPS growth prominently displayed.
Financial Performance
Financial Services
The slide highlights the consistent upward trend in US earnings per share (EPS) over the years, comparing it with the EPS growth of other regions to show relative performance.
EPS, Earnings, US, Performance, Trend
false
Financial Performance
Financial Services financial-services
Single Chart
Goldman Sachs
View slide
This slide presents a growth trend using a column chart to illustrate EPS growth from FY12 to FY17, with a projection for FY17. The chart uses shades of blue to differentiate the years, accompanied by a rising arrow indicating growth over time. The design is simple yet effective, focusing on financial data.
Financial Performance
Consumer Goods
The slide discusses Tyson's EPS growth over a five-year period, projecting future earnings. It emphasizes the company’s consistent financial growth and strategic financial planning, aiming to inform investors and stakeholders about its financial health and future earnings potential.
EPS, Growth, Financial, Projection, Tyson, Analysis
false
Financial Performance
Consumer Goods consumer-goods
Single Chart
Barclays
View slide
The slide features a table, a column chart showing net revenues by segment, and a section with bullet points highlighting financial overview. The design is moderate with a clear visual hierarchy.
Financial Performance
Financial Services
This slide provides a financial overview of a company’s quarterly results, comparing current and past figures. It is likely used to communicate financial health to stakeholders or in investor presentations. Data includes earnings per share, net revenues, and a breakdown of financial results by banking and market segment.
EPS, ROE, Net Revenues, Global Banking, Asset & Wealth Management
false
Financial Performance
Financial Services financial-services
Mixed Chart
Goldman Sachs
View slide
A line chart showing Eaton's adjusted earnings per share (EPS) from 2000 to 2019, with an upward trend noted as an 8% CAGR.
Financial Performance
Financial Services
Provides a clear view of Eaton's long-term earnings growth, reflecting effective financial management and operational efficiency.
EPS, financial growth, Eaton, CAGR, earnings
false
Financial Performance
Financial Services financial-services
Single Chart
Deutsche Bank
View slide
The slide features multiple column charts comparing expected EPS growth across various regions, styles, and S&P 500 sectors. The charts use different colors for clarity.
Financial Performance
Financial Services
The slide shows the expected EPS growth for 2024 in various regions, styles, and S&P 500 sectors, providing a comprehensive view of projected earnings performance.
EPS, growth, financial performance, S&P 500, regions
false
Financial Performance
Financial Services financial-services
Multiple Chart
Morgan Stanley
View slide
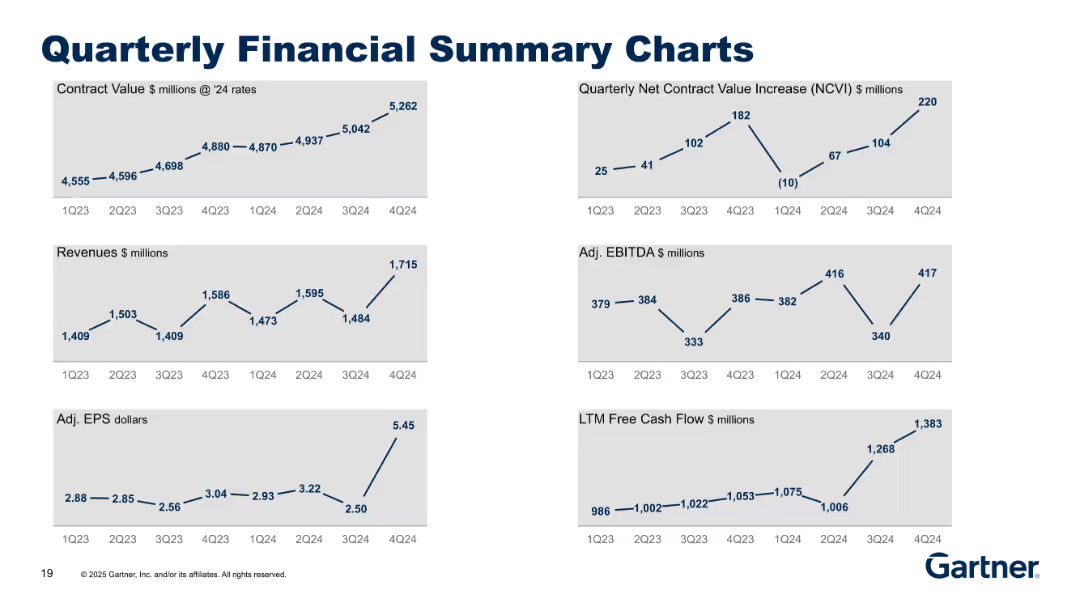
Same layout as 18621 but for 1Q23–4Q24. Six line charts showing financial performance metrics. Title is bold and centered.
Financial Performance
Technology & Software
Shows previous year’s quarterly financial performance across six key metrics. Helps compare historical trends with more recent data in 18621. Displays growth and inflection points across revenue, EBITDA, EPS, and cash flow.
EPS, revenue, EBITDA, NCVI, contract value, financial overview
false
Financial Performance
Technology & Software technology-and-software
Multiple Chart
Gartner
View slide
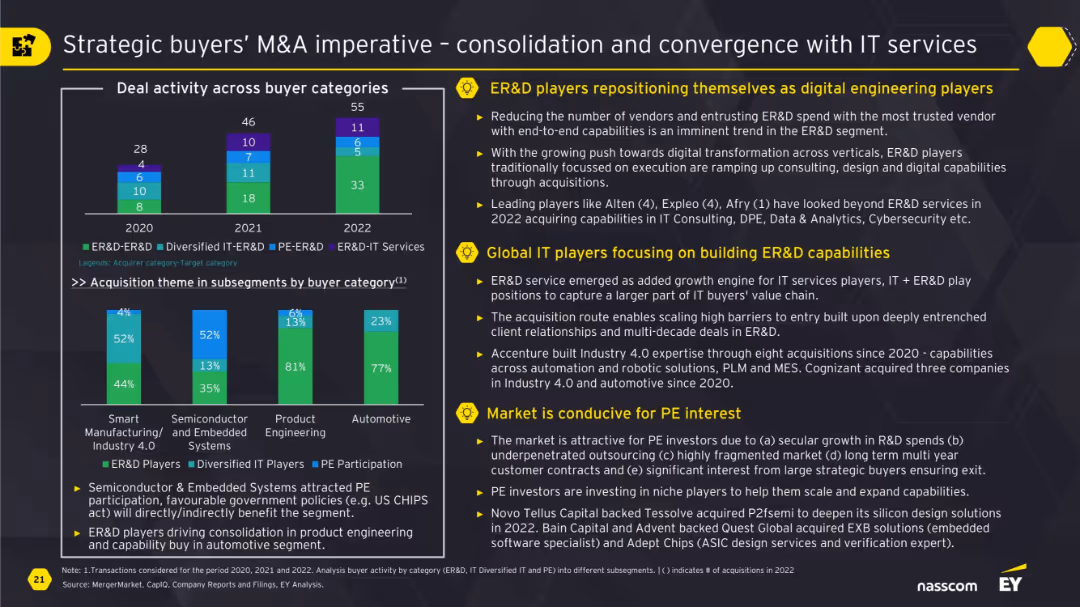
Bar chart comparing buyer categories over 3 years and stacked subsegment chart; side bullet points highlighting three strategic themes.
Strategic Planning
Technology & Software
The slide explains how ER&D players and global IT firms are converging through M&A to build digital engineering capabilities. It highlights shifting buyer strategies, rising interest in automation, and favorable conditions for PE investors due to government policies and secular growth in R&D spend.
ER&D, M&A, IT services, digital engineering, private equity, strategic buyers, consolidation
false
Strategic Planning
Technology & Software technology-and-software
Multiple Chart
EY
View slide
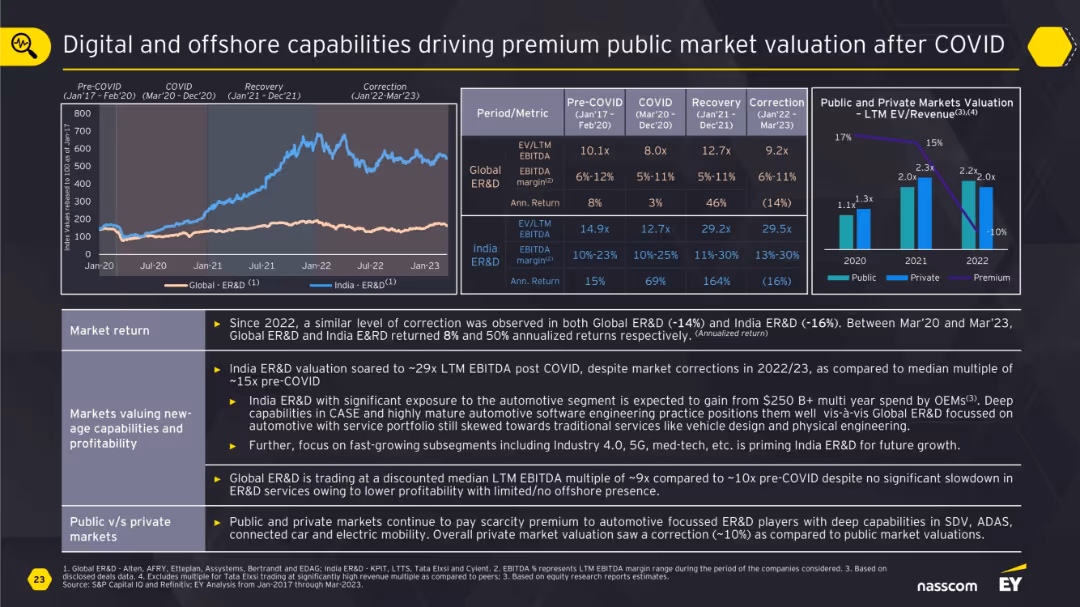
Two-line charts and two bar charts with multiple valuation and return metrics; structured in a matrix with explanations.
Financial Performance
Technology & Software
This slide presents the valuation premiums in public markets for Global and India ER&D post-COVID. It explores the correlation between digital/offshore capabilities and higher returns. It shows how investors favor niche engineering and automotive-focused firms with high profitability and innovation.
ER&D, valuation, digital, offshore, automotive, premium, public markets, returns
false
Financial Performance
Technology & Software technology-and-software
Multiple Chart
EY
View slide
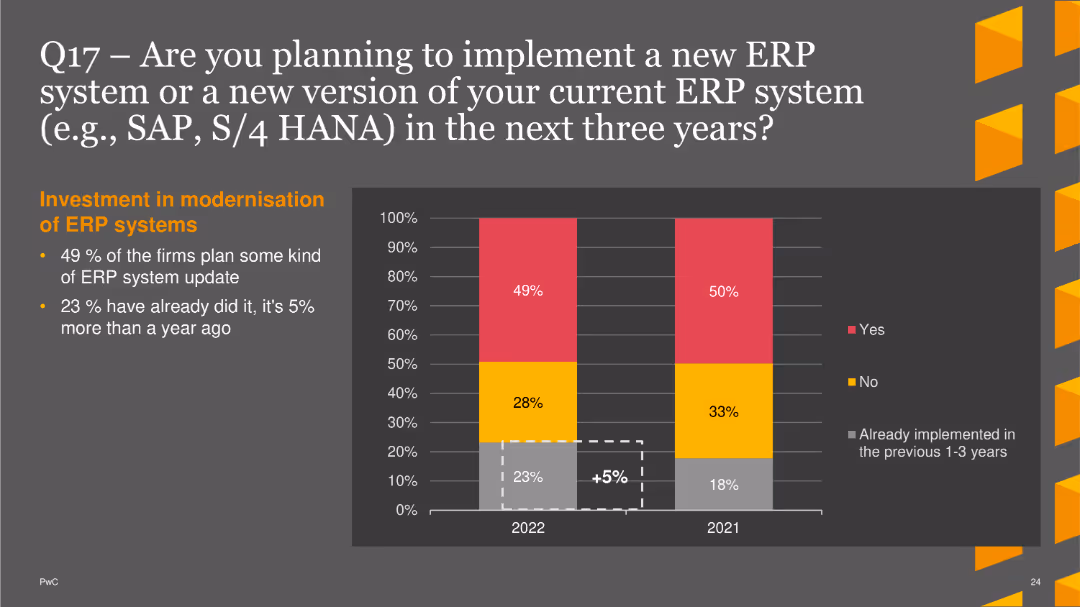
The slide includes a column chart illustrating firms' plans to update their ERP systems. It shows the percentage of firms planning updates, already implemented updates, and those not planning updates, for the years 2021 and 2022. The chart uses red for "yes", yellow for "no", and gray for "already implemented". A brief text section explains the statistics and trends in ERP system updates.
Technology and Digital Transformation
Financial Services
This slide provides data on the intentions of firms to implement or update their ERP systems within the next three years, highlighting trends in ERP modernization efforts. It helps in understanding the current state and future plans for ERP system adoption in the industry.
ERP systems, modernization, implementation, finance, technology, trends
false
Technology and Digital Transformation
Financial Services financial-services
Mixed Chart
PwC/Strategy&
View slide
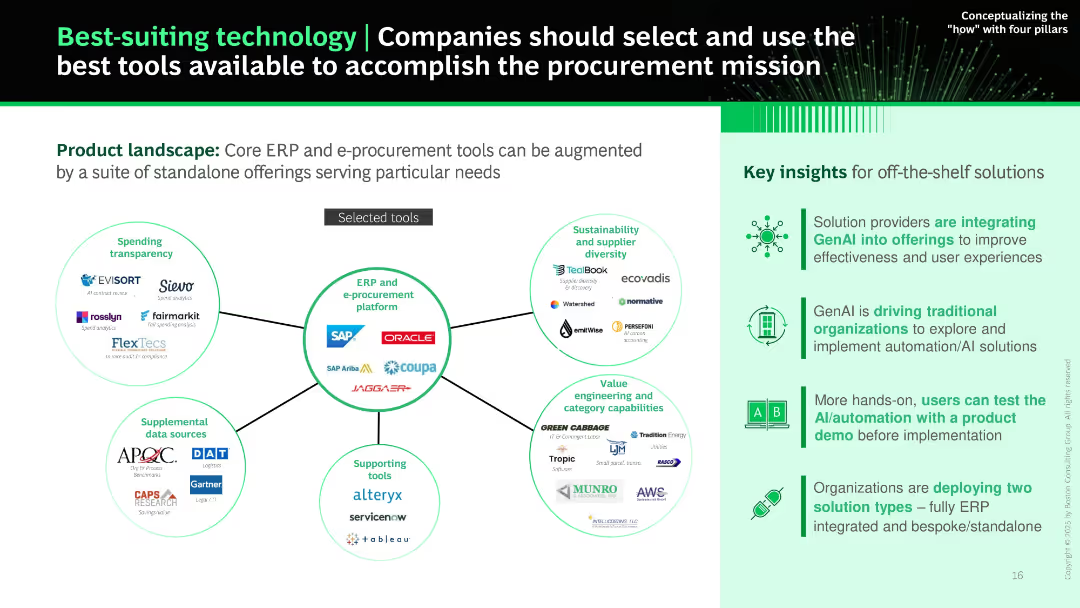
Central hub-and-spoke diagram surrounded by tool logos grouped by function (e.g., ERP, transparency, supplier diversity). Side panel summarizes key insights.
Product and Service Analysis
Technology & Software
Maps out the procurement technology landscape with core ERP platforms at the center and supplemental tools around them. Recommends selecting tools based on need and readiness for GenAI adoption. Insights include trends in ERP integration and standalone solution adoption.
ERP, procurement tools, technology selection, GenAI, software landscape, sourcing, AI tools
false
Product and Service Analysis
Technology & Software technology-and-software
Boxed
BCG
View slide
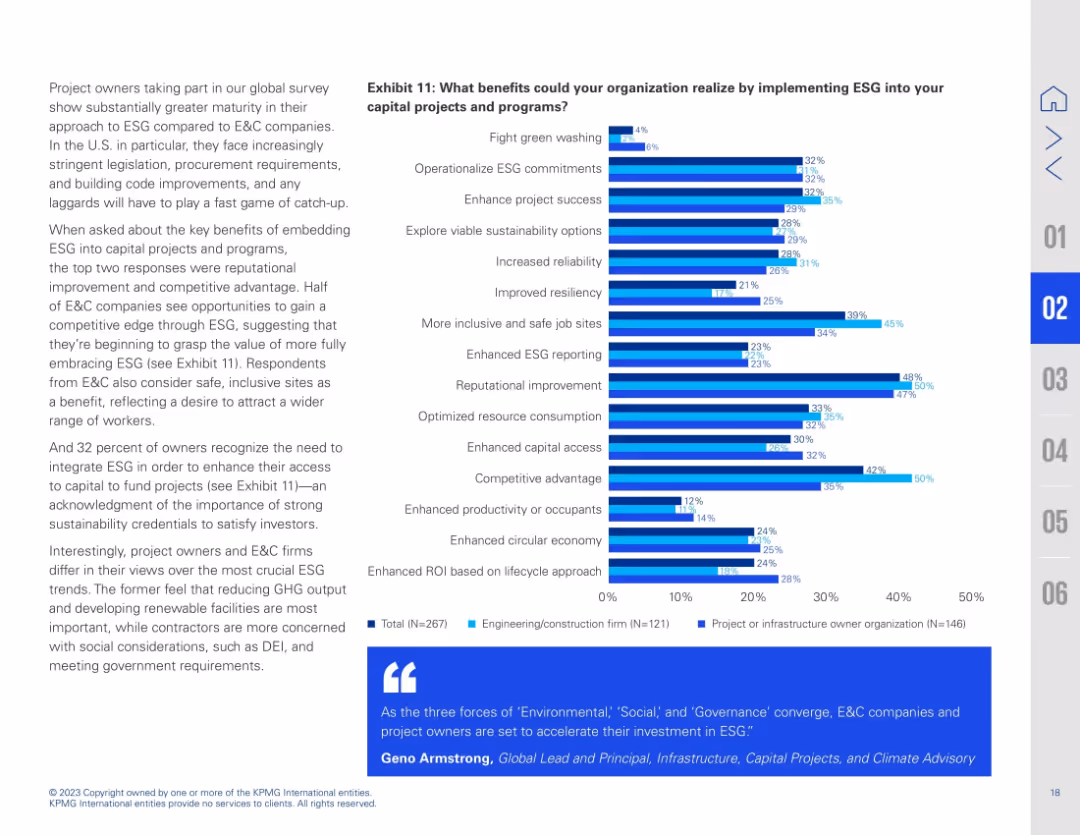
Left-aligned explanatory text and right-side bar chart with stacked responses. Bars show various benefits of implementing ESG in capital projects. Blue gradient used for three respondent groups.
Strategic Planning
Real Estate & Construction
This slide outlines potential benefits of embedding ESG into capital projects. Reputational improvement and competitive advantage rank highest, followed by enhanced ESG reporting and safer job sites. Project owners and E&C firms show different priorities: owners focus on emissions and renewable energy, while contractors emphasize social goals and compliance.
ESG benefits, competitive advantage, capital access, reputational improvement, sustainability, job safety, reporting
false
Strategic Planning
Real Estate & Construction real-estate-and-construction
Mixed Chart
KPMG
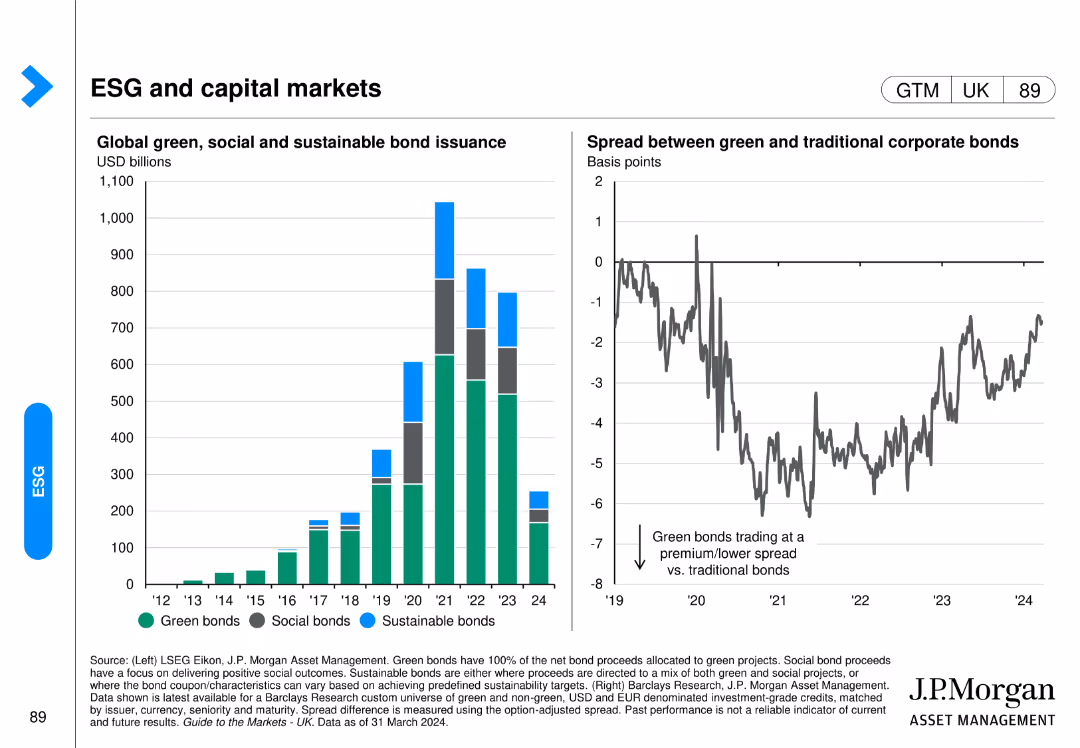
View slide
This slide has a column chart showing global green, social, and sustainable bond issuance and a line chart comparing the spread between green and traditional corporate bonds.
Investment Analysis
Financial Services
It focuses on the growth and comparative performance of ESG-related bonds in the capital markets, highlighting the financial aspects of sustainability in investment portfolios.
ESG bonds, capital markets, green bonds, sustainable investment, financial services, bond issuance, J.P. Morgan, investment analysis, market trends, social bonds
false
Investment Analysis
Financial Services financial-services
Multiple Chart
JP Morgan
View slide
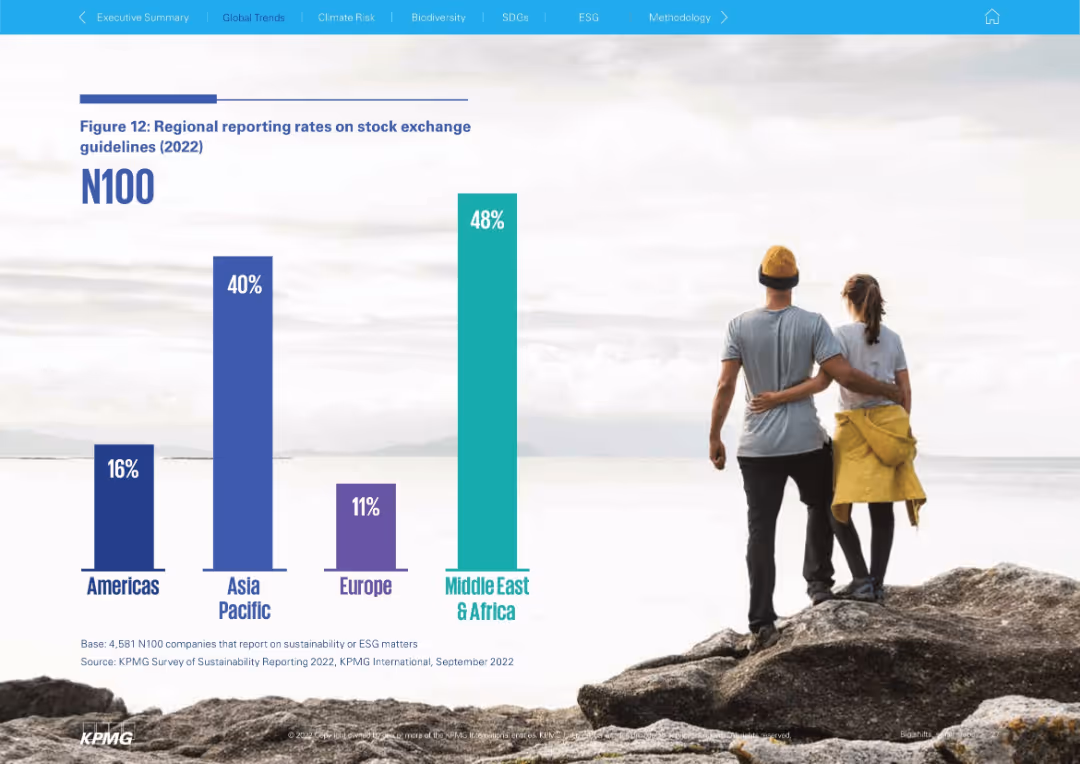
Full-screen vertical bar chart with minimal text and a photo of a couple on a rock background
Regulatory and Compliance
Professional Services
Provides a 2022 regional breakdown of N100 reporting rates based on stock exchange guidelines. Middle East & Africa leads at 48%, followed by Asia Pacific (40%), while Europe and the Americas lag behind.
ESG compliance, stock exchange, N100, Middle East, Asia Pacific, sustainability standards
false
Regulatory and Compliance
Professional Services professional-services
Single Chart
KPMG
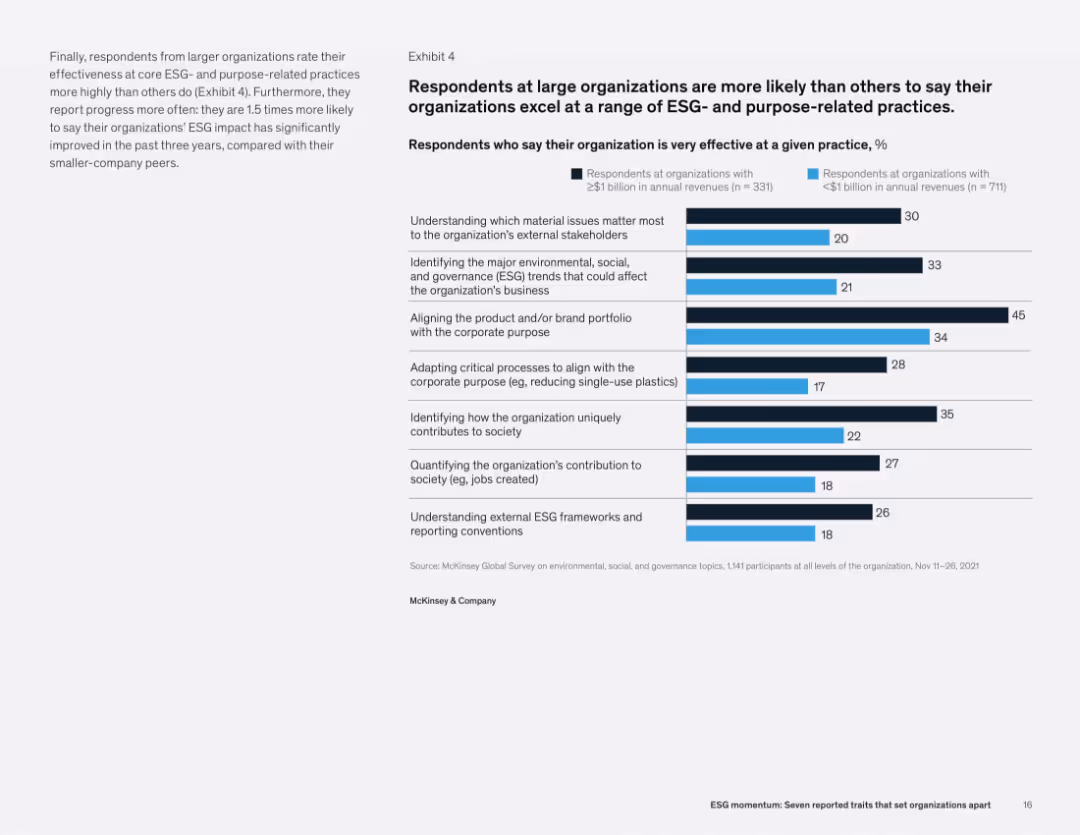
View slide
Text on left, and a bar chart on right showing how effective large vs. small organizations are at ESG practices like alignment, contribution tracking, and stakeholder engagement.
Operational Efficiency
Professional Services
Larger organizations report significantly higher effectiveness in various ESG practices, including stakeholder engagement, brand alignment with purpose, and trend identification. The data suggests a broader and more integrated ESG strategy in large firms.
ESG effectiveness, organizational practices, purpose alignment, stakeholder engagement, corporate strategy
false
Operational Efficiency
Professional Services professional-services
Mixed Chart
McKinsey
View slide
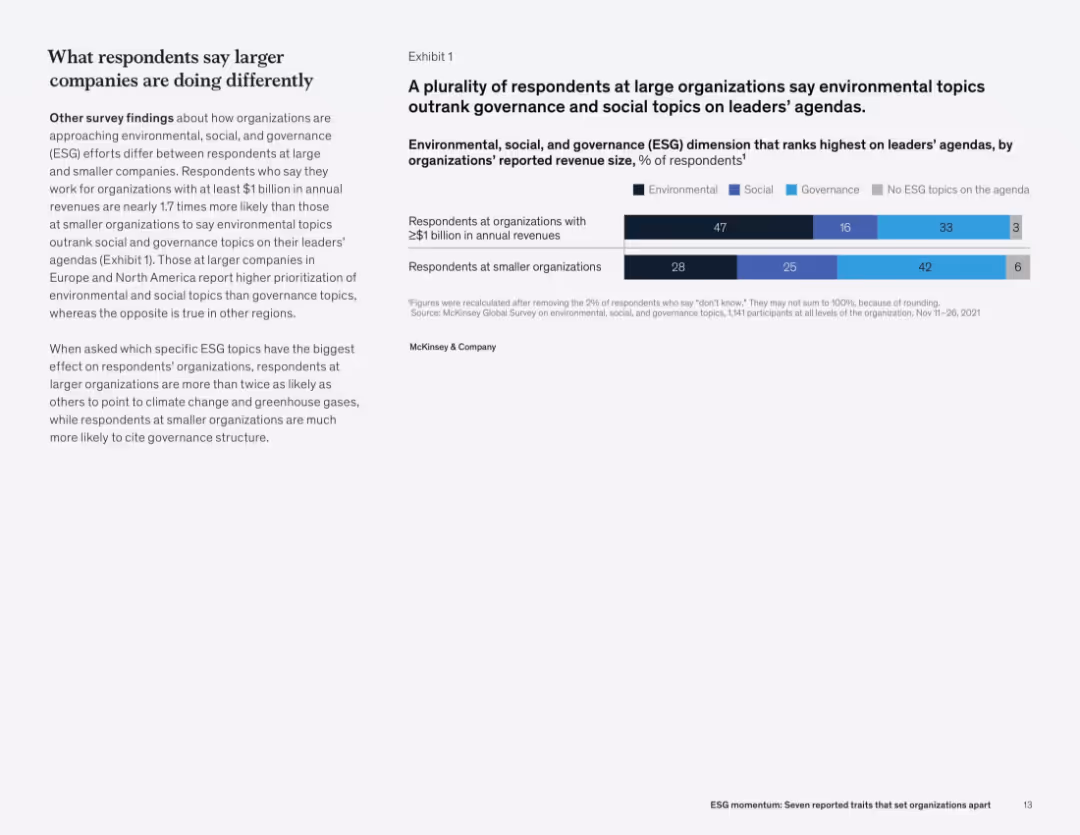
Two-column layout: left side contains text and analysis, right side presents a horizontal stacked bar chart segmented by organization size and ESG topic category.
Market Analysis and Trends
Professional Services
This slide shows that large organizations prioritize environmental issues on leadership agendas more than governance or social topics. Smaller organizations focus more on governance. This distinction is influenced by company size and region, with climate issues more prevalent at large firms.
ESG focus, environmental issues, governance, company size, leadership agenda, survey, revenue, McKinsey
false
Market Analysis and Trends
Professional Services professional-services
Mixed Chart
McKinsey
View slide
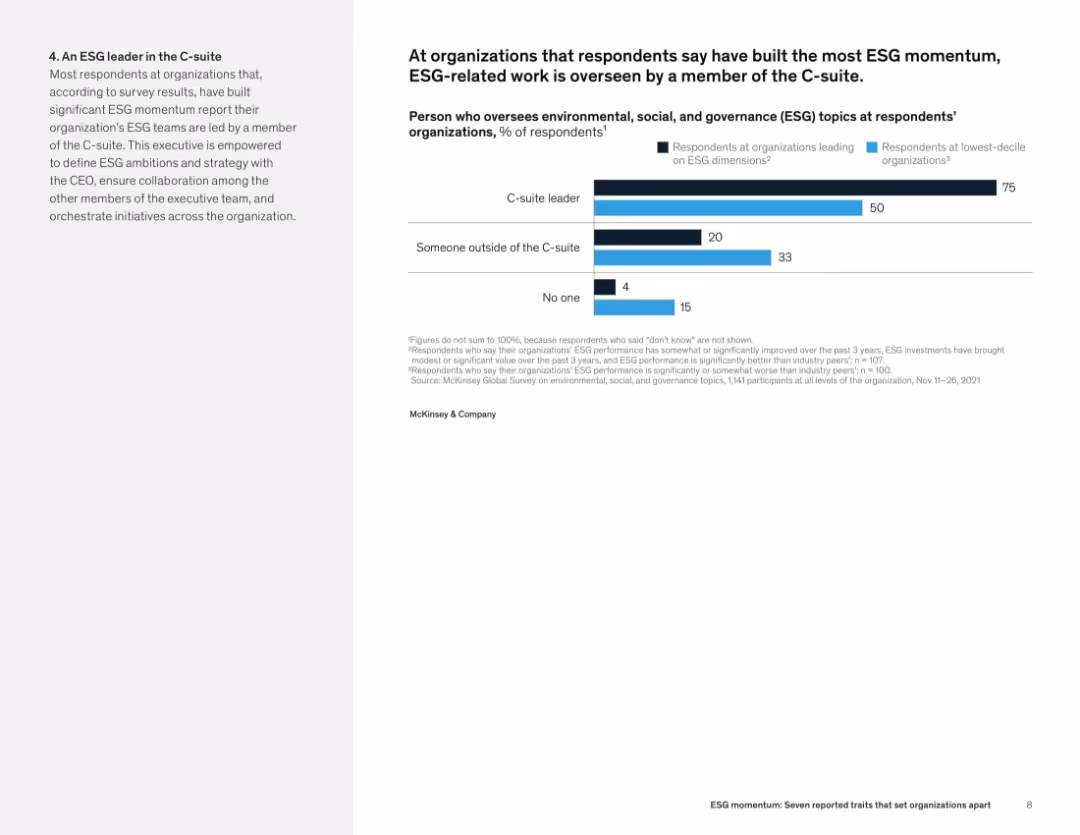
Left-aligned text alongside a horizontal bar chart showing who manages ESG at leading vs. lagging organizations.
Organizational Structure and Change
Professional Services
This slide indicates that C-suite leadership is a hallmark of high-performing ESG organizations. 75% of such firms have ESG led by C-level executives, compared to just 50% of bottom performers. The data suggests that senior oversight enhances ESG outcomes.
ESG governance, executive leadership, C-suite, organizational structure, ESG performance, oversight roles
false
Organizational Structure and Change
Professional Services professional-services
Mixed Chart
McKinsey
View slide
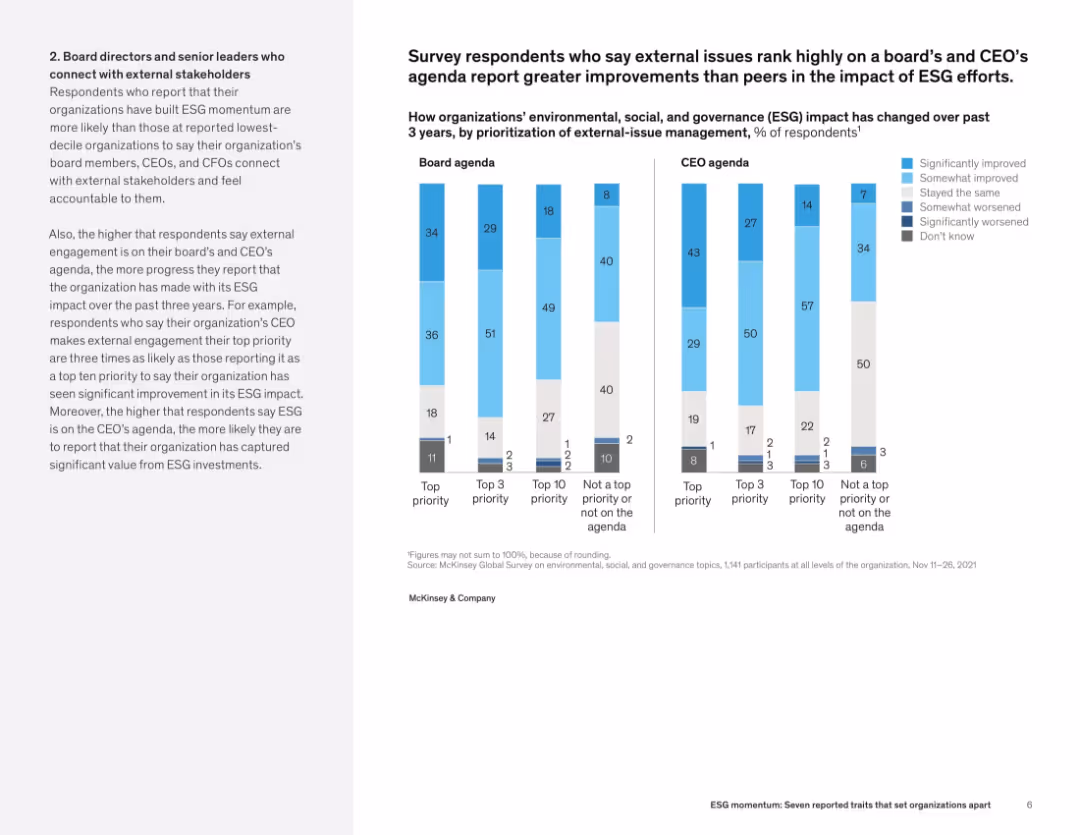
Left-aligned narrative with side-by-side vertical bar charts comparing ESG improvements based on board and CEO prioritization.
Human Resources and Talent Management
Professional Services
This slide links ESG success with the prioritization of external issues on leadership agendas. Organizations with high board and CEO ESG focus report significantly better ESG impact outcomes. Charts compare performance across four priority levels.
ESG impact, board leadership, CEO agenda, organizational outcomes, external engagement, ESG prioritization
false
Human Resources and Talent Management
Professional Services professional-services
Mixed Chart
McKinsey
View slide
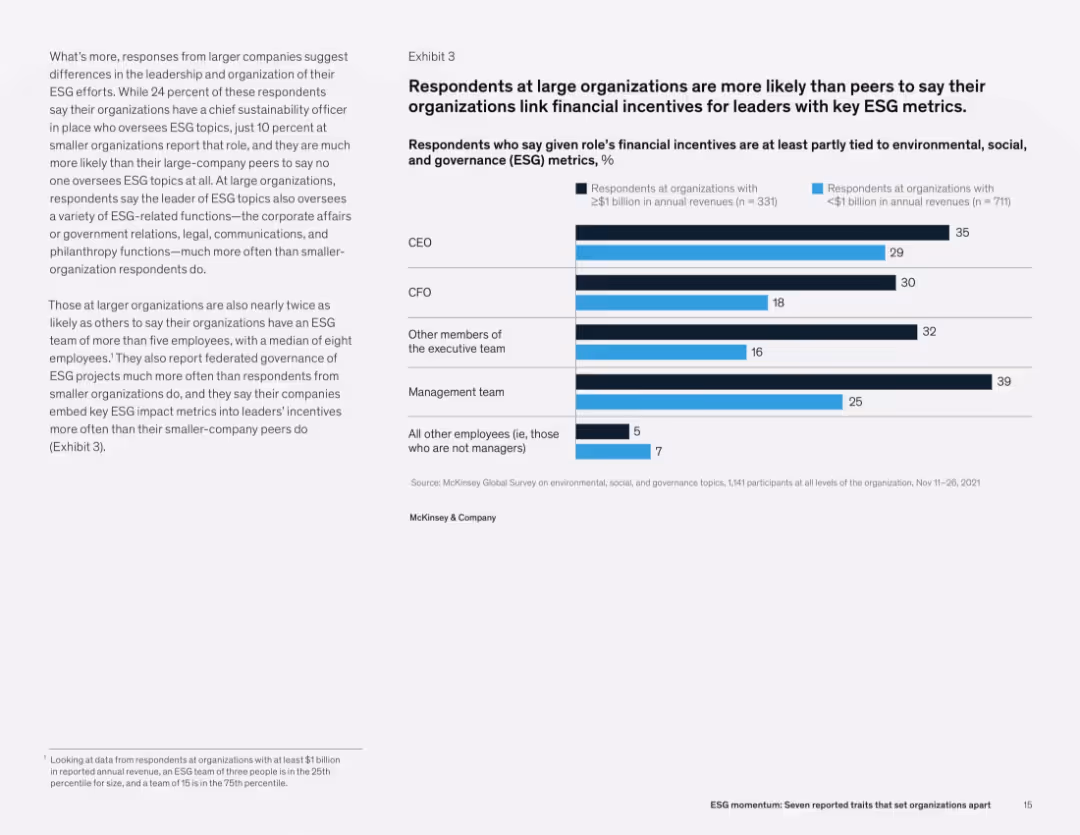
Split layout with explanatory text on left and bar chart on right comparing incentive ties by role across large vs. small organizations.
Human Resources and Talent Management
Professional Services
This slide highlights that large organizations are more likely to link ESG metrics to leadership financial incentives compared to smaller ones. This includes executives and management teams, reinforcing ESG's institutional importance in larger firms.
ESG incentives, leadership, company size, HR strategy, executive compensation, McKinsey, survey
false
Human Resources and Talent Management
Professional Services professional-services
Mixed Chart
McKinsey
View slide
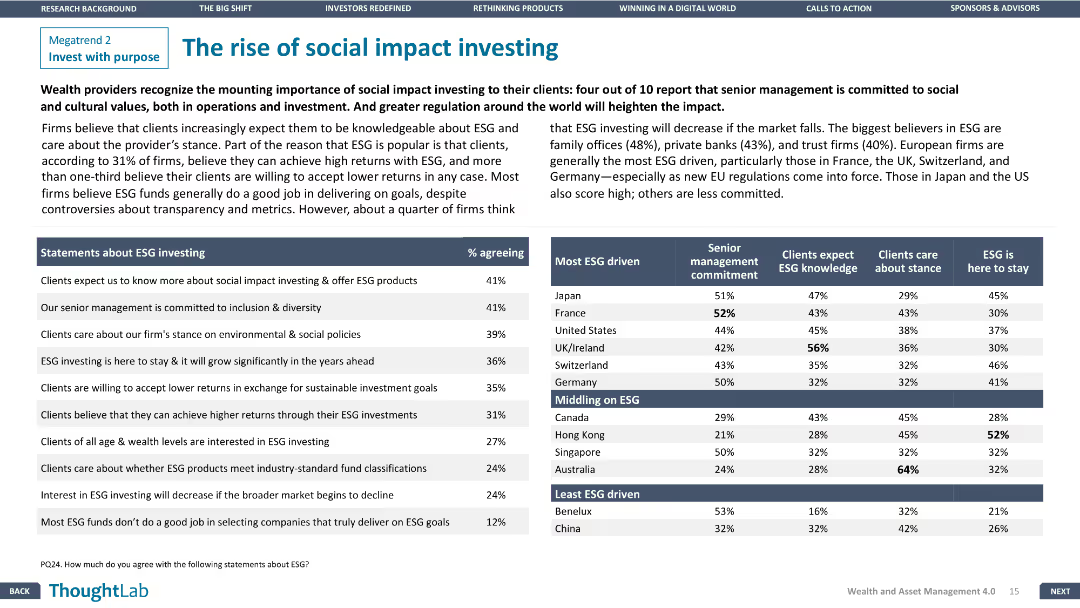
The slide features a column chart with statements about ESG investing and a table comparing regions on ESG criteria.
Investment Analysis
Financial Services
The slide examines the increasing importance of ESG investing, highlighting regional differences and investor expectations.
ESG investing, Social impact, Financial Services, Investment, Regional comparison
false
Investment Analysis
Financial Services financial-services
Table
Deloitte
View slide
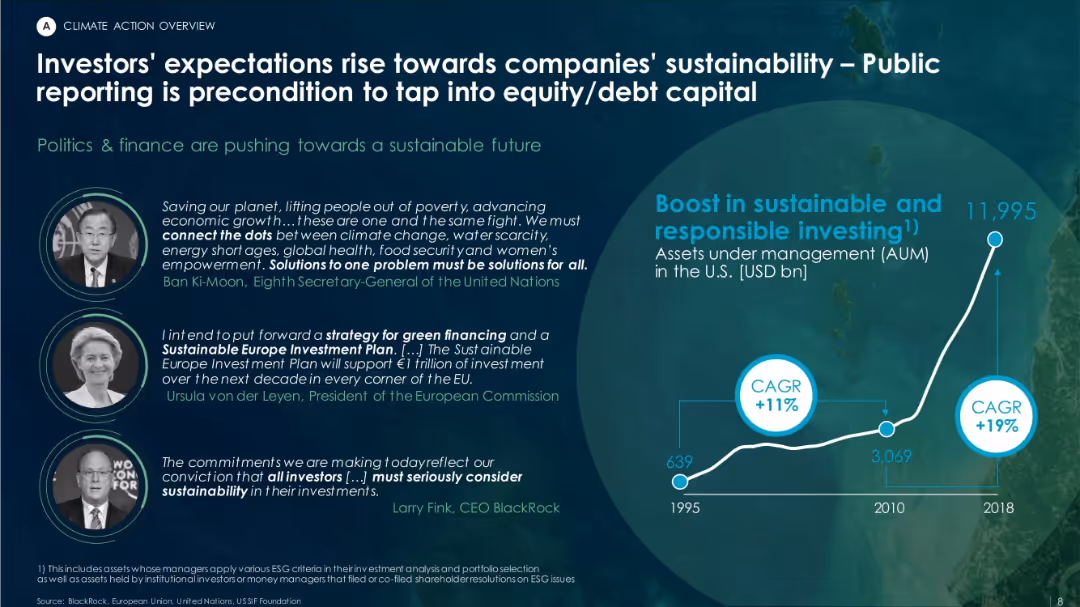
Two-column layout with political/financial quotes on the left and a sharp upward trend chart of sustainable AUM in the U.S. on the right.
Corporate Finance and Valuation
Environmental Services & Sustainability
Highlights increasing investor demand for sustainability transparency. Supported by quotes from global leaders, the chart shows U.S. AUM in sustainable investing rising from $639B in 1995 to nearly $12T in 2018.
ESG investing, public reporting, AUM, sustainable finance, investor pressure, green finance
false
Corporate Finance and Valuation
Environmental Services & Sustainability environmental-services-and-sustainability
Mixed Chart
Roland Berger
View slide
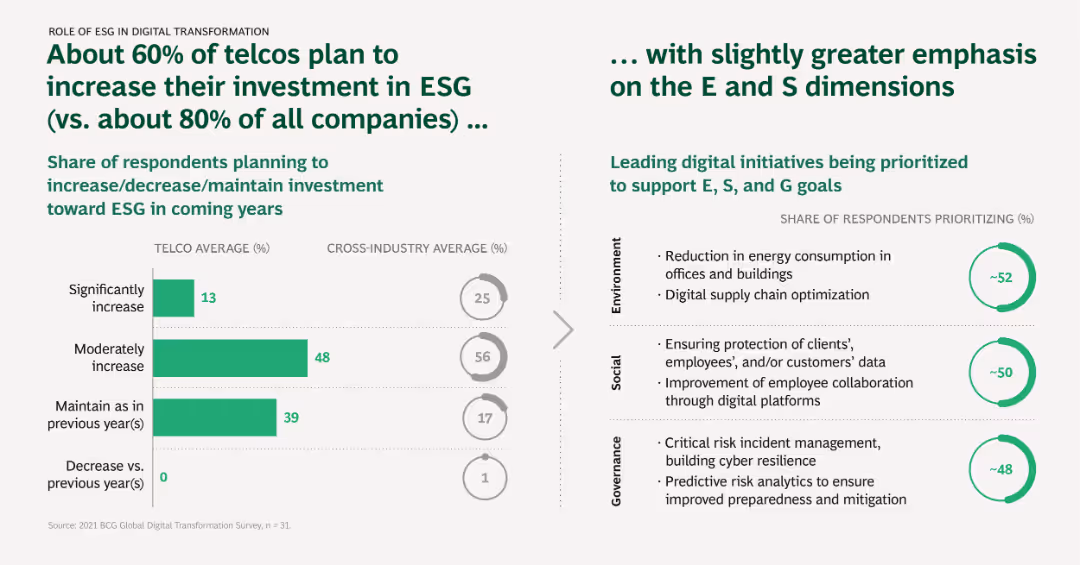
Horizontal bar chart showing telcos' planned investments in ESG (Environmental, Social, Governance) initiatives, comparing telco average to cross-industry average.
Regulatory and Compliance
Telecommunications
This slide illustrates the emphasis telcos place on ESG investments, highlighting environmental, social, and governance initiatives being prioritized to support ESG goals.
ESG investment, Environmental initiatives, Social initiatives, Governance, Digital transformation
false
Regulatory and Compliance
Telecommunications telecommunications
Multiple Chart
BCG
View slide
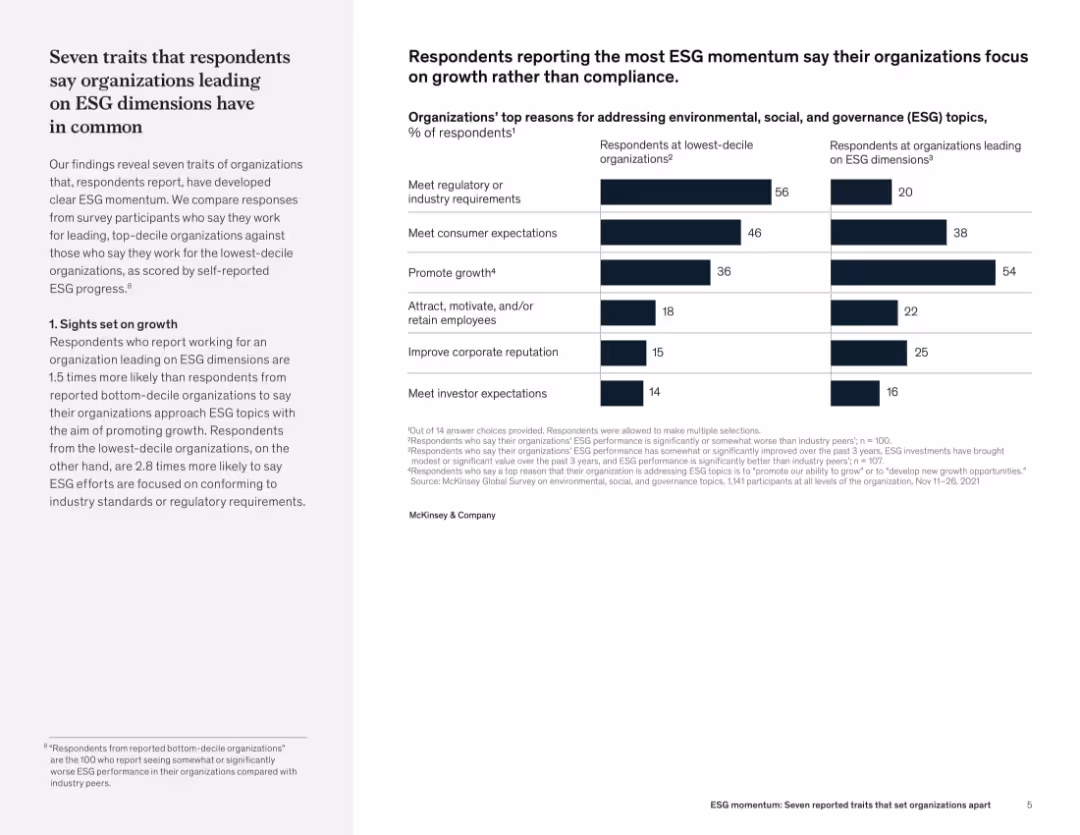
Two-column layout with narrative on the left and bar chart on the right comparing ESG motivations between top- and bottom-performing organizations.
Organizational Structure and Change
Professional Services
The slide reveals that organizations with strong ESG performance prioritize growth, unlike weaker performers who focus on compliance. A comparison chart illustrates differences in motivations—such as promoting growth, attracting talent, and improving reputation—between top and bottom ESG performers.
ESG leadership, strategic traits, growth vs. compliance, stakeholder engagement, sustainability traits, organizational performance
false
Organizational Structure and Change
Professional Services professional-services
Mixed Chart
McKinsey
Previous
Loading...
Hold On!
We are searching in our database
If nothing, comes up, please try different filters!
Column Chart
Heatmap
Chevron
Org Chart
Infographic
Callouts
Timeline
List
Graphic
Picture
Process Flow
Diagram
Paragraph
Map
Table
Framework
Subtitle
Takeaway Box
Icon
Other Chart
Radar Chart
Waterfall Chart
Mekko Chart
Pie Chart
Scatter Plot
Line Chart
Bar chart
Bullet points
Create a FREE account to continue browsing
Receive Instant Access to 1,000+ slides from companies like McKinsey, Google, and Goldman Sachs
First Name
Last Name
Email
Password
I agree to all
Terms & Privacy Policy
Thank you! Your submission has been received!
Oops! Something went wrong while submitting the form.
Have an account?
Sign in
Upgrade to PRO to Save slides
Advanced Search and Filters
Access to 15,000+ slides
Access to Category Pages
Save/Bookmark Slides
PowerPoint Template Library
Pick a Plan
MONTHLY
$12/month
Billed every month, Cancel anytime.
YEARLY
$9/year
Billed $108 annually, Cancel anytime.
Checkout for $12/month
Checkout for $108/yr
Secured by Stripe | AES-256 bit encryption