My Account
My Slides
Search by Category
Templates
View All Templates
Download Template Slides
Leave Feedback
Login
Logout
Get Started
Browse all Slides
Browse all Slides
Create a FREE Account
Instant access to 1,000+ real slides from top companies like McKinsey, BCG, Goldman Sachs, Google and many more!
First Name
Last Name
Email
Password
I agree to all
Terms & Privacy Policy
Thank you! Your submission has been received!
Oops! Something went wrong while submitting the form.
Have an account?
Sign in
Spark Your Next Big Idea with New Presentation Templates
VIEW ALL Templates
Welcome,
Welcome
PRO
Show Featured Only
Checkbox 8
Companies
Mckinsey
Bain
BCG
EY
Deloitte
Accenture
PwC/Strategy&
JP Morgan
Goldman Sachs
Morgan Stanley
Citigroup
Deutsche Bank
Barclays
LEK
KPMG
Kearney
Oliver Wyman
Booz Allen Hamilton
Gartner
IPSOS
Nielsen
Slide type
Text Only
Linear Flow
Vertical Flow
Single Chart
Header Horizontal
Mixed Chart
Header Vertical
Pillar
Multiple Chart
Graphic
Agenda
Title
Table
Framework
Industry
Technology & Software
Artificial Intelligence
Financial Services
Retail & E-commerce
Consumer Goods
Industrial & Manufacturing
Transportation & Logistics
Telecommunications
Real Estate & Construction
Hospitality & Tourism
Professional Services
Education & Training
Media & Entertainment
Agriculture & Food Production
Healthcare & Pharmaceuticals
Environmental Services & Sustainability
Government & Public Sector
Use Case
Mergers and Acquisitions
Performance Metrics and KPIs
Client Case Studies
Competitive Landscape
Corporate Finance and Valuation
Product and Service Analysis
Customer and Market Segmentation
Organizational Structure and Change
Industry Overview
Regulatory and Compliance
Risk Assessment and Management
Investment Analysis
Organizational Structure and Change
Human Resources and Talent Management
Financial Performance
Market Analysis and Trends
Sales and Business Development
Human Resources and Talent Management
Clear all
Thank you! Your submission has been received!
Oops! Something went wrong while submitting the form.
Tag
View slide
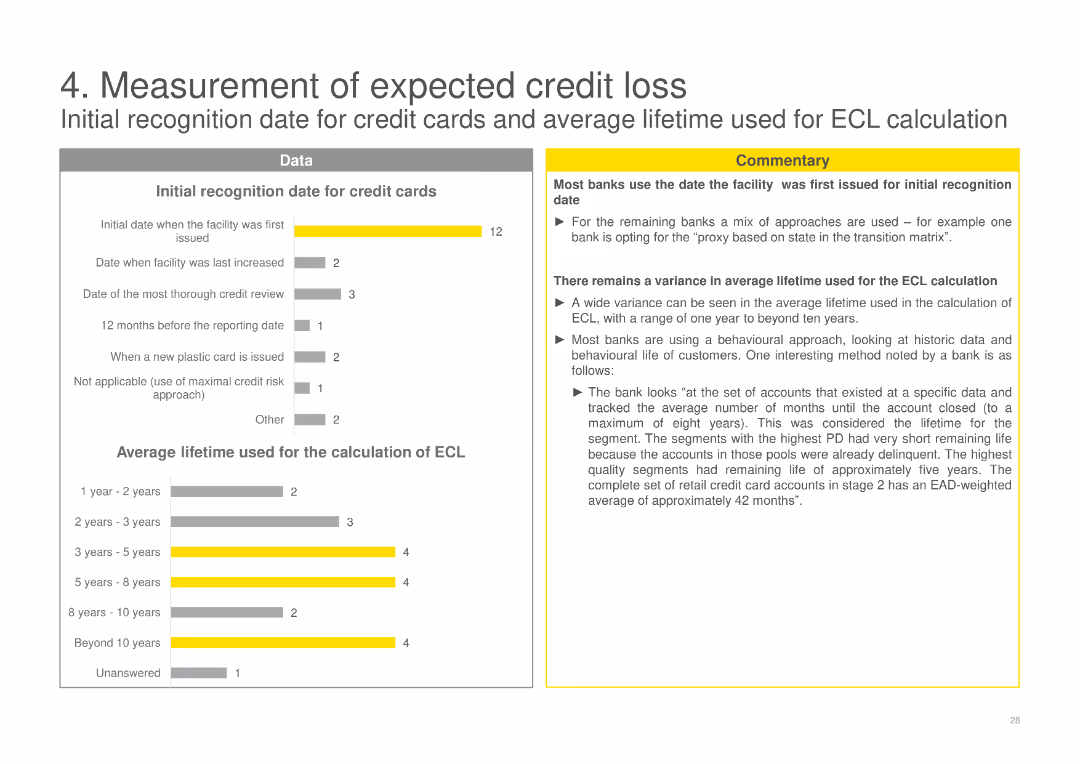
Column charts showing initial recognition dates for credit cards and average lifetime used for ECL calculation, with commentary explaining variance among banks.
Financial Performance
Financial Services
Analyzes the initial recognition dates for credit cards and the average lifetime used by banks for ECL calculation, showing variations in practice and methods used.
ECL, credit cards, measurement, banks, recognition, average lifetime, calculation, variance, methods
false
Financial Performance
Financial Services financial-services
Multiple Chart
EY
View slide
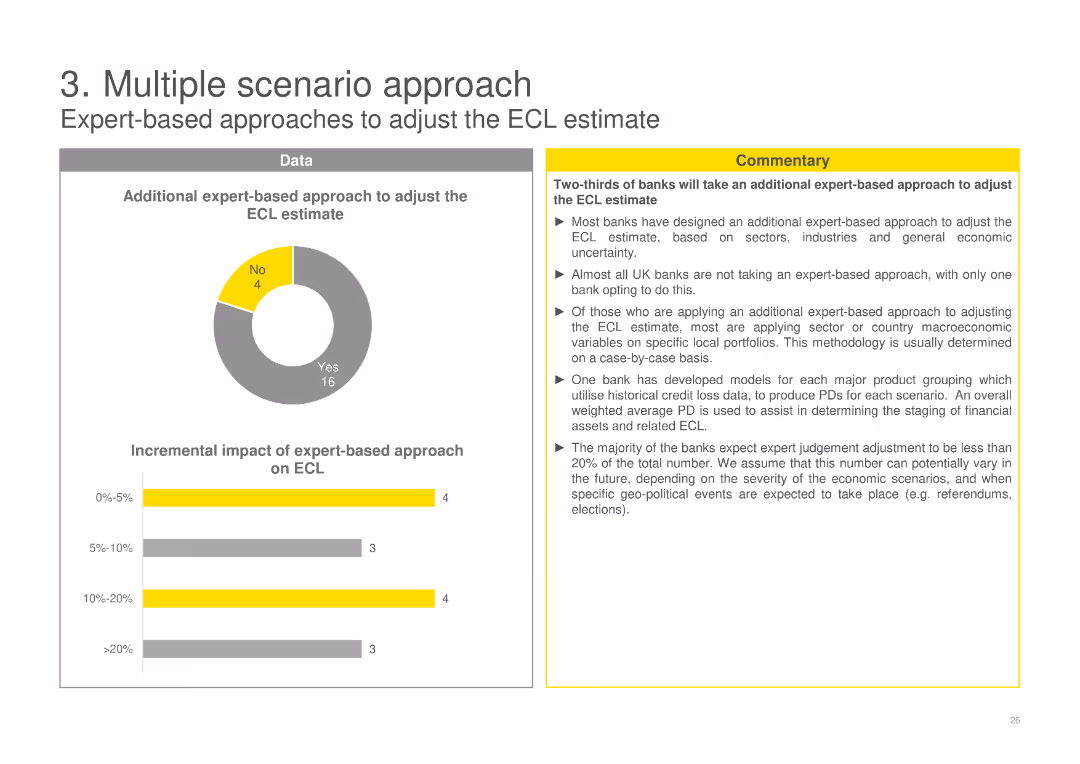
A pie chart depicting the use of expert-based approaches for adjusting ECL estimates and a column chart showing the impact on ECL.
Risk Assessment and Management
Financial Services
Focuses on the use of expert judgment in adjusting ECL estimates, highlighting how banks apply sector-specific and macroeconomic variables to these estimates.
ECL, expert-based, adjustment, banks, estimates, macroeconomic, sector-specific, judgement, impact
false
Risk Assessment and Management
Financial Services financial-services
Multiple Chart
EY
View slide
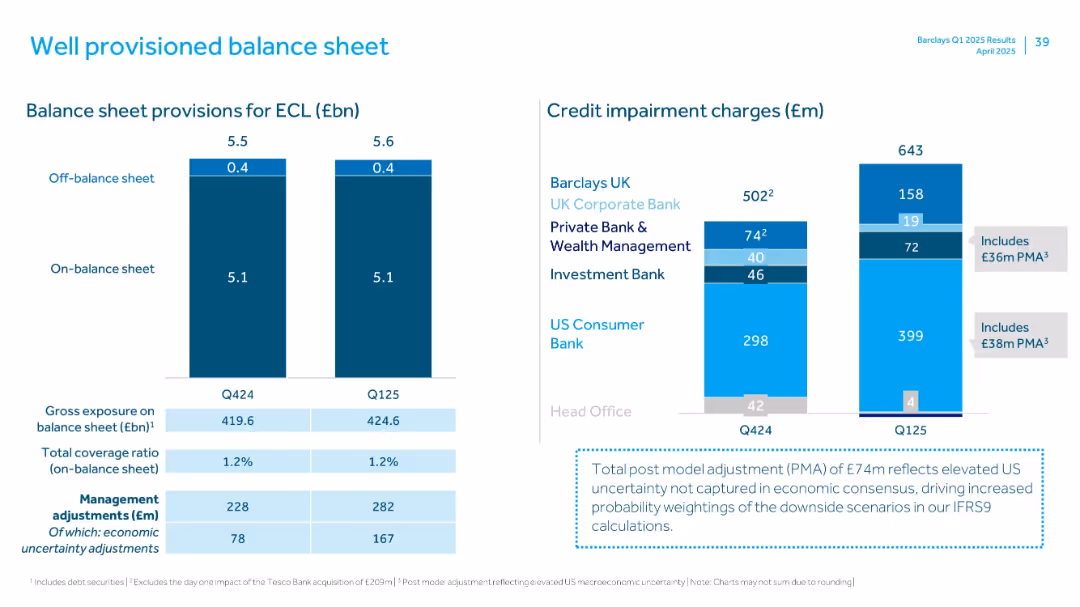
Dual panel with bar charts showing provisions for expected credit loss (ECL) and credit impairment by business
Risk Assessment and Management
Financial Services
Displays Barclays’ provisions for expected credit loss and credit impairments across business divisions, emphasizing stable coverage ratios and increased post model adjustments reflecting macroeconomic uncertainty.
ECL, impairments, balance sheet, PMA, credit risk
false
Risk Assessment and Management
Financial Services financial-services
Multiple Chart
Barclays
View slide
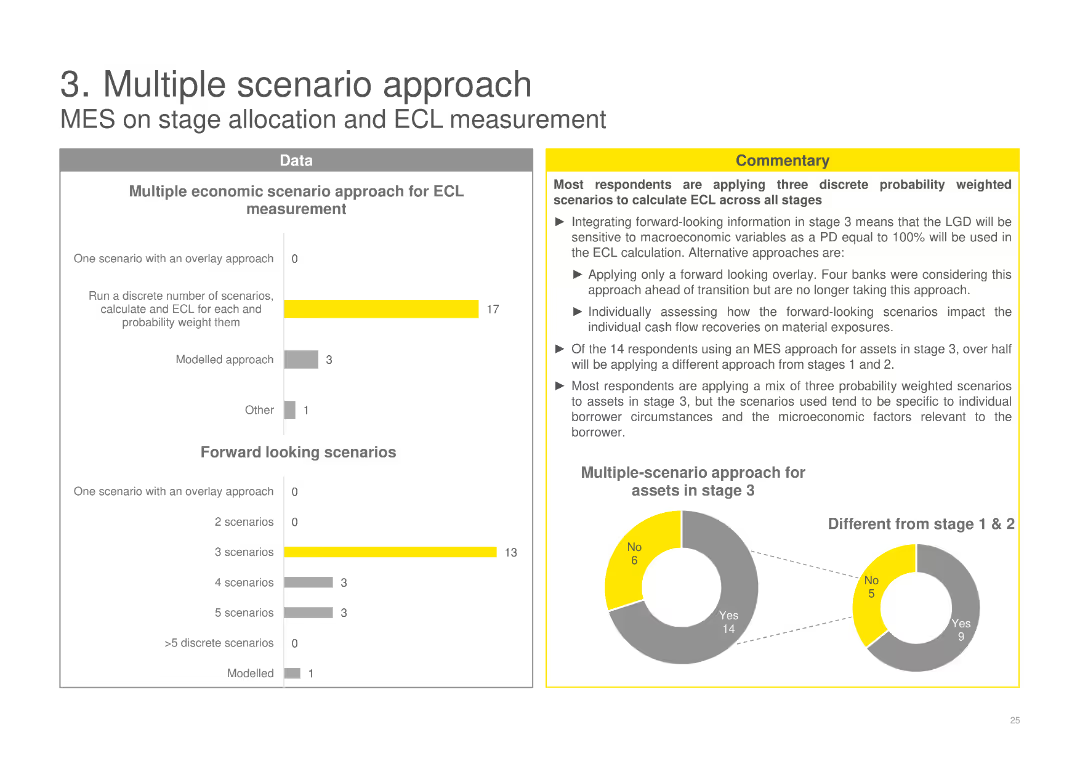
A column chart showing various approaches for ECL measurement, a pie chart showing multiple-scenario approach, and detailed commentary.
Risk Assessment and Management
Financial Services
Discusses the application of multiple economic scenarios for expected credit loss (ECL) measurement, highlighting various methods used by banks.
ECL, scenario, measurement, banks, methods, stage, forward looking, probability, weighted, assessment
false
Risk Assessment and Management
Financial Services financial-services
Multiple Chart
EY
View slide
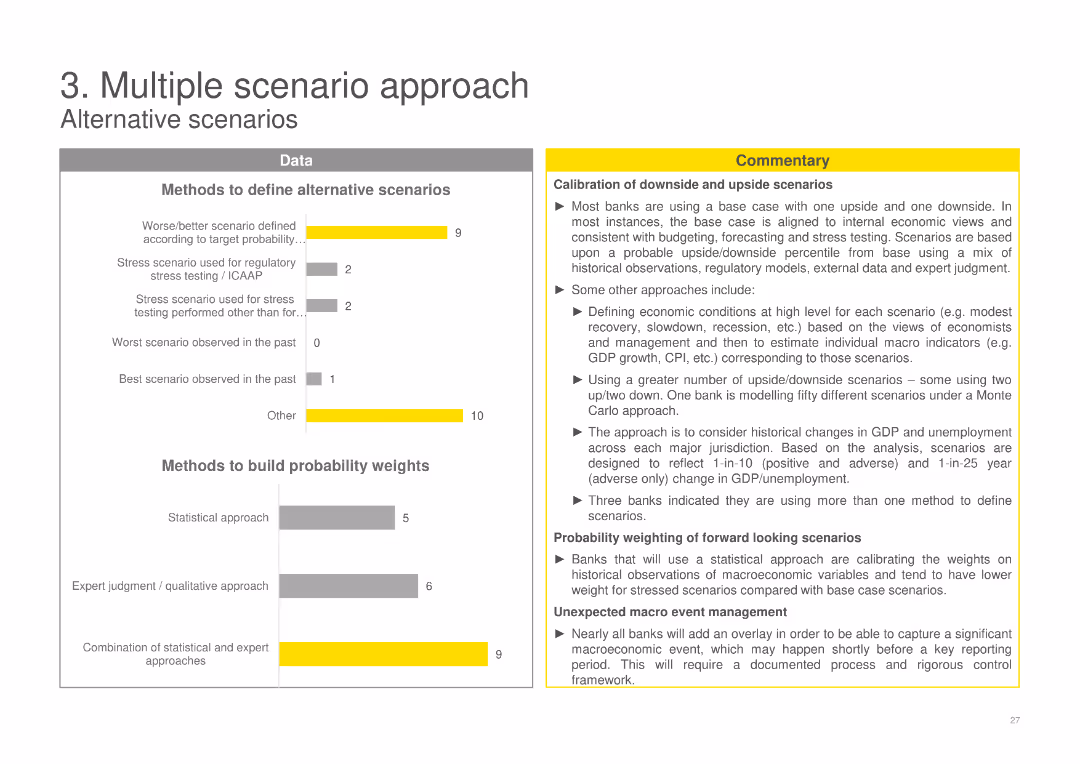
Column charts displaying methods to define alternative scenarios and build probability weights, alongside a detailed commentary section.
Risk Assessment and Management
Financial Services
Explores methods banks use to define alternative scenarios and build probability weights for ECL, including historical data and expert judgment approaches.
ECL, scenarios, probability, banks, methods, historical, expert judgment, weights, alternative, downside
false
Risk Assessment and Management
Financial Services financial-services
Multiple Chart
EY
View slide
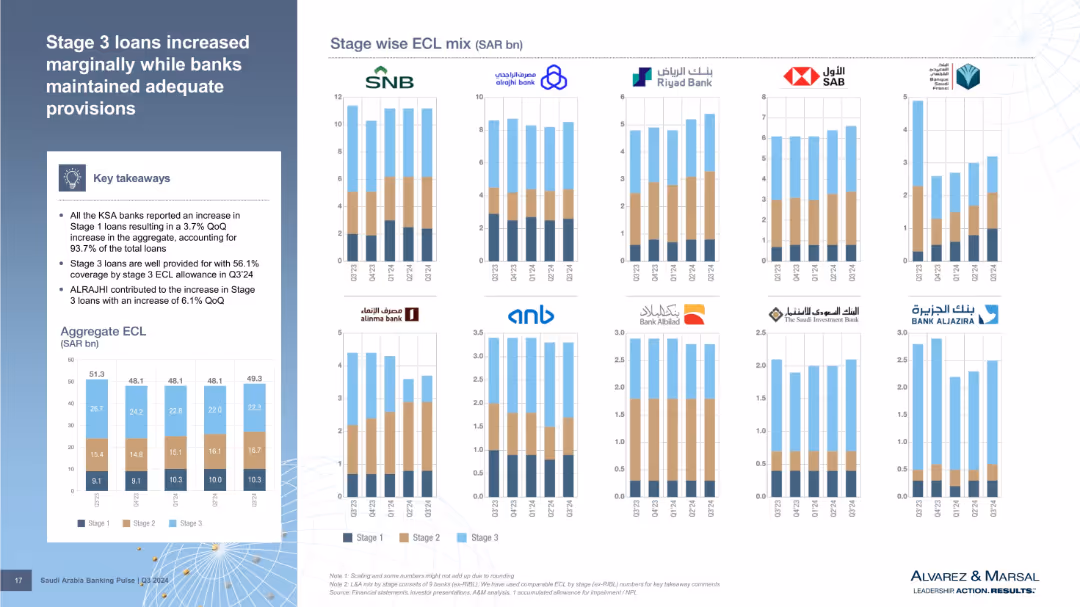
Bar charts per bank showing stage-wise ECL mix, plus an aggregate ECL bar chart. The slide uses three distinct colors to show Stage 1–3 loans. Summary box on the left includes main insights.
Risk Assessment and Management
Financial Services
Analyzes Expected Credit Loss (ECL) distribution by loan stage. Stage 1 loans grew across all banks while Stage 3 loans are well provisioned. ALRAJHI contributed significantly to Stage 3 loan increases. The visual format highlights bank-wise and stage-wise credit quality metrics.
ECL, stage 3 loans, provisions, credit quality, ALRAJHI, loan stages
false
Risk Assessment and Management
Financial Services financial-services
Multiple Chart
Alvarez & Marsal
View slide
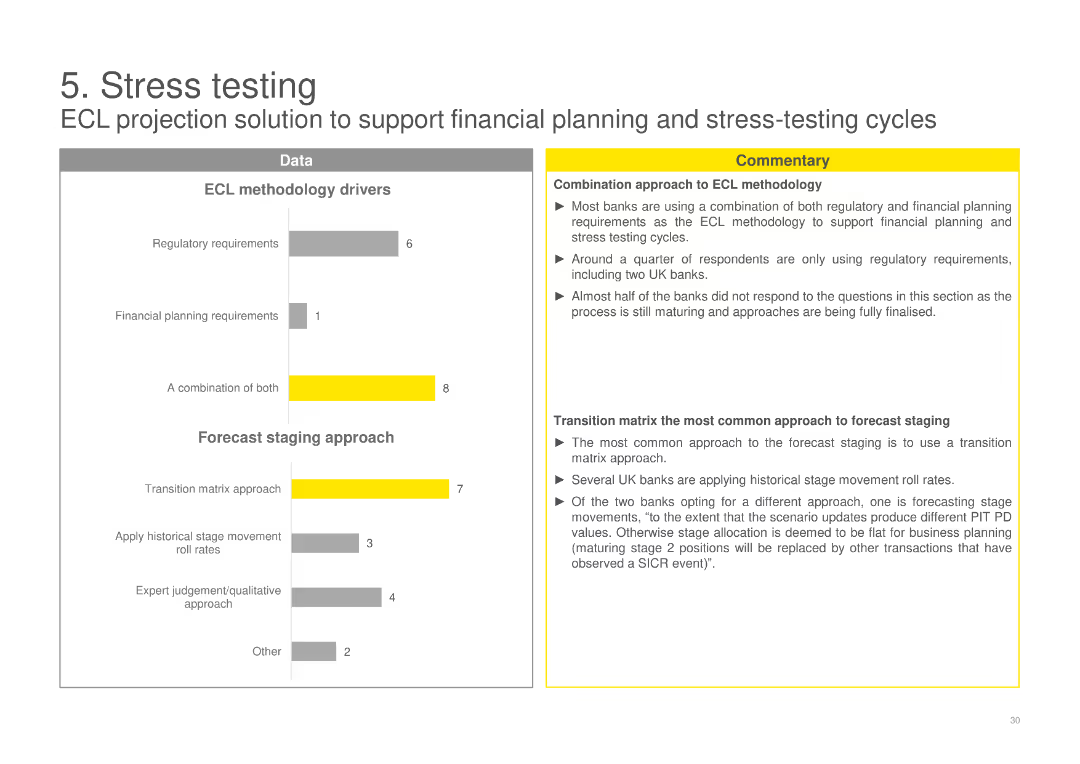
Column charts showing ECL methodology drivers and forecast staging approach, with commentary on combination approaches and the use of transition matrices.
Risk Assessment and Management
Financial Services
Outlines the drivers behind ECL methodologies and forecast staging approaches used by banks, emphasizing a combination of regulatory and financial planning needs.
ECL, stress testing, methodology, banks, drivers, forecast, staging, approach, transition matrix, combination
false
Risk Assessment and Management
Financial Services financial-services
Multiple Chart
EY
View slide
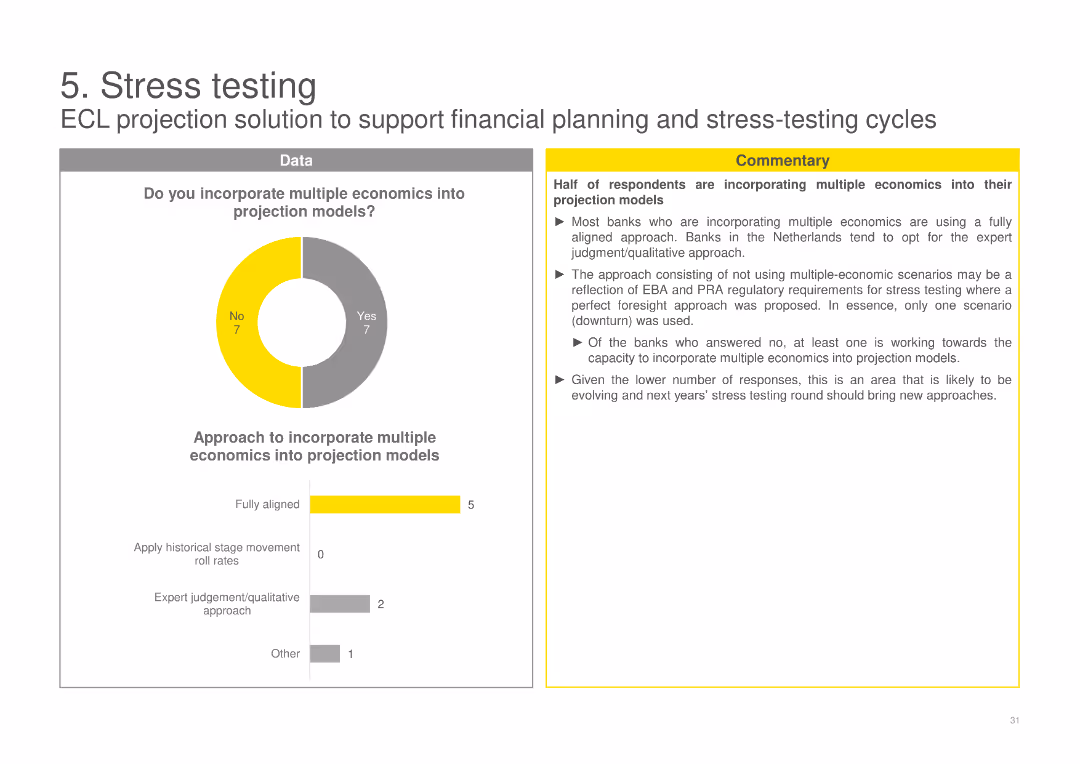
A pie chart on the incorporation of multiple economics into projection models, with a column chart detailing the approaches used by banks, and accompanying commentary.
Risk Assessment and Management
Financial Services
Examines whether banks incorporate multiple economic scenarios into their projection models for stress testing, detailing the different approaches taken.
ECL, stress testing, projection models, multiple economics, banks, scenarios, incorporation, approaches, testing
false
Risk Assessment and Management
Financial Services financial-services
Multiple Chart
EY
View slide
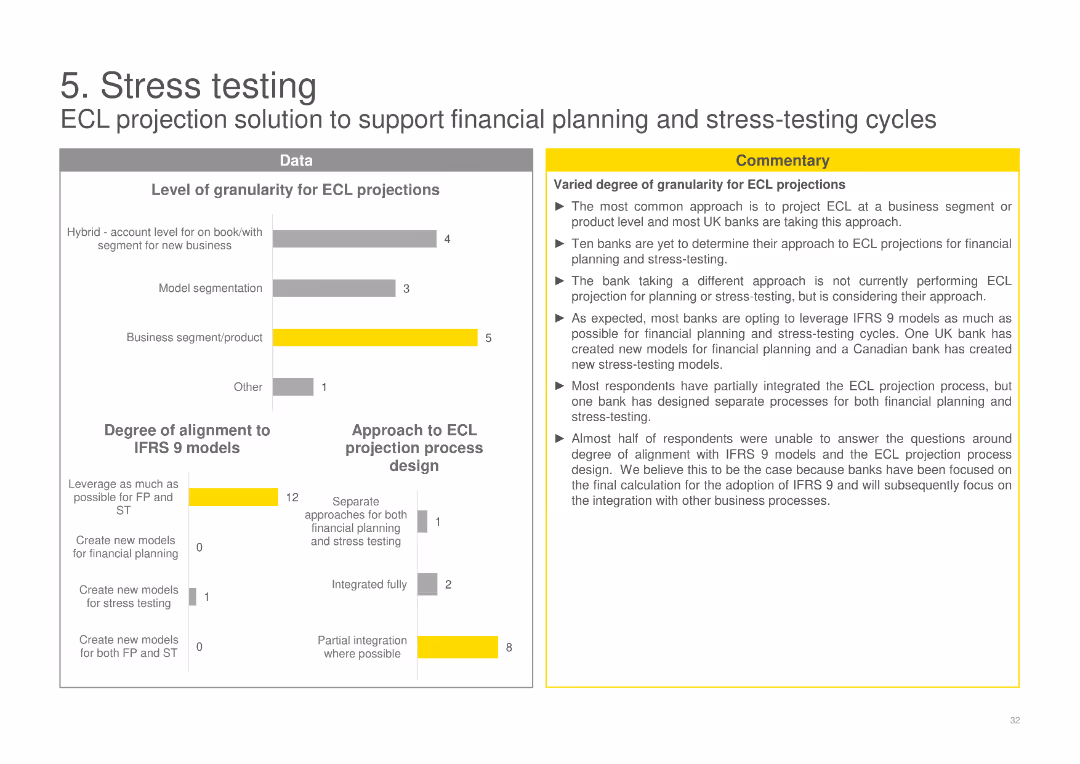
Column charts showing the level of granularity for ECL projections and the degree of alignment to IFRS 9 models, with commentary on varied approaches.
Risk Assessment and Management
Financial Services
Reviews the level of granularity banks use for ECL projections and their alignment to IFRS 9 models, noting different strategies and the extent of integration.
ECL, stress testing, projections, banks, granularity, IFRS 9, alignment, models, strategies, integration
false
Risk Assessment and Management
Financial Services financial-services
Multiple Chart
EY
View slide
Includes column charts comparing Barclays' service distribution with major US banks and showcasing investment in high-growth sectors.
Strategic Planning
Financial Services
Strategically planning to rebalance service offerings towards Equity Capital Markets (ECM) and Advisory services, targeting high-growth areas like technology.
ECM, advisory, strategic planning, investment, high-growth
false
Strategic Planning
Financial Services financial-services
Multiple Chart
Barclays
View slide
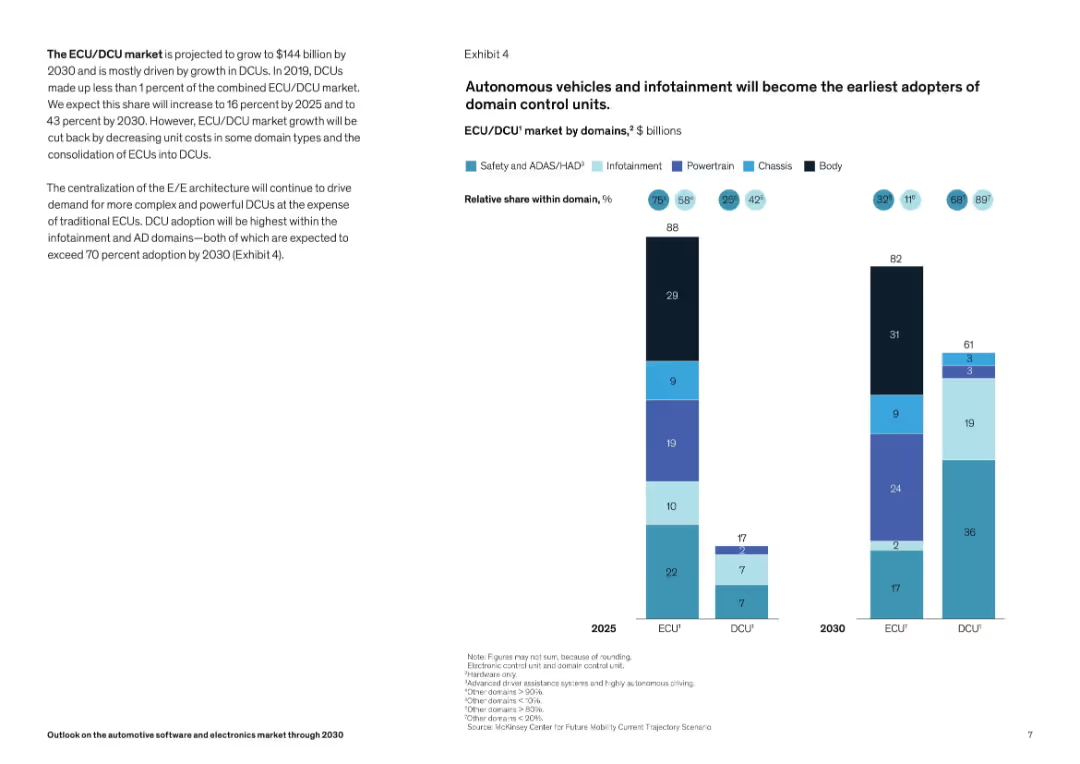
Two-column layout; left side has textual insights, right side features a stacked bar chart comparing ECU and DCU market values and domain shares for 2025 and 2030. Color-coded bars indicate different vehicle domains.
Market Analysis and Trends
Industrial & Manufacturing
This slide highlights the growth of the ECU/DCU market to $144B by 2030, driven by DCU adoption, especially in autonomous driving (AD) and infotainment. A bar chart shows domain-wise distribution and projected adoption trends for 2025 and 2030. Centralized E/E architecture is emphasized as a growth driver for DCUs.
ECU, DCU, ADAS, infotainment, autonomous driving, domain architecture, market growth, vehicle electronics, 2030 forecast, automotive
false
Market Analysis and Trends
Industrial & Manufacturing industrial-and-manufacturing
Mixed Chart
McKinsey
View slide
The slide features a colorful diagram illustrating the EFX Cloud architecture, highlighting various technological aspects such as data integration, real-time analytics, and built-in security features.
Technology and Digital Transformation
Technology & Software
This slide introduces the next phase in Equifax's cloud technology, detailing the enhanced capabilities and benefits of the EFX Cloud in improving service delivery and data management across its operations.
EFX Cloud, technology, data management, security
false
Technology and Digital Transformation
Technology & Software technology-and-software
Diagram
Barclays
View slide
With a split layout, the left side presents metrics and definitions under the title 'ENVIRONMENTAL HEALTH & SAFETY METRICS', while the right side emphasizes 'INCLUSIVE FACILITY DESIGN'. The color scheme is white, teal, and black with a minimalist design. There's a photo depicting a modern, accessible workspace, reinforcing the slide's focus on safety and inclusion. The bottom right displays the page number '25'.
Regulatory and Compliance
Professional Services
The slide conveys the company’s dedication to safety through its Environmental Health & Safety (EHS) program. It presents past safety metrics, underlining a commitment to safe work conditions, particularly in response to changes brought on by the pandemic. Additionally, it details the efforts towards creating inclusive and ergonomic workspaces that reflect a hybrid work model and the diverse workforce needs.
EHS, safety, inclusion, pandemic, workspace design, metrics
false
Regulatory and Compliance
Professional Services professional-services
Table
Booz Allen Hamilton
View slide
Two line charts showing EM bond index spread ranks and the relationship between EMBI spread and EM manufacturing PMI, highlighting potential for spread compression.
Investment Analysis
Financial Services
The slide suggests an overweight position on EM hard currency debt due to lower funding costs, favorable rates, and potential for spread compression, especially in distressed credits.
EM Debt, Spread Compression, Funding Costs, Manufacturing PMI, Investment, Financial Analysis
false
Investment Analysis
Financial Services financial-services
Multiple Chart
Morgan Stanley
View slide
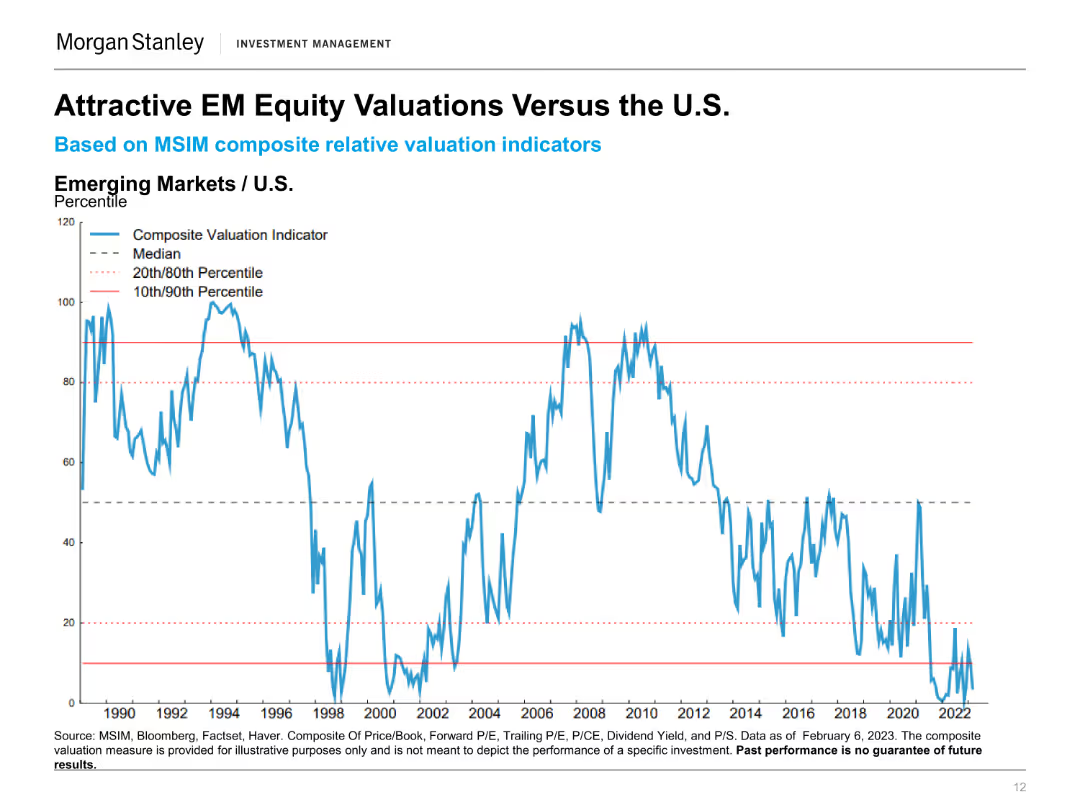
This slide displays a line chart comparing the EM Equity Valuations to the U.S. using a Composite Valuation Indicator from 1990 to 2022, showing percentiles for reference.
Investment Analysis
Financial Services
The slide evaluates the attractiveness of emerging market equities compared to U.S. equities by analyzing valuation indicators over several decades.
EM Equity, U.S. Equity, Valuation Comparison, Investment Analysis, Composite Indicator, Market Trends, Financial Valuation, Equity Analysis
false
Investment Analysis
Financial Services financial-services
Single Chart
Morgan Stanley
View slide
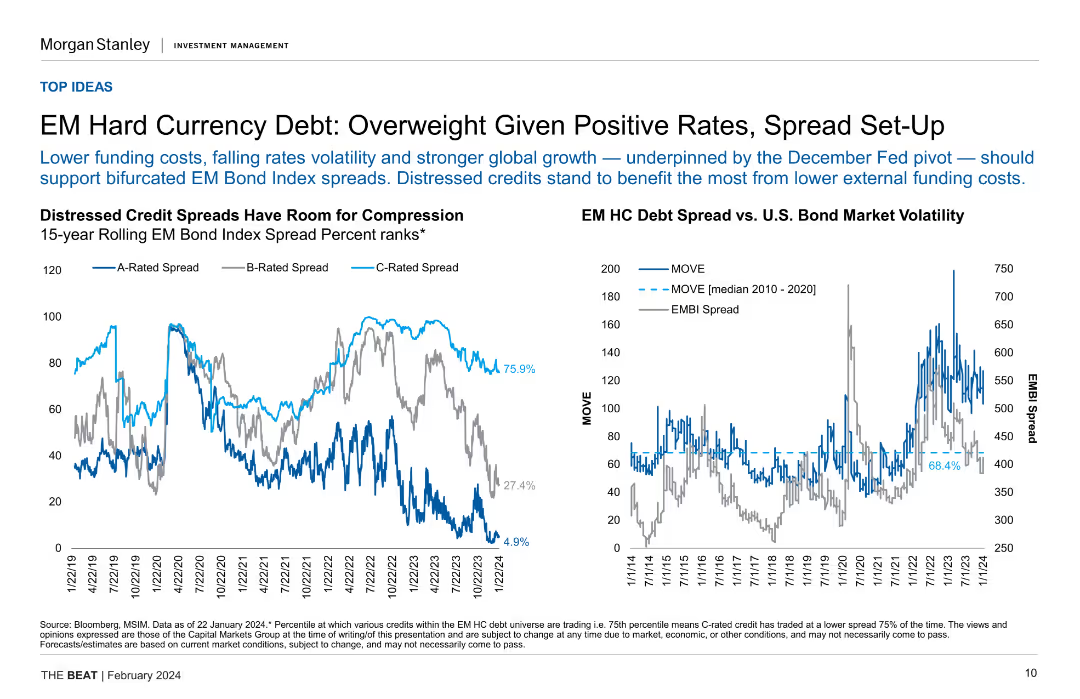
Two line charts displaying distressed credit spreads and EM hard currency debt spread vs. U.S. bond market volatility.
Investment Analysis
Financial Services
The slide supports an overweight recommendation for EM hard currency debt, citing positive rates, spread setup, and falling rate volatility.
EM debt, hard currency, distressed credit spreads, investment analysis, bond market volatility
false
Investment Analysis
Financial Services financial-services
Multiple Chart
Morgan Stanley
View slide
This slide features two comparative line charts. The left chart compares EM and DM Real Yields using inflation forecasts, and the right chart shows the EM-DM Real Yield Differential.
Market Analysis and Trends
Financial Services
It highlights the real yield differences using inflation expectations and the narrowing yield differentials over the past year. Useful for comparing emerging and developed markets.
EM, DM, real yields, inflation, comparison
false
Market Analysis and Trends
Financial Services financial-services
Multiple Chart
Morgan Stanley
View slide
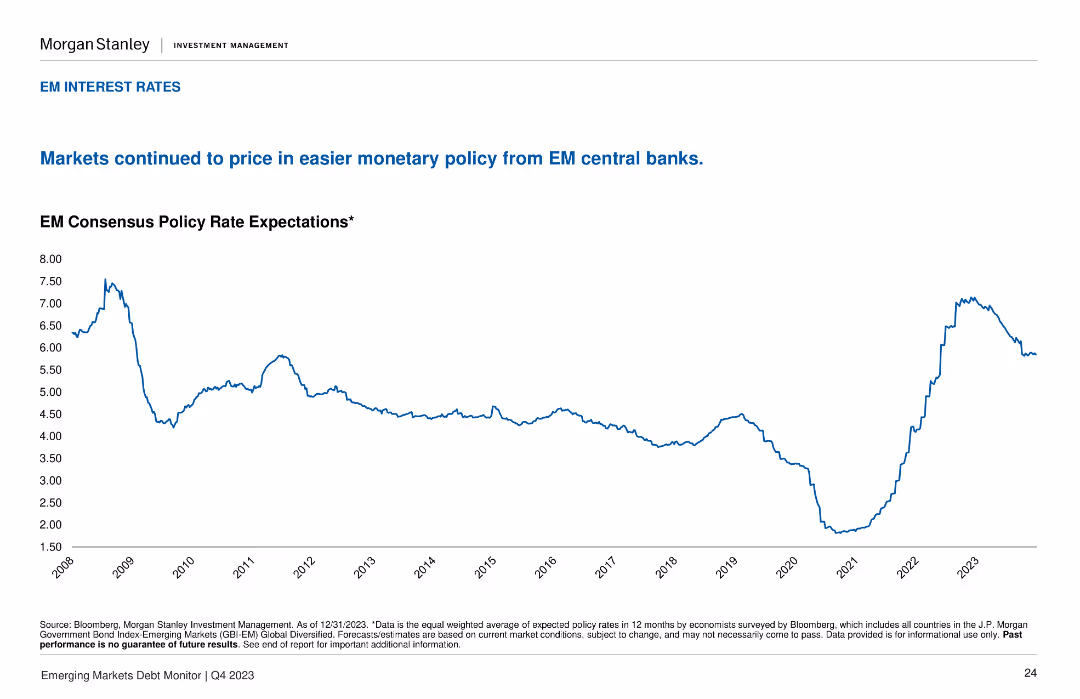
This slide contains a line chart depicting the EM Consensus Policy Rate Expectations from 2008 to 2023. The layout is simple, with a white background and blue line for the data points.
Market Analysis and Trends
Financial Services
The slide shows the expected policy rates from EM central banks, indicating trends and expectations in monetary policy over the years. Useful for analyzing economic policy trends.
EM, interest rates, policy, central banks, trend analysis
false
Market Analysis and Trends
Financial Services financial-services
Single Chart
Morgan Stanley
View slide
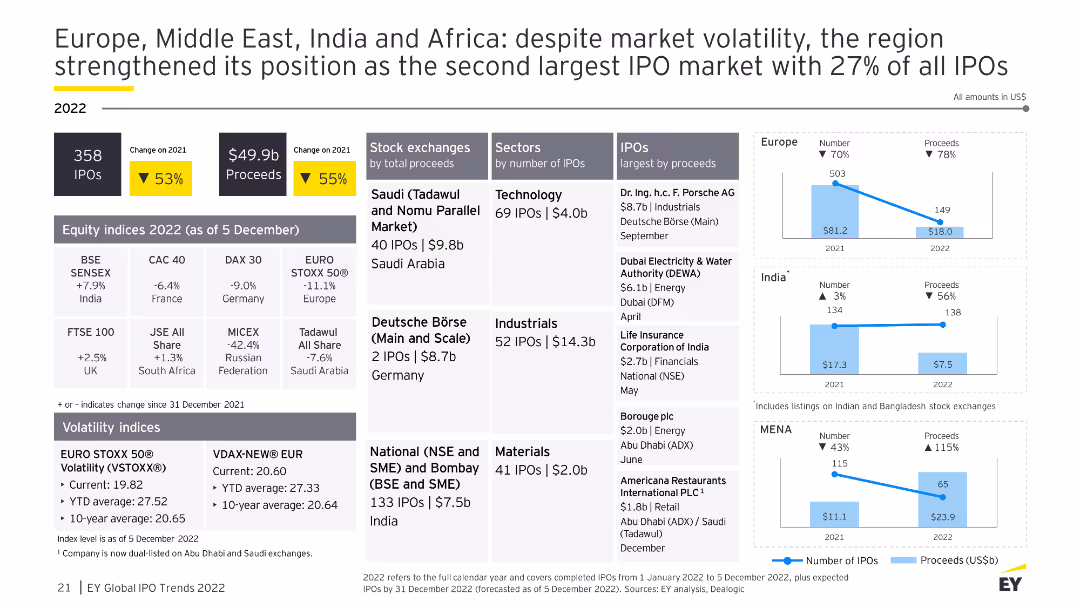
The slide uses data tables, column charts, and maps to present the EMEA IPO market overview, including equity indices, stock exchange performance, and major IPOs by country and sector.
Market Analysis and Trends
Financial Services
The slide gives an overview of the IPO market in Europe, Middle East, India, and Africa (EMEA) for 2022, detailing stock exchange performance, sector data, and significant IPOs, highlighting the region's strength despite market volatility.
EMEA, IPO, stock exchange, sector, 2022
false
Market Analysis and Trends
Financial Services financial-services
Multiple Chart
EY
View slide
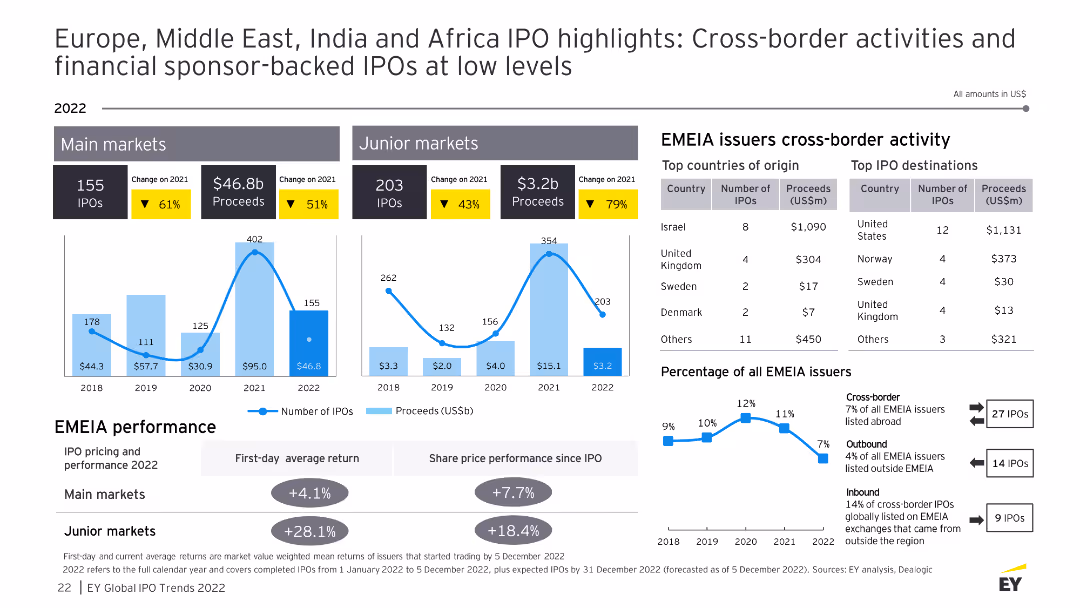
The slide features data visualizations and tables showing cross-border IPO activities in the EMEA region, including top countries of origin, top IPO destinations, and performance metrics.
Market Analysis and Trends
Financial Services
This slide details cross-border IPO activities in the EMEA region for 2022, providing insights into the top countries of origin and destinations for IPOs, as well as performance comparisons and percentage of total issuers.
EMEA, cross-border IPO, top countries, destinations
false
Market Analysis and Trends
Financial Services financial-services
Multiple Chart
EY
View slide
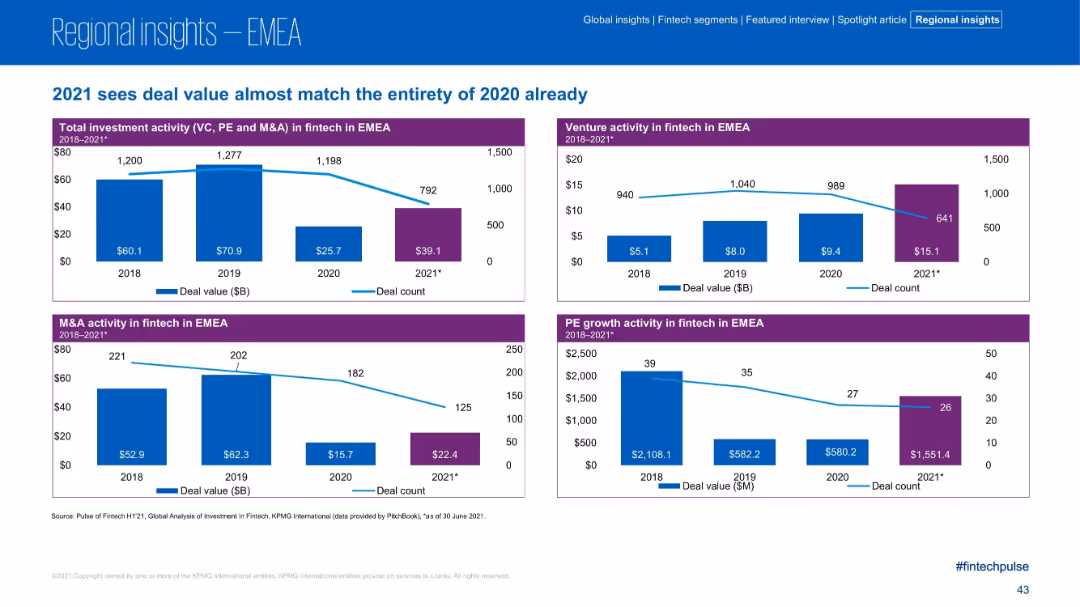
Four quadrant charts covering Total, Venture, M&A, and PE activity in EMEA; blue and purple elements with declining trend lines
Financial Performance
Financial Services
EMEA fintech deal value in H1 2021 nearly matches all of 2020. Charts show moderate decreases in deal count but increasing deal value across all investment types, especially in venture capital. The region shows robust activity despite fewer deals, suggesting larger individual transactions.
EMEA, fintech investment, PE, VC, M&A, deal value, 2021 trends, H1 comparison
false
Financial Performance
Financial Services financial-services
Multiple Chart
KPMG
View slide
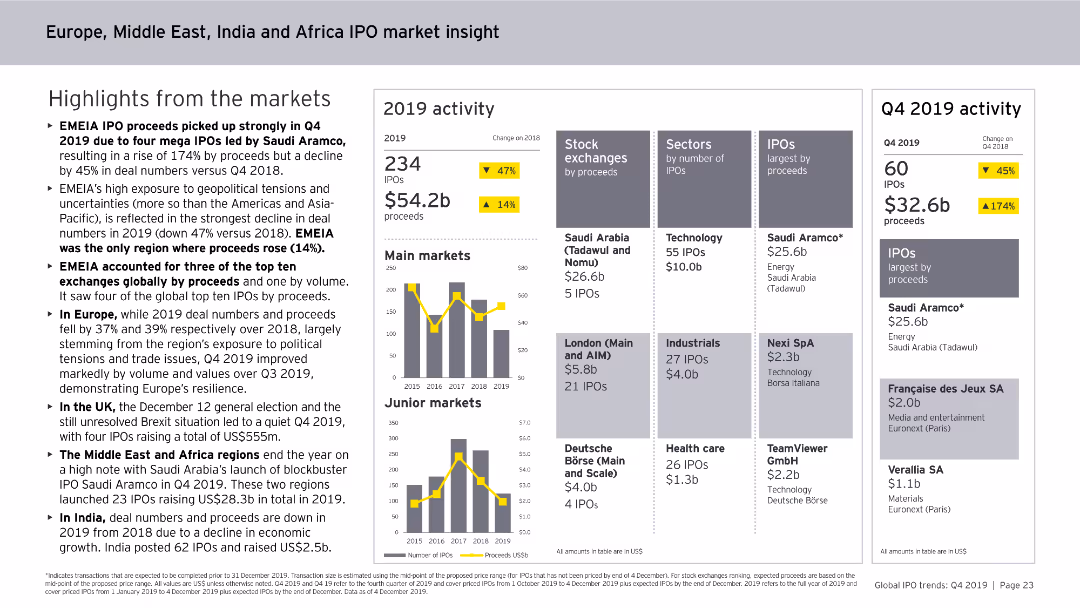
The slide uses column charts and tables to present the number of IPOs and proceeds in Europe, the Middle East, India, and Africa. It also includes details on stock exchanges and sectors.
Market Analysis and Trends
Financial Services
The slide discusses the robust IPO market performance in EMEIA, despite uncertainties. It showcases data on the number of IPOs, proceeds, and details of key stock exchanges and sectors.
EMEIA IPOs, market performance, financial trends, stock exchanges, sector analysis
false
Market Analysis and Trends
Financial Services financial-services
Multiple Chart
EY
View slide
The slide features column charts and tables comparing IPO performance in main and junior markets within EMEIA. It includes performance metrics and cross-border activity data.
Market Analysis and Trends
Financial Services
This slide highlights the positive IPO performance in EMEIA's main and junior markets, providing detailed data on number of IPOs, proceeds, and cross-border IPO activity.
EMEIA IPOs, market performance, main markets, junior markets, cross-border activity
false
Market Analysis and Trends
Financial Services financial-services
Multiple Chart
EY
View slide
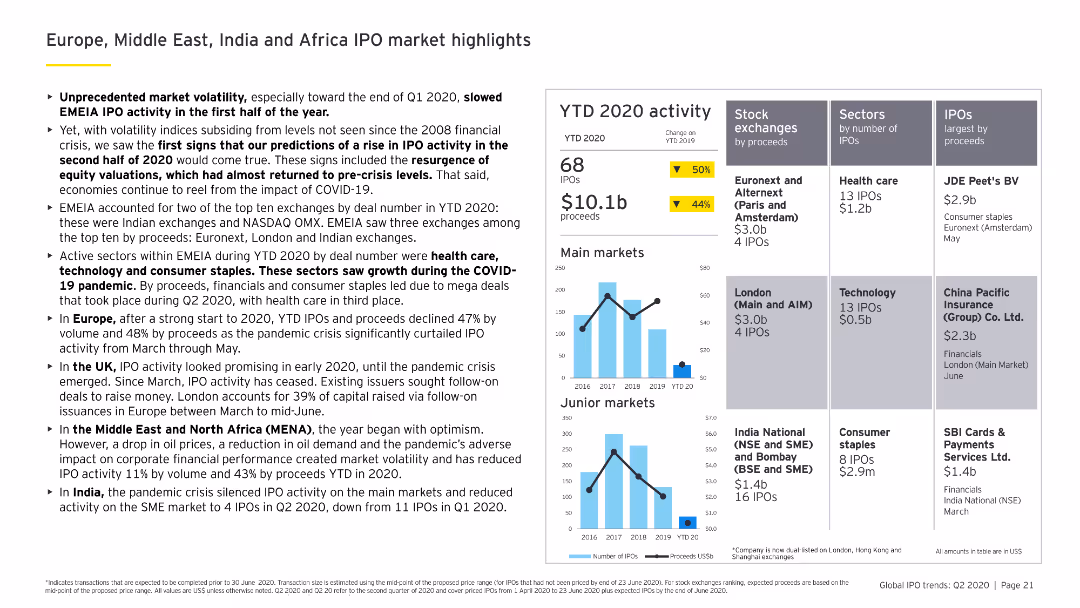
Features column charts showing YTD 2020 IPO activity across EMEIA, with detailed analysis of stock exchanges, sectors, and notable IPOs by proceeds.
Market Analysis and Trends
Financial Services
Analyzes the EMEIA IPO market's performance in 2020, with insights into the impact of COVID-19 and detailed breakdowns by stock exchanges, sectors, and major IPOs.
EMEIA, IPO market, stock exchanges, sectors, YTD 2020
false
Market Analysis and Trends
Financial Services financial-services
Multiple Chart
EY
View slide
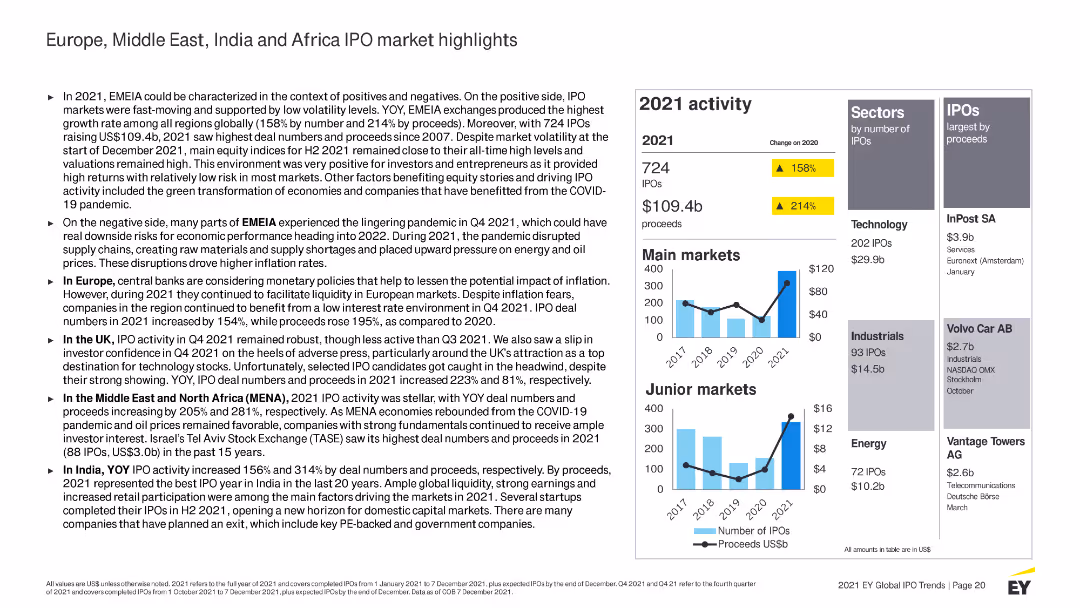
Contains multiple column charts, tables, and text boxes with highlighted statistics. Uses blue and yellow color schemes to distinguish regions and data changes.
Market Analysis and Trends
Financial Services
Summarizes IPO performance in the EMEIA regions for 2021, detailing trends, major market activities, and specific sector performances across different countries.
EMEIA, IPO, 2021 activity, market highlights, stock exchanges, sectors, proceeds, main markets, junior markets, outlook
false
Market Analysis and Trends
Financial Services financial-services
Multiple Chart
EY
View slide
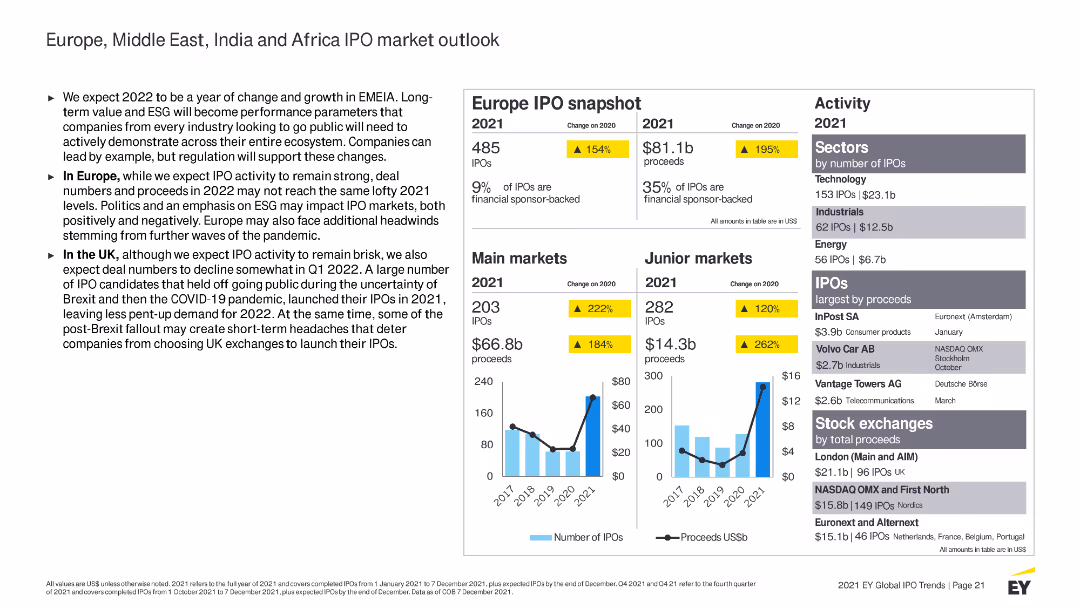
Features column charts, tables, and detailed bullet points with color coding to highlight key statistics and changes from the previous year.
Market Analysis and Trends
Financial Services
Provides an outlook for IPO activities in the EMEIA regions for 2022, discussing potential trends, sector growth, and market conditions impacting IPOs.
EMEIA, IPO, 2022 outlook, market analysis, trends, sectors, performance, stock exchanges, proceeds, growth
false
Market Analysis and Trends
Financial Services financial-services
Multiple Chart
EY
View slide
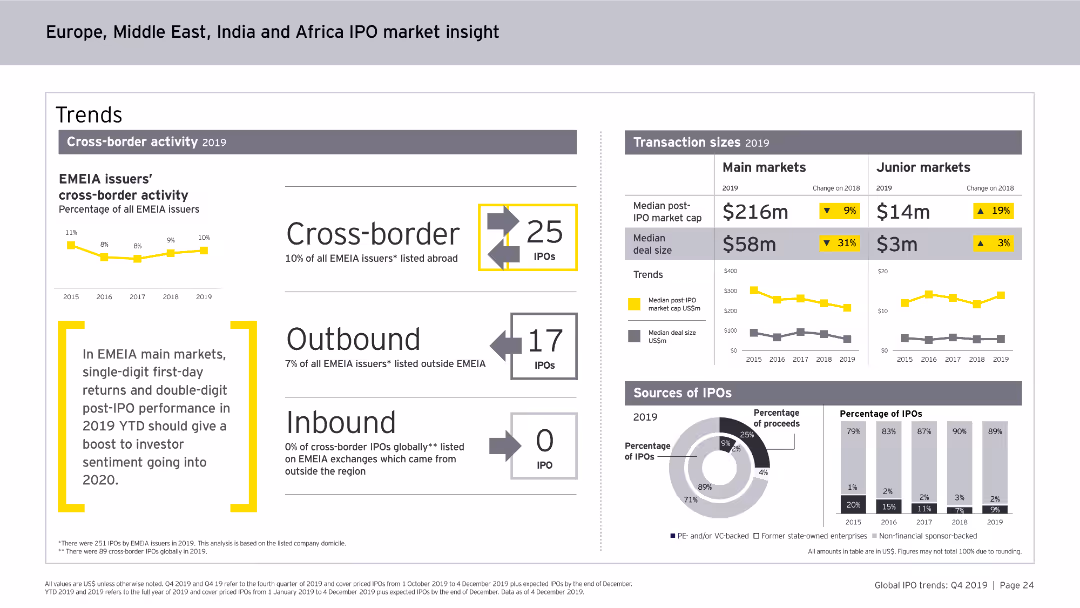
This slide features column charts and numerical data points. It shows trends in cross-border IPO activity in the EMEIA region, including outbound and inbound IPO statistics, transaction sizes, and sources of IPOs.
Market Analysis and Trends
Financial Services
The slide discusses trends in cross-border IPO activity in the EMEIA region for 2019, highlighting outbound and inbound IPO numbers, transaction sizes, and the distribution of IPO proceeds.
EMEIA, IPO, Cross-border, Market Trends, Financial Services, Outbound, Inbound, Transaction Sizes, 2019
false
Market Analysis and Trends
Financial Services financial-services
Multiple Chart
EY
View slide
This slide contains column charts, numerical data points, and textual highlights. It provides an overview of IPO activities in the EMEIA region in 2019, including market activity, stock exchanges, and sector analysis.
Market Analysis and Trends
Financial Services
The slide offers a comprehensive view of IPO market activities in the EMEIA region for 2019, covering the number of IPOs, proceeds, main and junior markets, sectors by IPOs, and performance metrics.
EMEIA, IPO, Market Analysis, Financial Services, Trends, Activity, Sectors, Stock Exchanges, 2019
false
Market Analysis and Trends
Financial Services financial-services
Multiple Chart
EY
View slide
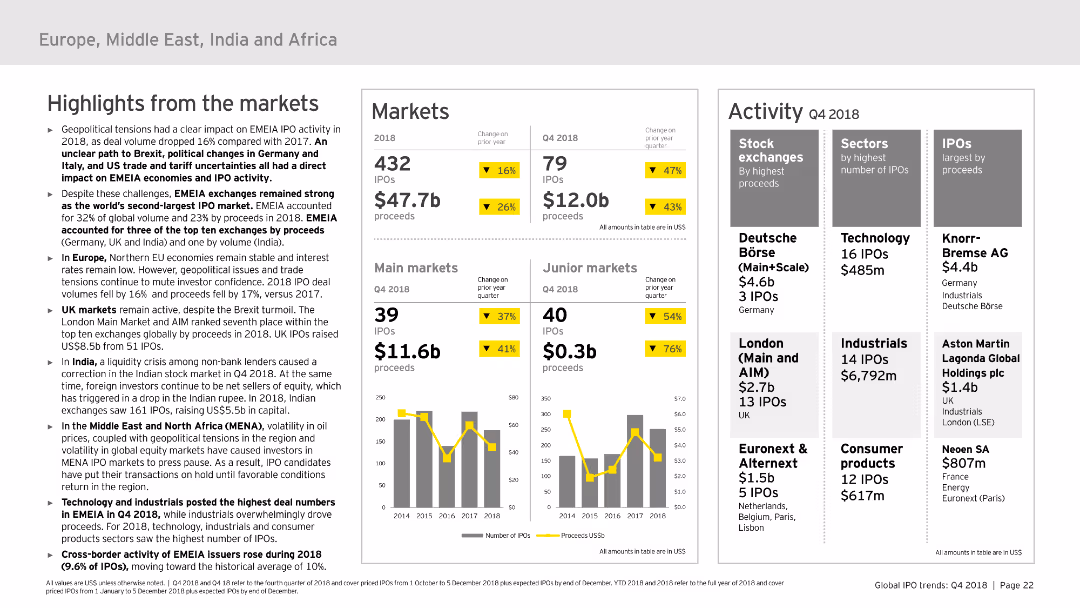
Divided into sections: highlights from the market, markets, and activity. It uses column charts and tables to present IPO data and market performance in EMEIA. The slide is detailed but well-organized, with a moderate level of visual complexity to convey information effectively.
Market Analysis and Trends
Financial Services
Covers the IPO market trends and activities in EMEIA for 2018, highlighting key market performances, sector-specific data, and overall market trends. Useful for regional market analysis and strategic insights.
EMEIA, IPO, market trends, sectors, market performance
false
Market Analysis and Trends
Financial Services financial-services
Multiple Chart
EY
View slide
Combines column charts and tables to show the number and proceeds of IPOs across EMEIA regions, with a focus on cross-border activity.
Market Analysis and Trends
Financial Services
The slide presents an overview of IPO performance in EMEIA, detailing cross-border activity and performance metrics.
EMEIA, IPOs, cross-border, performance, metrics
false
Market Analysis and Trends
Financial Services financial-services
Multiple Chart
EY
Previous
Loading...
Hold On!
We are searching in our database
If nothing, comes up, please try different filters!
Column Chart
Heatmap
Chevron
Org Chart
Infographic
Callouts
Timeline
List
Graphic
Picture
Process Flow
Diagram
Paragraph
Map
Table
Framework
Subtitle
Takeaway Box
Icon
Other Chart
Radar Chart
Waterfall Chart
Mekko Chart
Pie Chart
Scatter Plot
Line Chart
Bar chart
Bullet points
Create a FREE account to continue browsing
Receive Instant Access to 1,000+ slides from companies like McKinsey, Google, and Goldman Sachs
First Name
Last Name
Email
Password
I agree to all
Terms & Privacy Policy
Thank you! Your submission has been received!
Oops! Something went wrong while submitting the form.
Have an account?
Sign in
Upgrade to PRO to Save slides
Advanced Search and Filters
Access to 15,000+ slides
Access to Category Pages
Save/Bookmark Slides
PowerPoint Template Library
Pick a Plan
MONTHLY
$12/month
Billed every month, Cancel anytime.
YEARLY
$9/year
Billed $108 annually, Cancel anytime.
Checkout for $12/month
Checkout for $108/yr
Secured by Stripe | AES-256 bit encryption