My Account
My Slides
Search by Category
Templates
View All Templates
Download Template Slides
Leave Feedback
Login
Logout
Get Started
Browse all Slides
Browse all Slides
Create a FREE Account
Instant access to 1,000+ real slides from top companies like McKinsey, BCG, Goldman Sachs, Google and many more!
First Name
Last Name
Email
Password
I agree to all
Terms & Privacy Policy
Thank you! Your submission has been received!
Oops! Something went wrong while submitting the form.
Have an account?
Sign in
Spark Your Next Big Idea with New Presentation Templates
VIEW ALL Templates
Welcome,
Welcome
PRO
Show Featured Only
Checkbox 8
Companies
Mckinsey
Bain
BCG
EY
Deloitte
Accenture
PwC/Strategy&
JP Morgan
Goldman Sachs
Morgan Stanley
Citigroup
Deutsche Bank
Barclays
LEK
KPMG
Kearney
Oliver Wyman
Booz Allen Hamilton
Gartner
IPSOS
Nielsen
Slide type
Text Only
Linear Flow
Vertical Flow
Single Chart
Header Horizontal
Mixed Chart
Header Vertical
Pillar
Multiple Chart
Graphic
Agenda
Title
Table
Framework
Industry
Technology & Software
Artificial Intelligence
Financial Services
Retail & E-commerce
Consumer Goods
Industrial & Manufacturing
Transportation & Logistics
Telecommunications
Real Estate & Construction
Hospitality & Tourism
Professional Services
Education & Training
Media & Entertainment
Agriculture & Food Production
Healthcare & Pharmaceuticals
Environmental Services & Sustainability
Government & Public Sector
Use Case
Mergers and Acquisitions
Performance Metrics and KPIs
Client Case Studies
Competitive Landscape
Corporate Finance and Valuation
Product and Service Analysis
Customer and Market Segmentation
Organizational Structure and Change
Industry Overview
Regulatory and Compliance
Risk Assessment and Management
Investment Analysis
Organizational Structure and Change
Human Resources and Talent Management
Financial Performance
Market Analysis and Trends
Sales and Business Development
Human Resources and Talent Management
Clear all
Thank you! Your submission has been received!
Oops! Something went wrong while submitting the form.
Tag
View slide
This slide features three sets of column charts comparing 'Electricity', 'Fuel', and 'Heat' purchased or acquired from 2019 to 2021, in MWh. The charts are placed side by side in a muted color scheme. Each chart has a corresponding table below detailing the exact figures. The overall design is clean, utilizing white space effectively.
Financial Performance
Environmental Services & Sustainability
The slide provides a visual comparison of energy consumption data over three years. It's used for analyzing environmental sustainability efforts, specifically in tracking energy usage trends to inform corporate ESG strategies. It illustrates changes in consumption, which may reflect the effectiveness of conservation measures or shifts in operational scale.
ESG, Sustainability, Energy, Trends, Consumption, Comparison, Data, Corporate, Environment
false
Financial Performance
Environmental Services & Sustainability environmental-services-and-sustainability
Multiple Chart
McKinsey
View slide
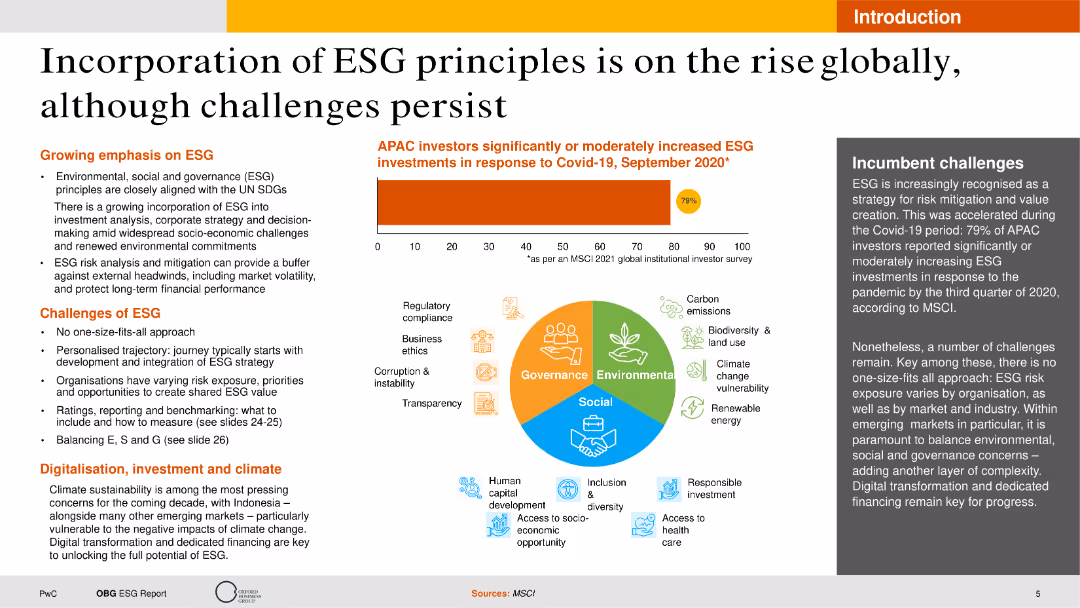
The slide features multiple text sections with a column chart showing ESG investment increases and an infographic illustrating governance, environmental, and social components. The layout is visually balanced with ample white space.
Strategic Planning
Environmental Services & Sustainability
This slide explains the growing emphasis on ESG principles, highlighting challenges, digital investment, and climate sustainability. It provides insights into the importance of ESG in investment analysis and long-term financial performance.
ESG, Sustainability, Investment, Challenges, Trends
false
Strategic Planning
Environmental Services & Sustainability environmental-services-and-sustainability
Mixed Chart
PwC/Strategy&
View slide
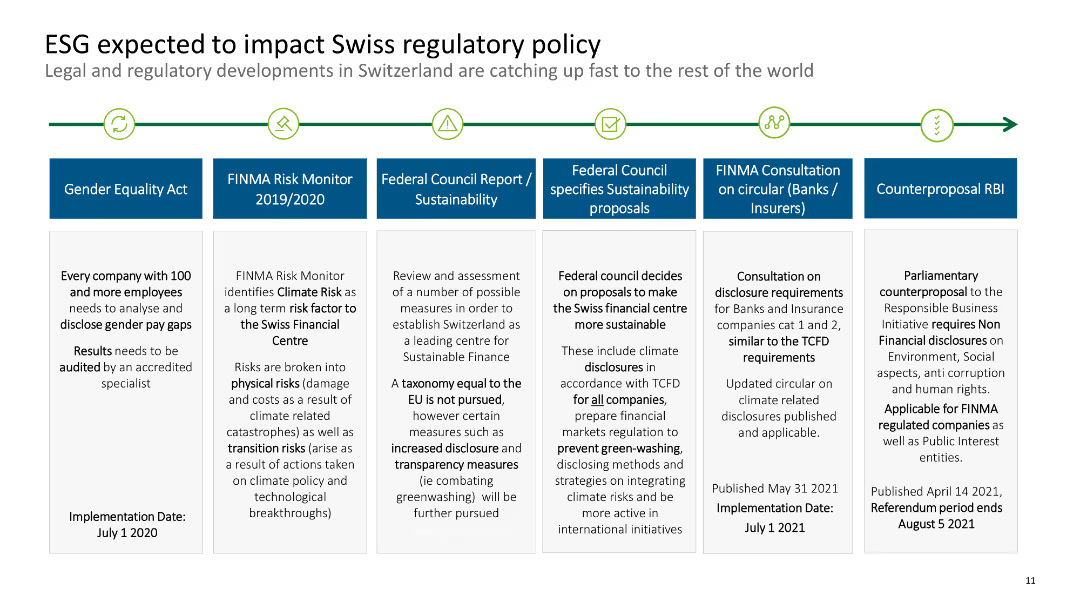
The slide includes a timeline with various regulatory milestones related to ESG and their expected impacts on Swiss policy.
Regulatory and Compliance
Financial Services
It discusses the expected impacts of ESG on Swiss regulatory policy, covering various acts and initiatives from the Gender Equality Act to the Parliamentary Counterproposal RBI.
ESG, Swiss, regulatory, policy, timeline
false
Regulatory and Compliance
Financial Services financial-services
Linear Flow
Deloitte
View slide
The slide displays three bar graphs comparing the importance of ESG considerations in VC investments across environmental, social, and governance aspects. Commentary text is placed to the right. The graphs use a grey-blue palette, maintaining a professional appearance.
Investment Analysis
Financial Services
The slide examines how venture capital investors rate the importance of ESG dimensions in their investment processes, with additional insights provided on the slide. This can be used in discussions about investment strategies and sustainability practices in the VC industry.
ESG, VC investment, importance rating, environmental, social, governance
false
Investment Analysis
Financial Services financial-services
Mixed Chart
Bain
View slide
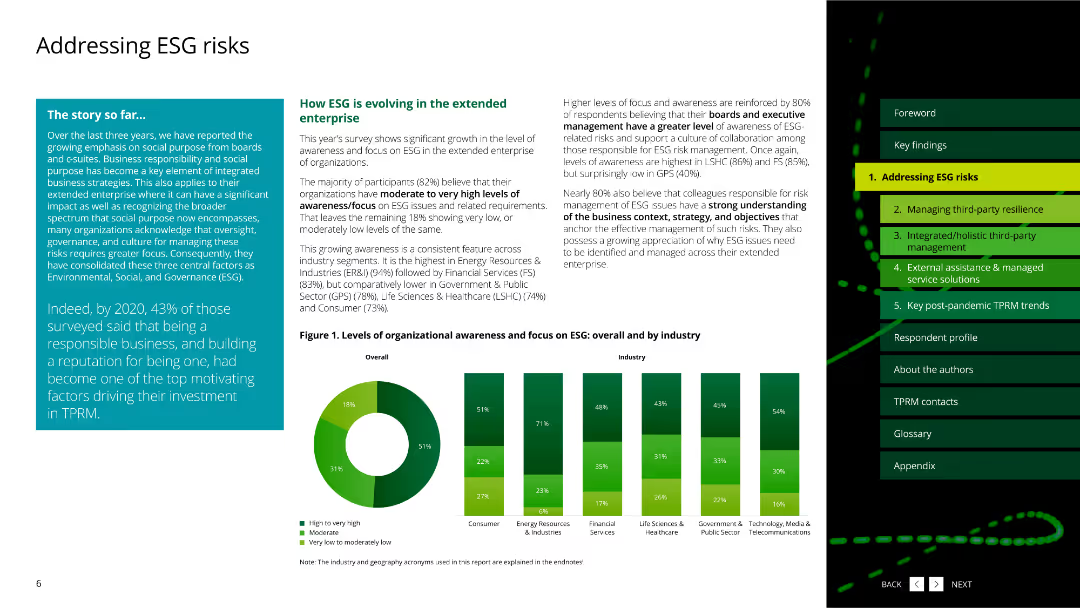
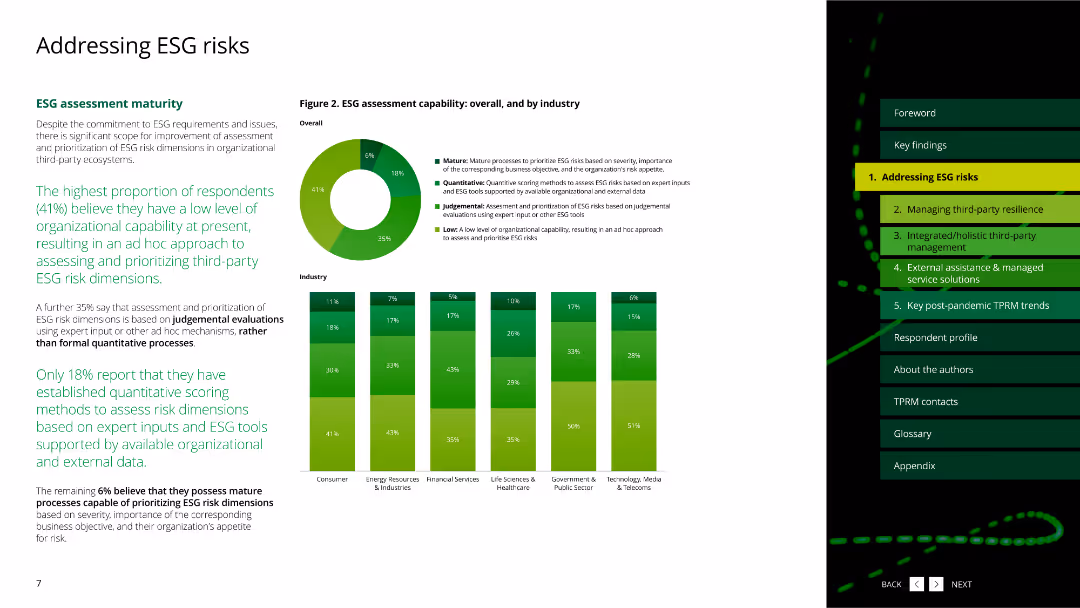
The slide features a pie chart and column charts about ESG assessment maturity by industry.
Risk Assessment and Management
Environmental Services & Sustainability
This slide covers the current maturity levels of ESG assessment across different industries based on a survey.
ESG, assessment, maturity, industry, survey
false
Risk Assessment and Management
Environmental Services & Sustainability environmental-services-and-sustainability
Multiple Chart
Deloitte
View slide
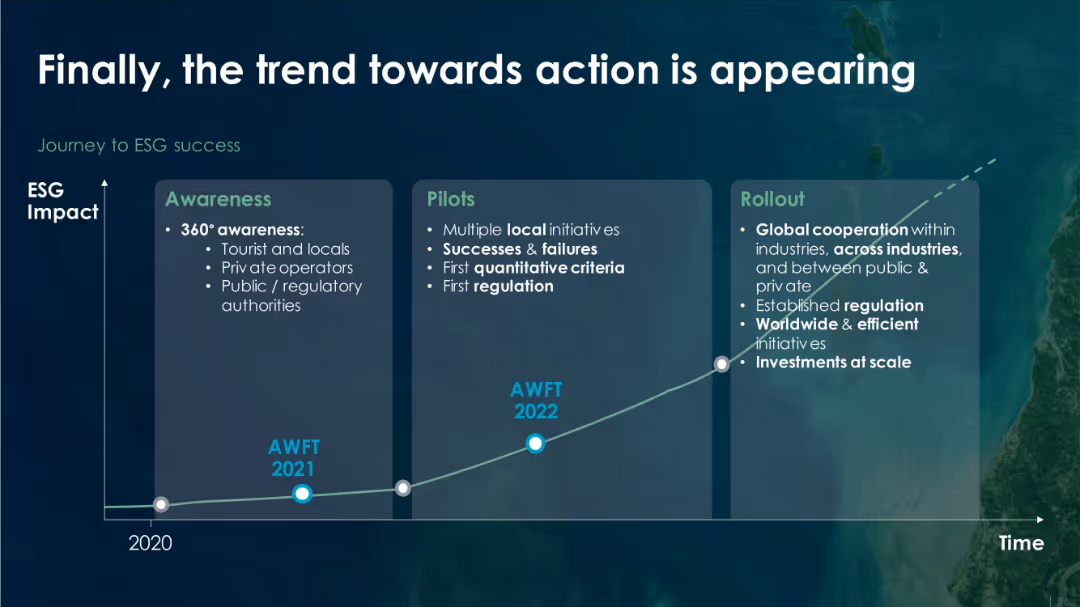
Timeline chart with three vertical panels labeled "Awareness," "Pilots," and "Rollout" on a dark background with a rising trendline labeled by years.
Strategic Planning
Environmental Services & Sustainability
The slide outlines the progressive stages of ESG (Environmental, Social, Governance) implementation: awareness (2021), pilot initiatives (2022), and eventual global rollout. It highlights increasing regulation, investment, and cooperation as ESG efforts mature over time.
ESG, awareness, regulation, investment, pilot, sustainability, global rollout, timeline
false
Strategic Planning
Environmental Services & Sustainability environmental-services-and-sustainability
Single Chart
Roland Berger
View slide
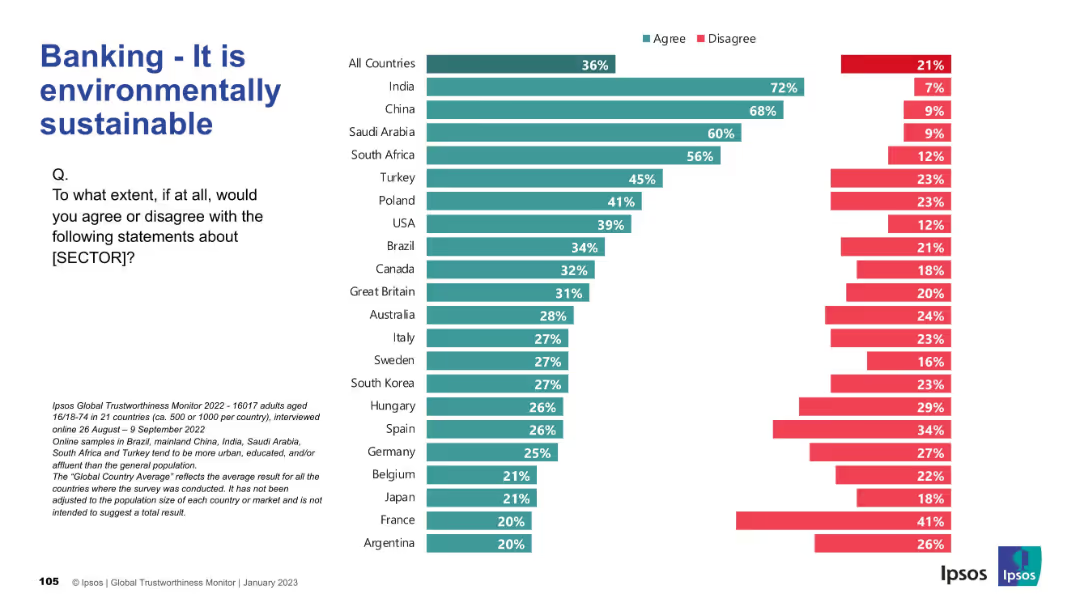
Bar chart depicting perception of the banking sector’s sustainability. Layout consistent with previous.
Market Analysis and Trends
Financial Services
Focuses on views around environmental sustainability in banking. India and China again top agreement levels, while Western countries show skepticism. Sustainability is not broadly recognized as a banking strength.
ESG, banking, sustainability, public perception, Ipsos, environment, finance
false
Market Analysis and Trends
Financial Services financial-services
Mixed Chart
IPSOS
View slide
Contains a bar chart detailing perceived benefits of ESG transformation within organizations, such as competitive advantage and reputation enhancement. The chart is horizontal with varying lengths for each benefit listed.
Strategic Planning
Environmental Services & Sustainability
This slide assesses the perceived benefits that ESG practices bring to organizations, notably in improving reputation and competitive advantage. It suggests that businesses view ESG as more than a compliance requirement; it's a strategic enabler for long-term success.
ESG, benefits, competitive advantage, reputation, 2023
false
Strategic Planning
Environmental Services & Sustainability environmental-services-and-sustainability
Single Chart
PwC/Strategy&
View slide
Slide presents three columns titled Environment, Social, Governance each with icons and associated initiatives, emphasizing Barclays' achievements and goals in ESG.
Strategic Planning
Financial Services
Highlights Barclays' ESG strategies and achievements, recognizing its status as the Best Bank for ESG in the UK by Euromoney, with detailed descriptions of initiatives across all ESG dimensions.
ESG, best practices, governance, social responsibility, environmental policy, awards
false
Strategic Planning
Financial Services financial-services
Pillar
Barclays
View slide
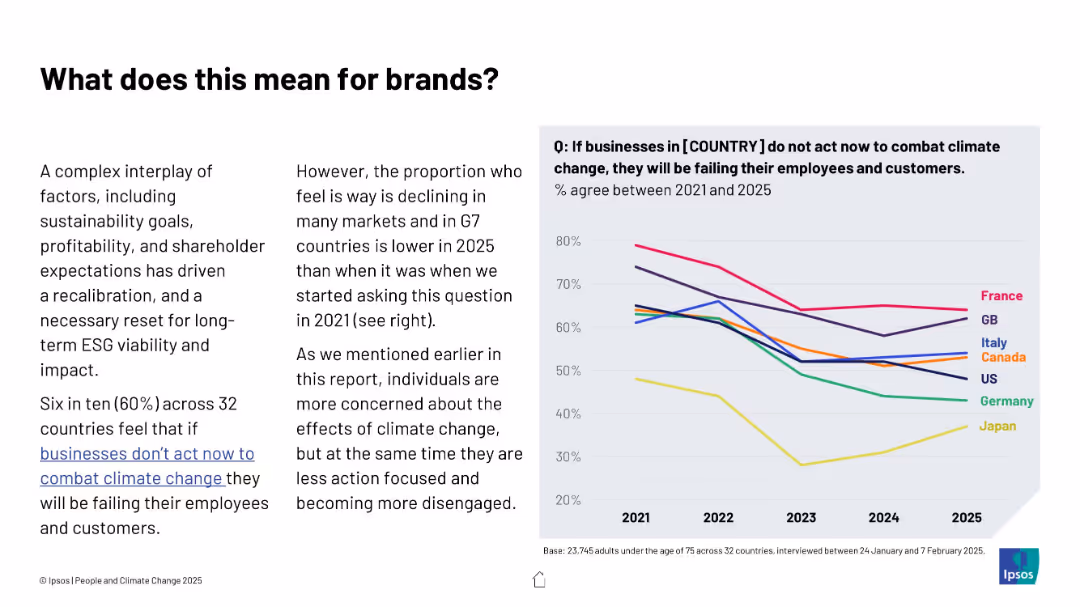
Text and line graph combination; left features contextual explanation, right shows trend lines for multiple countries from 2021 to 2025
Strategic Planning
Professional Services
The slide explores declining belief in corporate responsibility to combat climate change across G7 nations. A downward trend suggests companies may face lower public pressure, despite ongoing environmental challenges.
ESG, brands, climate responsibility, trends, business impact, public opinion, Ipsos, G7, consumer expectations
false
Strategic Planning
Professional Services professional-services
Mixed Chart
IPSOS
View slide
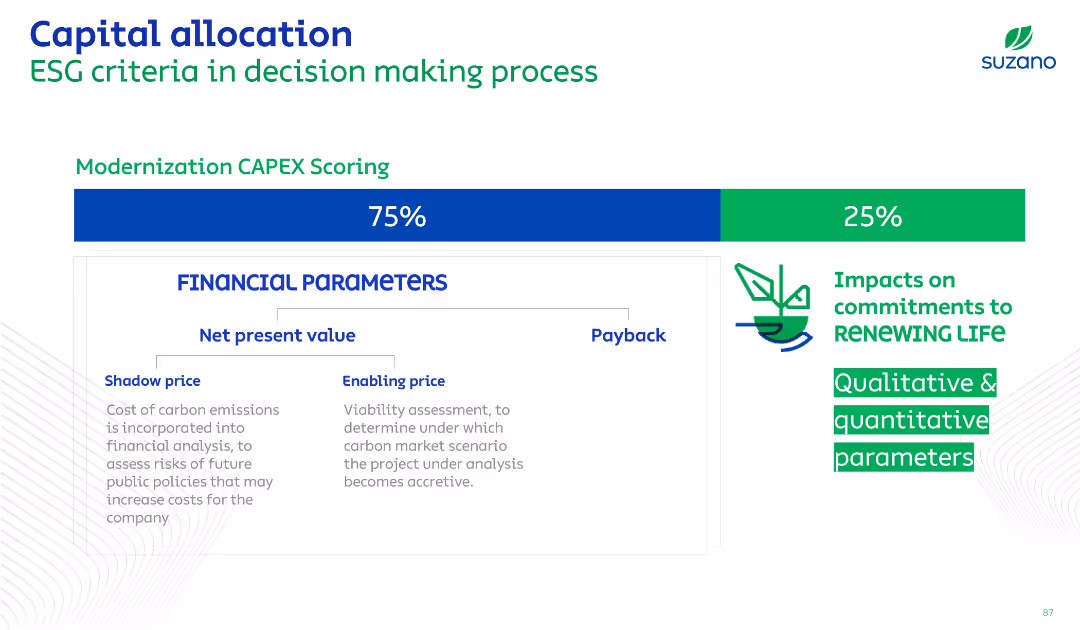
Balanced split with financial scoring on left (75%) and ESG impacts on right (25%). Text-based, minimalist design with icons and green/blue accents.
Corporate Finance and Valuation
Financial Services
Describes how Suzano incorporates ESG (Environmental, Social, and Governance) criteria into capital allocation decisions. Scoring gives weight to financial parameters and sustainability goals, with qualitative and quantitative metrics.
ESG, capital allocation, finance, valuation, sustainability, decision-making, scoring
false
Corporate Finance and Valuation
Financial Services financial-services
Mixed Chart
Goldman Sachs
View slide
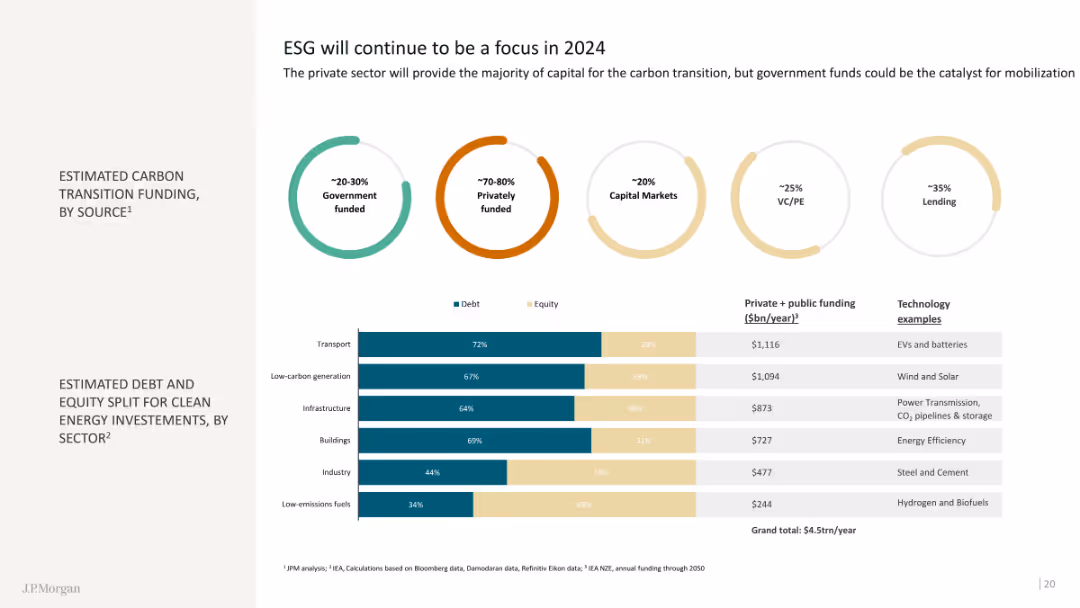
This slide features doughnut charts showing estimated carbon transition funding by source and a bar chart on estimated debt and equity split for clean energy investments by sector. The visuals are clear and informative.
Regulatory and Compliance
Financial Services
The slide details funding sources for carbon transition and the distribution of investments in clean energy sectors, highlighting the role of private sector and government funding.
ESG, carbon transition, clean energy
false
Regulatory and Compliance
Financial Services financial-services
Mixed Chart
JP Morgan
View slide
Slide features a bar chart illustrating the main challenges organizations face in their transition to ESG-focused operations. Challenges such as lack of expertise and policy incentives are shown, with bars horizontally displayed.
Risk Assessment and Management
Environmental Services & Sustainability
Highlights the significant barriers to adopting ESG practices within organizations, including gaps in expertise and insufficient governmental support. This insight is crucial for understanding the hurdles that companies must overcome to fully integrate ESG principles into their business strategies.
ESG, challenges, transition, barriers, 2023
false
Risk Assessment and Management
Environmental Services & Sustainability environmental-services-and-sustainability
Single Chart
PwC/Strategy&
View slide
A column chart on the slide displays top ESG characteristics included in investment decisions. An image of a green building is on the left.
Market Analysis and Trends
Financial Services
Investigates which ESG characteristics investors consider in their decision-making process, highlighting governance, climate risk, and other factors.
ESG, characteristics, governance, climate risk, investors, investment decisions, green building, analysis
false
Market Analysis and Trends
Financial Services financial-services
Mixed Chart
EY
View slide
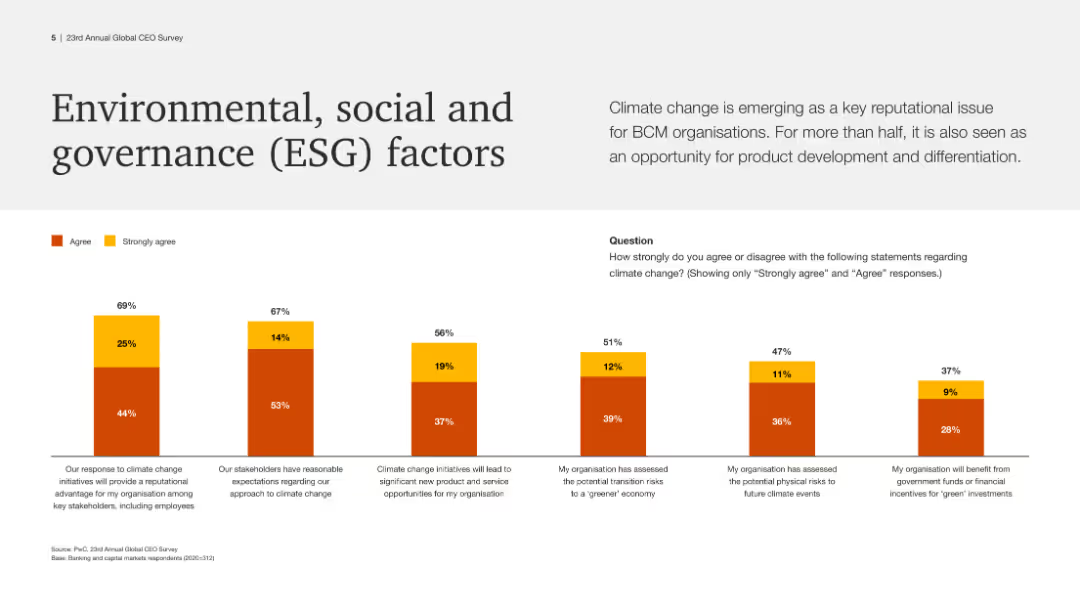
The slide features a white background with a large title at the top. Below, a column chart with orange and yellow bars shows responses to ESG factors.
Risk Assessment and Management
Financial Services
This slide outlines how BCM organizations view ESG factors, with percentages showing the extent of agreement with statements regarding climate change and related policies.
ESG, climate change, BCM, organizations, policies, risks, environment, social, governance
false
Risk Assessment and Management
Financial Services financial-services
Mixed Chart
PwC/Strategy&
View slide
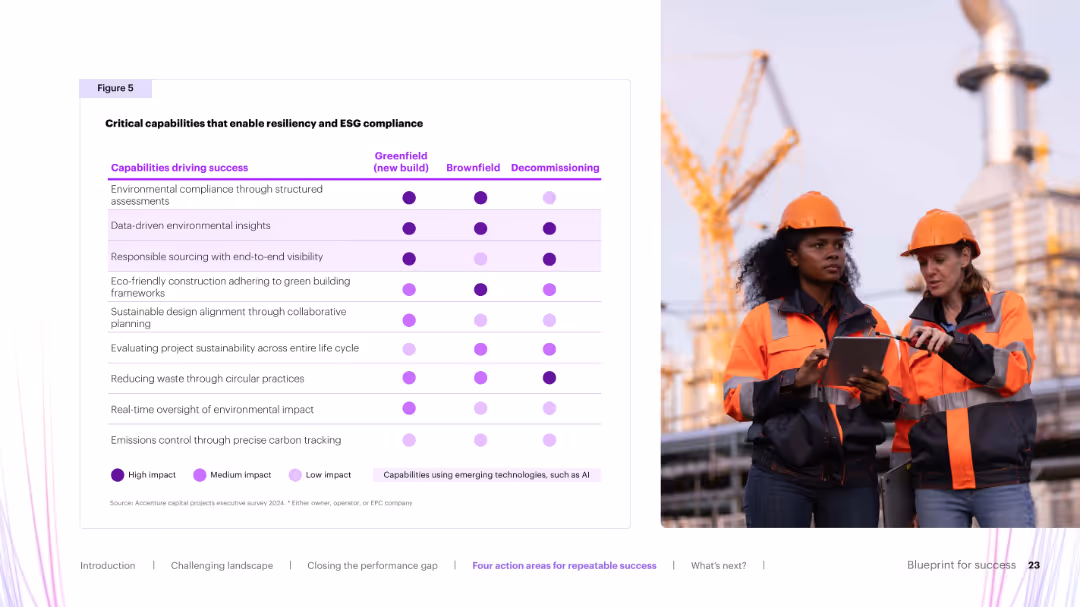
Matrix similar to previous slide but focused on ESG capabilities across project stages. Purple dots denote impact and emerging tech use.
Regulatory and Compliance
Environmental Services & Sustainability
Displays critical ESG-related capabilities and their relevance across project types. Emphasizes high-impact practices like environmental assessments, data-driven insights, and sustainable sourcing. Highlights emerging tech integration.
ESG, compliance, sustainability, data insights, green building
false
Regulatory and Compliance
Environmental Services & Sustainability environmental-services-and-sustainability
Table
Accenture
View slide
The slide contains text and bar charts analyzing the impact of ESG commitments on business operations and the prevalence of corporate greenwashing.
Regulatory and Compliance
Environmental Services & Sustainability
Discusses the importance of ESG (Environmental, Social, and Governance) performance, its impact on business operations, and the risks of corporate greenwashing.
ESG, corporate responsibility, greenwashing, business impact, regulatory compliance
false
Regulatory and Compliance
Environmental Services & Sustainability environmental-services-and-sustainability
Multiple Chart
IPSOS
View slide
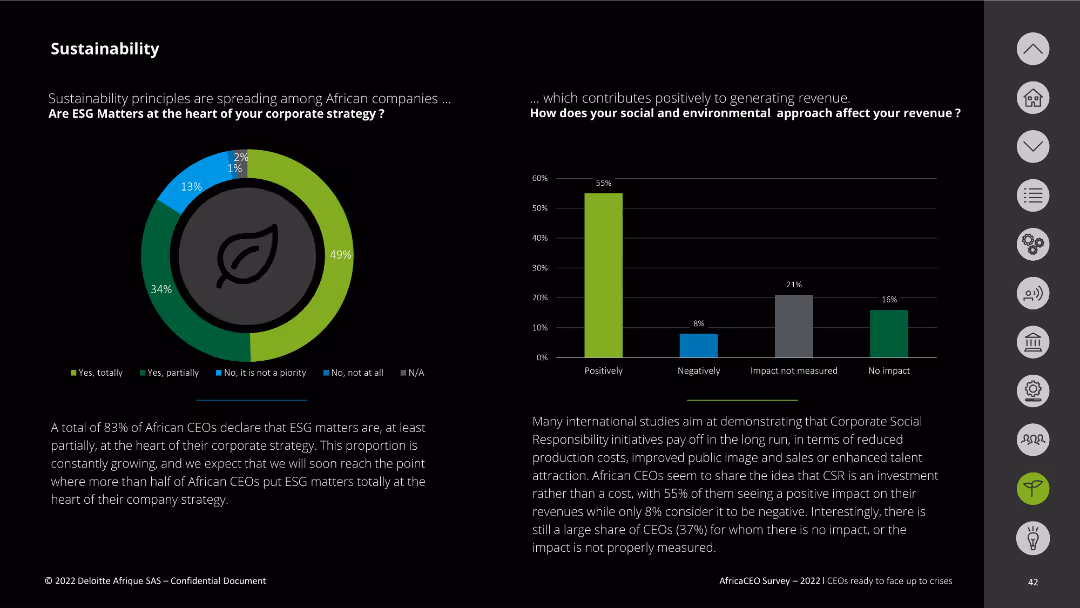
This slide includes a donut chart and a vertical bar chart. It displays data on the importance of ESG matters in corporate strategies and their impact on revenue.
Corporate Finance and Valuation
Environmental Services & Sustainability
The slide highlights how ESG matters are becoming integral to corporate strategies among African CEOs and their positive effects on revenue.
ESG, corporate strategy, revenue impact, sustainability, African CEOs
false
Corporate Finance and Valuation
Environmental Services & Sustainability environmental-services-and-sustainability
Multiple Chart
Deloitte
View slide
Three main sections with icons and brief bullet points illustrate the company's commitment to Environmental, Social, and Governance (ESG) principles. Clear and straightforward layout with a balance of text and graphics.
Regulatory and Compliance
Financial Services
Slide illustrates company values in ESG, demonstrating the initiatives and achievements in social responsibility. Could be used to underscore the ethical framework and operational philosophy of the company.
ESG, corporate values, social responsibility, governance, sustainability
false
Regulatory and Compliance
Financial Services financial-services
Pillar
Goldman Sachs
View slide
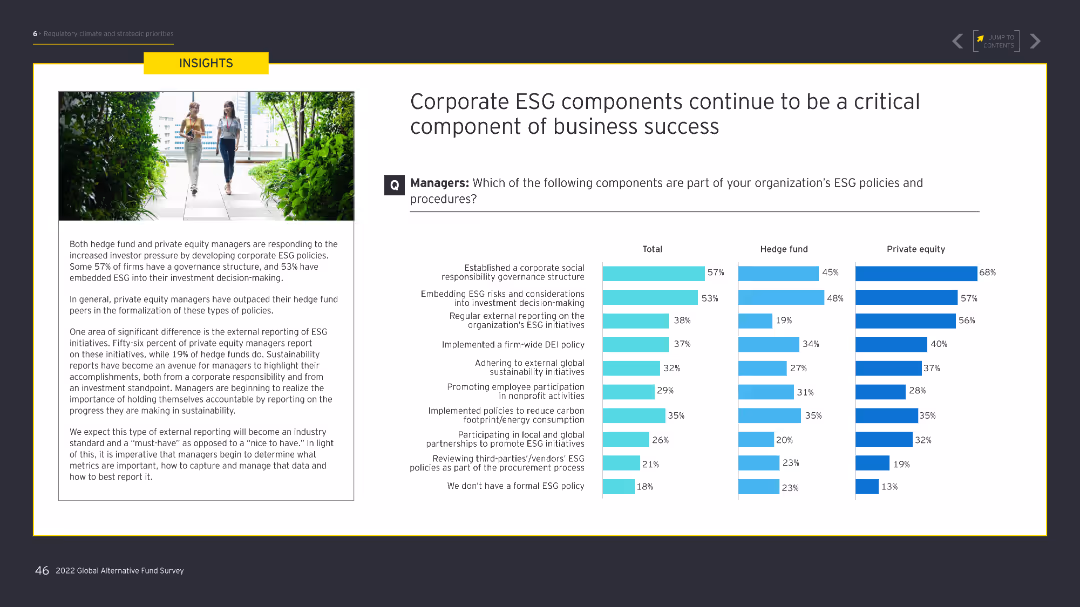
Includes a large image on the left and column charts on the right comparing hedge funds and private equity managers on various ESG policy components.
Regulatory and Compliance
Financial Services
The slide explores the importance of corporate ESG policies, showing how different components are integrated into hedge fund and private equity management practices.
ESG, corporate, business success, hedge funds, private equity
false
Regulatory and Compliance
Financial Services financial-services
Multiple Chart
EY
View slide
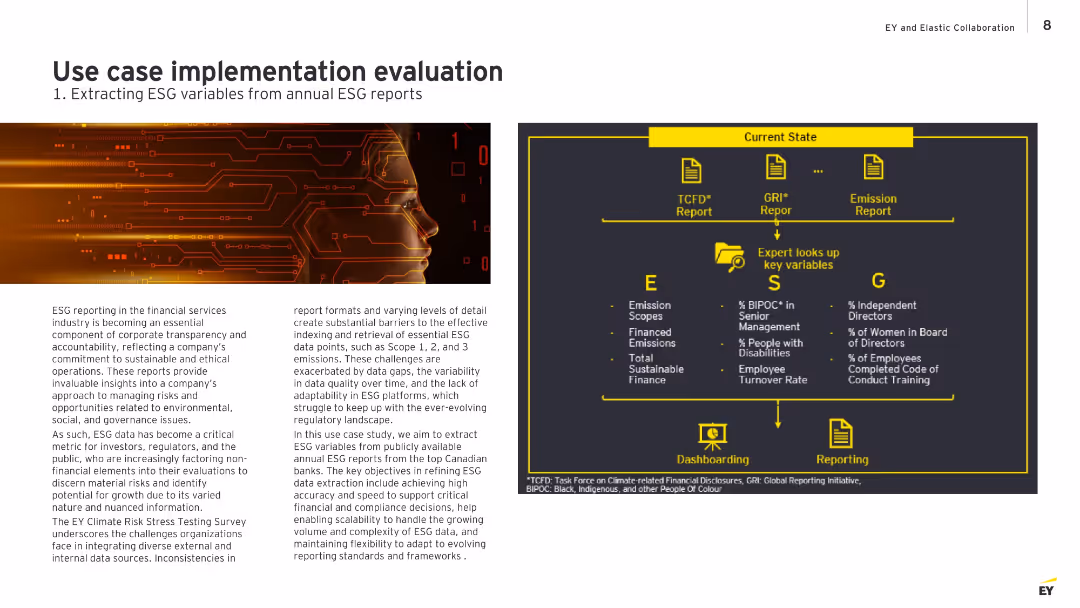
Split layout with left side showing a digital face illustration and descriptive text; right side contains an infographic with current ESG report structure, expert lookup, and dashboard/reporting flow.
Technology and Digital Transformation
Financial Services
Describes the challenge of ESG data extraction from inconsistent report formats and highlights EY's approach to improve efficiency and accuracy in extracting key ESG variables using structured reports from top Canadian banks. It outlines the manual process experts follow and the intended transition to a digital, scalable solution.
ESG, data extraction, financial reports, compliance, automation, sustainability, EY
false
Technology and Digital Transformation
Financial Services financial-services
Diagram
EY
View slide
The slide includes column charts displaying ESG dimensions managed by respondents.
Risk Assessment and Management
Environmental Services & Sustainability
This slide highlights the quality of data used for managing and reporting ESG risks across various industries.
ESG, data quality, reporting, dimensions, industries
false
Risk Assessment and Management
Environmental Services & Sustainability environmental-services-and-sustainability
Multiple Chart
Deloitte
View slide
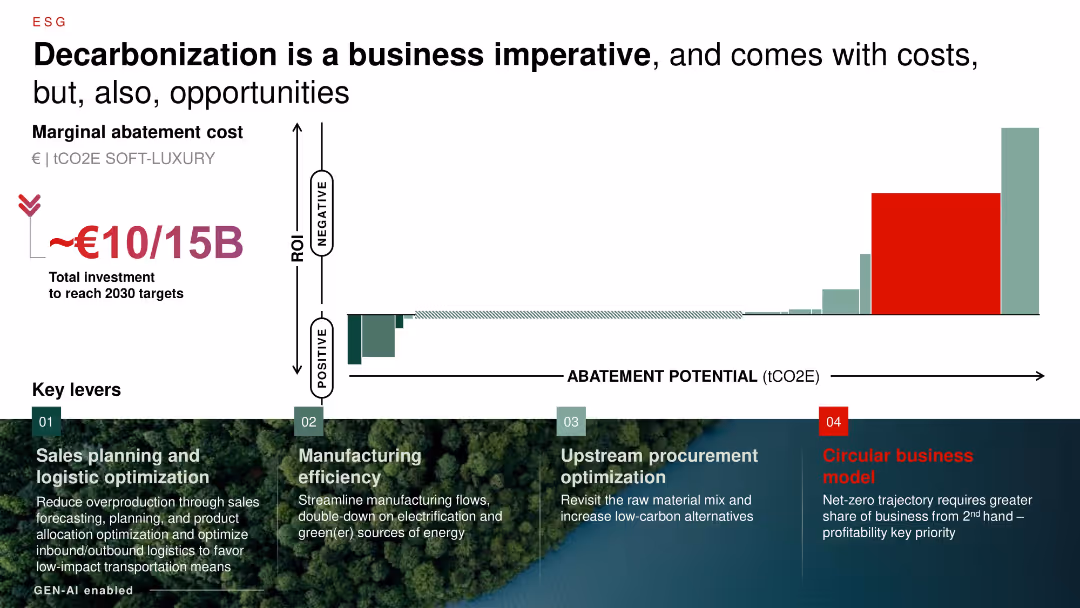
Bar chart showing marginal abatement costs (horizontal axis), ROI (vertical axis), and total investment; green/eco-themed visual section at bottom with 4 levers.
Regulatory and Compliance
Environmental Services & Sustainability
Emphasizes need for €10–15B investment in soft luxury sector to reach 2030 decarbonization targets. Highlights levers such as logistics, manufacturing, procurement, and circular business models. ROI varies with abatement potential.
ESG, decarbonization, investment, abatement, circular economy, manufacturing, logistics
false
Regulatory and Compliance
Environmental Services & Sustainability environmental-services-and-sustainability
Mixed Chart
Bain
View slide
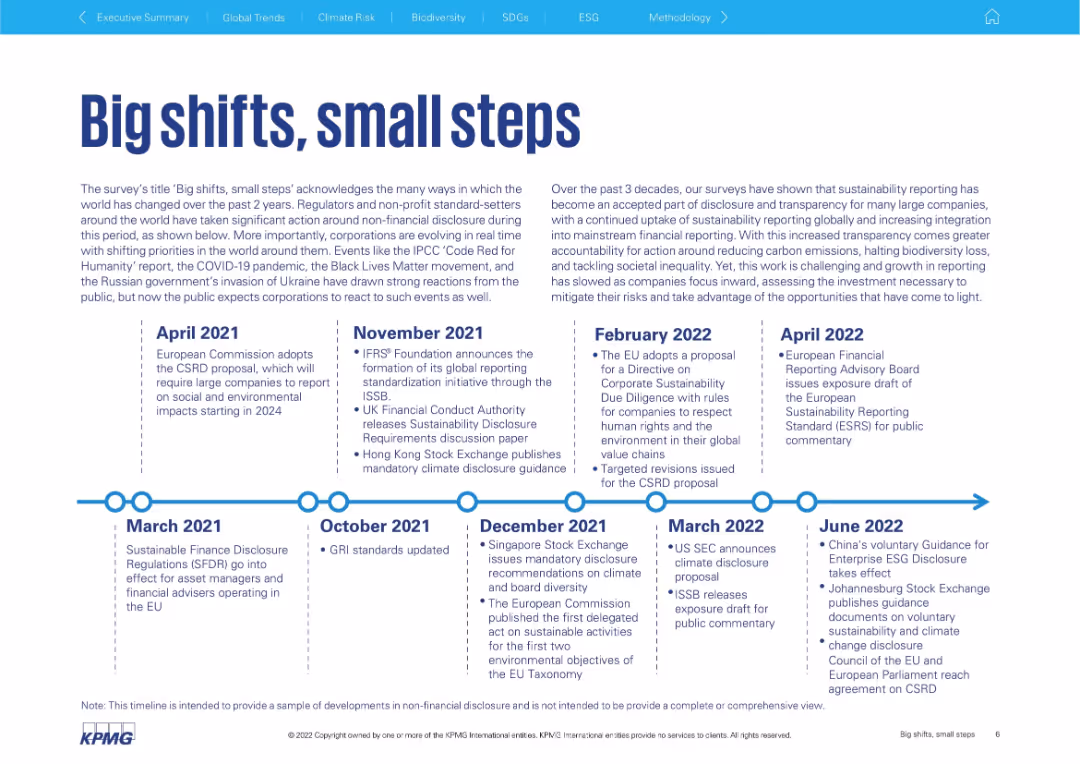
Horizontal timeline with text boxes summarizing major ESG policy/regulatory events from 2021 to 2022.
Regulatory and Compliance
Government & Public Sector
Summarizes regulatory and policy milestones impacting corporate sustainability disclosures from 2021–2022. Highlights actions by the EU, UK, ISSB, and other governing bodies. Supports the idea that corporations must adapt to evolving environmental and social disclosure mandates.
ESG, disclosure, regulation, corporate reporting, timeline, sustainability policy, compliance, EU, ISSB
false
Regulatory and Compliance
Government & Public Sector government-and-public-sector
Linear Flow
KPMG
View slide
The layout is split into three sections for environment, social, and governance, each with bullet points and icons. At the bottom, there's a section with key FY19 highlights and corresponding icons.
Regulatory and Compliance
Financial Services
Showcases Macquarie's ESG commitment and achievements, outlining key principles, initiatives, and FY19 highlights, important for stakeholder engagement and showcasing corporate responsibility.
ESG, environment, social, governance, sustainability, corporate responsibility, Macquarie
false
Regulatory and Compliance
Financial Services financial-services
Table
Goldman Sachs
View slide
Slide features a central graphic summarizing ESG commitments with icons and lists around it, highlighting different aspects of ESG initiatives.
Regulatory and Compliance
Environmental Services & Sustainability
Showcases Permian Resources' dedication to ESG through various initiatives like minimizing impact, reducing emissions, and ensuring diversity and inclusion, aiming at holistic ESG excellence.
ESG, environmental impact, emissions reduction, diversity, shareholder alignment, community benefit
false
Regulatory and Compliance
Environmental Services & Sustainability environmental-services-and-sustainability
Framework
Barclays
View slide
The slide features a column chart with annotations, and two iconographic bullet points. Red and grey are the primary colors used in the graphics.
Financial Performance
Financial Services
The slide outlines Leonardo's ESG-linked financial sources, including transactions and key performance indicators aligned with the company's strategy and long-term plans. It emphasizes sustainability in finance.
ESG, finance, sustainability, KPI, funding, credit facility, term loan, CO2 emissions reduction, STEM employment
false
Financial Performance
Financial Services financial-services
Mixed Chart
Goldman Sachs
View slide
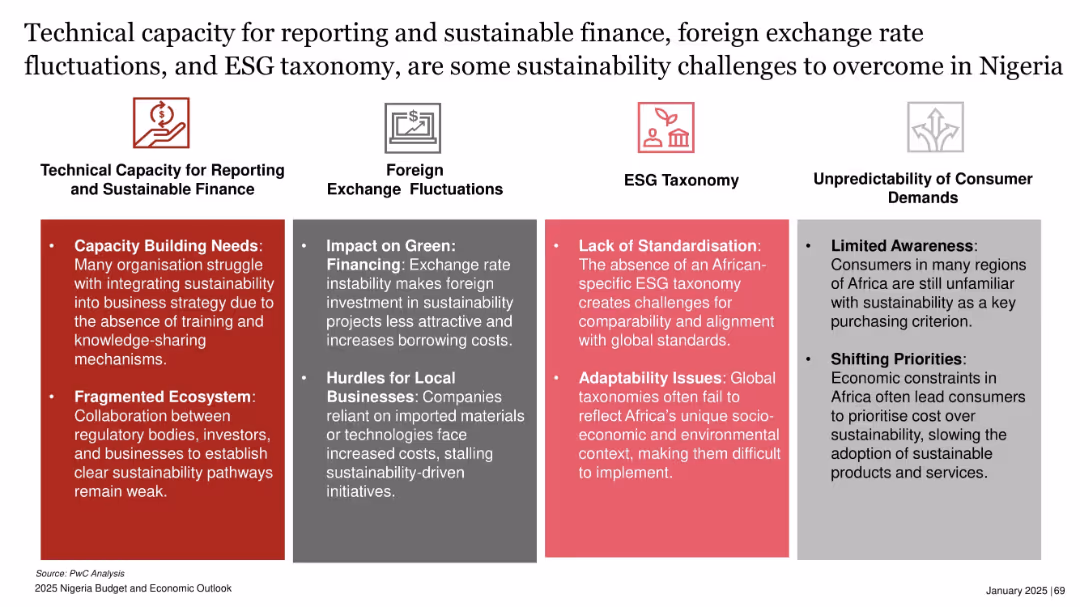
Multi-column layout with four categories, each with color-coded headers and bullet point issues
Regulatory and Compliance
Environmental Services & Sustainability
The slide outlines four main challenges to sustainability in Nigeria: weak technical capacity, exchange rate instability, lack of ESG standardization, and unpredictable consumer demand. Each category lists specific issues impacting green financing, reporting, and adoption of sustainable practices.
ESG, finance, sustainability, Nigeria, green financing, reporting, taxonomy, exchange rate
false
Regulatory and Compliance
Environmental Services & Sustainability environmental-services-and-sustainability
Pillar
PwC/Strategy&
View slide
Slide includes a column chart showing funding channels for ESG projects, like internal cash flow and green bonds. The chart is vertical and color-coded to differentiate between 2022 and 2023, indicating shifts in funding preferences over time.
Financial Performance
Environmental Services & Sustainability
Focuses on the financing strategies companies are adopting for ESG projects, particularly the increasing reliance on internal funding in response to higher interest rates and tighter credit markets. This shift underscores the practical aspects of funding sustainable initiatives amid broader economic pressures.
ESG, funding, finance, green bonds, 2023
false
Financial Performance
Environmental Services & Sustainability environmental-services-and-sustainability
Single Chart
PwC/Strategy&
View slide
The slide includes text on the left describing the ESG Champions initiative and a timeline at the bottom showing the ESG Champion process in Croatia, with five steps from application to publication and feedback. An image of wind turbines is on the right.
Strategic Planning
Environmental Services & Sustainability
The slide introduces the ESG Champions initiative, a program to assess companies' ESG maturity across environmental, social, and governance dimensions. It details the timeline for the initiative's process in Croatia, from data collection to publication of results.
ESG, initiative, champions, assessment, timeline
false
Strategic Planning
Environmental Services & Sustainability environmental-services-and-sustainability
Linear Flow
Kearney
Previous
Loading...
Hold On!
We are searching in our database
If nothing, comes up, please try different filters!
Column Chart
Heatmap
Chevron
Org Chart
Infographic
Callouts
Timeline
List
Graphic
Picture
Process Flow
Diagram
Paragraph
Map
Table
Framework
Subtitle
Takeaway Box
Icon
Other Chart
Radar Chart
Waterfall Chart
Mekko Chart
Pie Chart
Scatter Plot
Line Chart
Bar chart
Bullet points
Create a FREE account to continue browsing
Receive Instant Access to 1,000+ slides from companies like McKinsey, Google, and Goldman Sachs
First Name
Last Name
Email
Password
I agree to all
Terms & Privacy Policy
Thank you! Your submission has been received!
Oops! Something went wrong while submitting the form.
Have an account?
Sign in
Upgrade to PRO to Save slides
Advanced Search and Filters
Access to 15,000+ slides
Access to Category Pages
Save/Bookmark Slides
PowerPoint Template Library
Pick a Plan
MONTHLY
$12/month
Billed every month, Cancel anytime.
YEARLY
$9/year
Billed $108 annually, Cancel anytime.
Checkout for $12/month
Checkout for $108/yr
Secured by Stripe | AES-256 bit encryption