My Account
My Slides
Search by Category
Templates
View All Templates
Download Template Slides
Leave Feedback
Login
Logout
Get Started
Browse all Slides
Browse all Slides
Create a FREE Account
Instant access to 1,000+ real slides from top companies like McKinsey, BCG, Goldman Sachs, Google and many more!
First Name
Last Name
Email
Password
I agree to all
Terms & Privacy Policy
Thank you! Your submission has been received!
Oops! Something went wrong while submitting the form.
Have an account?
Sign in
Spark Your Next Big Idea with New Presentation Templates
VIEW ALL Templates
Welcome,
Welcome
PRO
Show Featured Only
Checkbox 8
Companies
Mckinsey
Bain
BCG
EY
Deloitte
Accenture
PwC/Strategy&
JP Morgan
Goldman Sachs
Morgan Stanley
Citigroup
Deutsche Bank
Barclays
LEK
KPMG
Kearney
Oliver Wyman
Booz Allen Hamilton
Gartner
IPSOS
Nielsen
Slide type
Text Only
Linear Flow
Vertical Flow
Single Chart
Header Horizontal
Mixed Chart
Header Vertical
Pillar
Multiple Chart
Graphic
Agenda
Title
Table
Framework
Industry
Technology & Software
Artificial Intelligence
Financial Services
Retail & E-commerce
Consumer Goods
Industrial & Manufacturing
Transportation & Logistics
Telecommunications
Real Estate & Construction
Hospitality & Tourism
Professional Services
Education & Training
Media & Entertainment
Agriculture & Food Production
Healthcare & Pharmaceuticals
Environmental Services & Sustainability
Government & Public Sector
Use Case
Mergers and Acquisitions
Performance Metrics and KPIs
Client Case Studies
Competitive Landscape
Corporate Finance and Valuation
Product and Service Analysis
Customer and Market Segmentation
Organizational Structure and Change
Industry Overview
Regulatory and Compliance
Risk Assessment and Management
Investment Analysis
Organizational Structure and Change
Human Resources and Talent Management
Financial Performance
Market Analysis and Trends
Sales and Business Development
Human Resources and Talent Management
Clear all
Thank you! Your submission has been received!
Oops! Something went wrong while submitting the form.
Tag
View slide
The slide includes a mix of pie charts and bar graphs showing the impact of societal and environmental changes on companies and their ESG strategies.
Regulatory and Compliance
Environmental Services & Sustainability
The slide examines the impact of societal and environmental changes on companies and their ESG strategies, with data on current and future ESG plans.
ESG, investment, societal changes, environmental impact, governance
false
Regulatory and Compliance
Environmental Services & Sustainability environmental-services-and-sustainability
Multiple Chart
EY
View slide
The slide presents a pie chart comparing the levels of ESG investment planned by organizations for 2023 versus 2022. The chart uses color distinctions to show changes in investment strategies, such as increases or decreases.
Investment Analysis
Environmental Services & Sustainability
Analyzes trends in corporate ESG investment, highlighting a cautious approach in the wake of economic challenges. It indicates shifts in corporate spending on sustainability initiatives, providing insights into how businesses plan to navigate financial uncertainties while still prioritizing ESG goals.
ESG, investment, trends, corporate spending, 2023
false
Investment Analysis
Environmental Services & Sustainability environmental-services-and-sustainability
Multiple Chart
PwC/Strategy&
View slide
The slide includes a pie chart on investor requirements for ESG solutions and an image of professionals outdoors with solar panels.
Market Analysis and Trends
Financial Services
Examines investor demand for ESG solutions, focusing on governance and climate risk, and details the percentage of investors required to invest in socially responsible products.
ESG, investor demand, governance, climate risk, socially responsible, investment, solar panels, professionals, analysis
false
Market Analysis and Trends
Financial Services financial-services
Mixed Chart
EY
View slide
This slide has a large image on the left and column charts on the right, detailing the impact of ESG policies on investment decisions and investor satisfaction with these policies.
Regulatory and Compliance
Financial Services
The slide discusses the evolution of ESG policies among managers and the increasing focus of investors on these policies, highlighting their importance in investment decisions.
ESG, managers, investors, policies, corporate
false
Regulatory and Compliance
Financial Services financial-services
Multiple Chart
EY
View slide
This slide features icons and tables. Each chart corresponds to a different rating agency and shows the ESG rating criteria, score range, specific scores, and rating development. The design is clean with blue and white color scheme.
Financial Performance
Financial Services
The slide presents Deutsche Bank's ESG performance as evaluated by several rating agencies. It details the criteria, score, and trends in ratings, demonstrating how the bank stands on environmental, social, and governance factors as of February 2024.
ESG, performance, rating agencies, trends, finance
false
Financial Performance
Financial Services financial-services
Table
Deutsche Bank
View slide
Slide with three columns using icons and lists to discuss environment, social, and governance topics.
Regulatory and Compliance
Financial Services
Outlines ESG achievements and goals, emphasizing improvements in policy and corporate culture.
ESG, policy, corporate governance, sustainability, achievements
false
Regulatory and Compliance
Financial Services financial-services
Pillar
Barclays
View slide
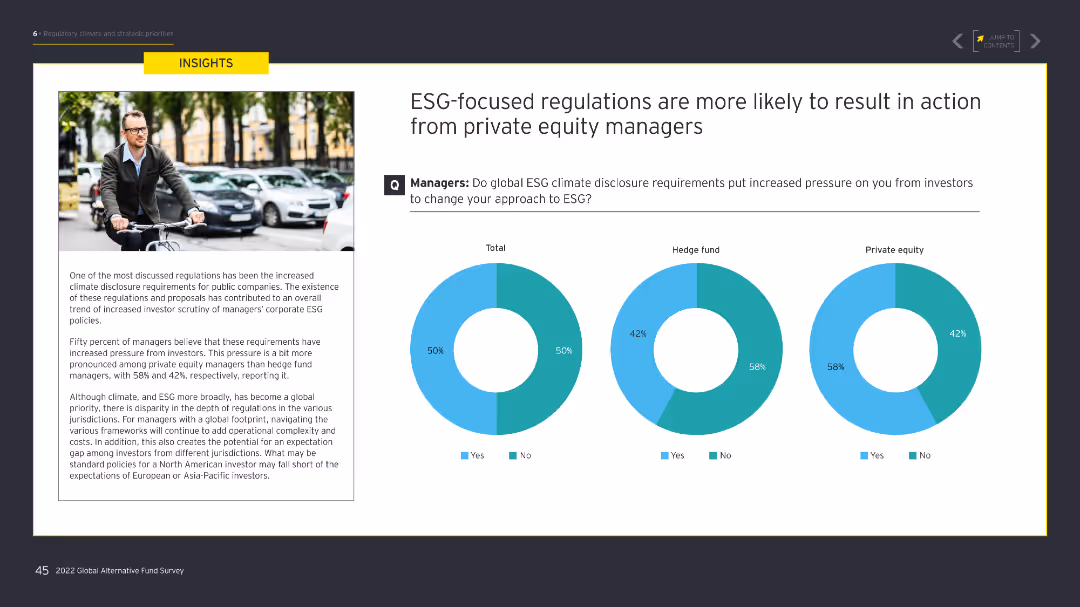
Features three pie charts showing responses from total managers, hedge funds, and private equity managers about ESG climate disclosure requirements. The slide also includes a large image on the left.
Regulatory and Compliance
Financial Services
The slide presents survey data on how ESG-focused regulations influence private equity managers compared to hedge fund managers, emphasizing the increased pressure from investors to change ESG approaches.
ESG, private equity, hedge funds, regulations, climate
false
Regulatory and Compliance
Financial Services financial-services
Multiple Chart
EY
View slide
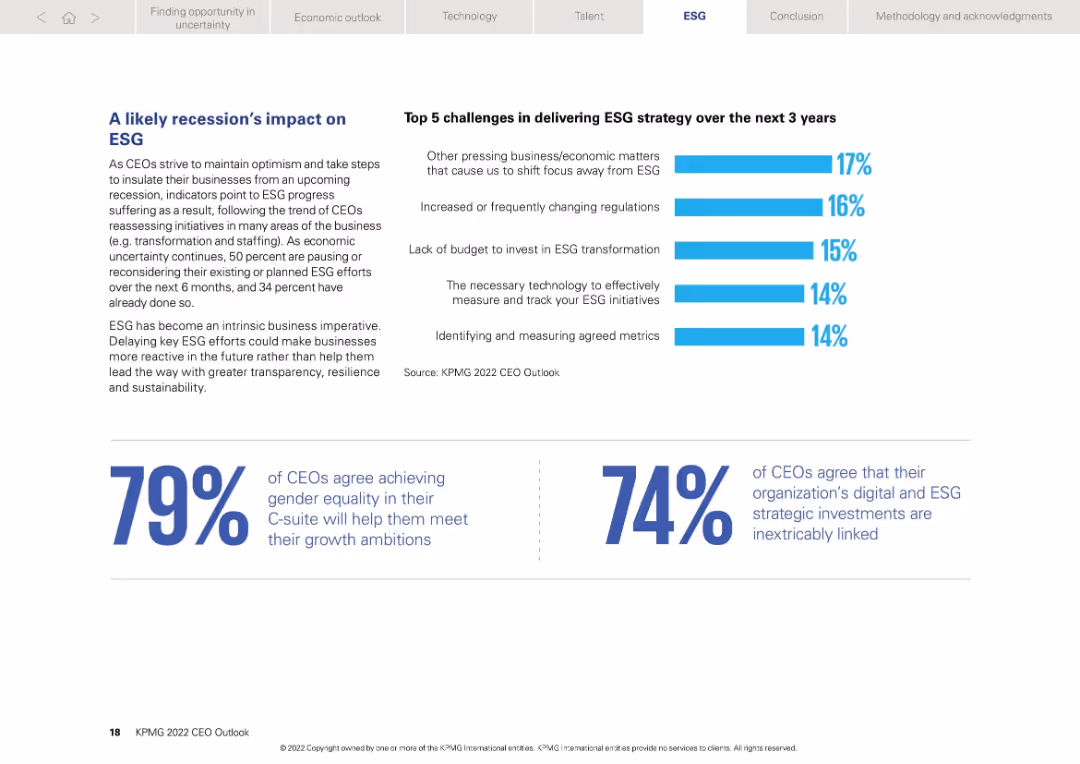
Two-column format with text on left and bar chart on right. Large percentage callouts at bottom.
Strategic Planning
Professional Services
Discusses how looming recession risks are causing CEOs to pause or reconsider ESG efforts. Lists top five ESG challenges for the next 3 years and highlights CEO sentiments on gender equity and ESG-tech alignment.
ESG, recession, challenges, budget, metrics, gender equity, KPMG
false
Strategic Planning
Professional Services professional-services
Mixed Chart
KPMG
View slide
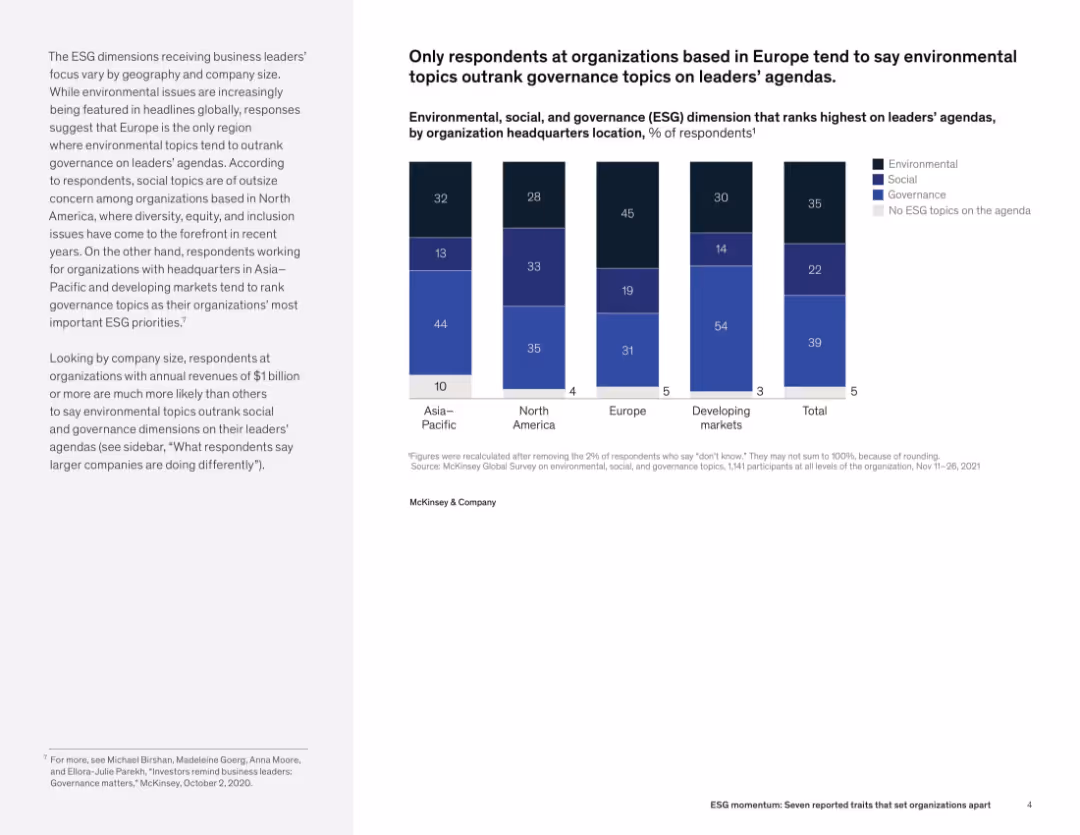
Text and vertical stacked bar chart showing ESG topic prioritization by global region. Regions include Asia–Pacific, North America, Europe, and developing markets.
Strategic Planning
Professional Services
This slide shows regional variations in prioritization of ESG dimensions. Europe leads with environmental concerns topping the agenda, while North America emphasizes social topics. Developing markets and Asia–Pacific show stronger preferences for governance.
ESG, regional comparison, governance, environmental topics, organizational agenda, sustainability, leadership focus
false
Strategic Planning
Professional Services professional-services
Mixed Chart
McKinsey
View slide
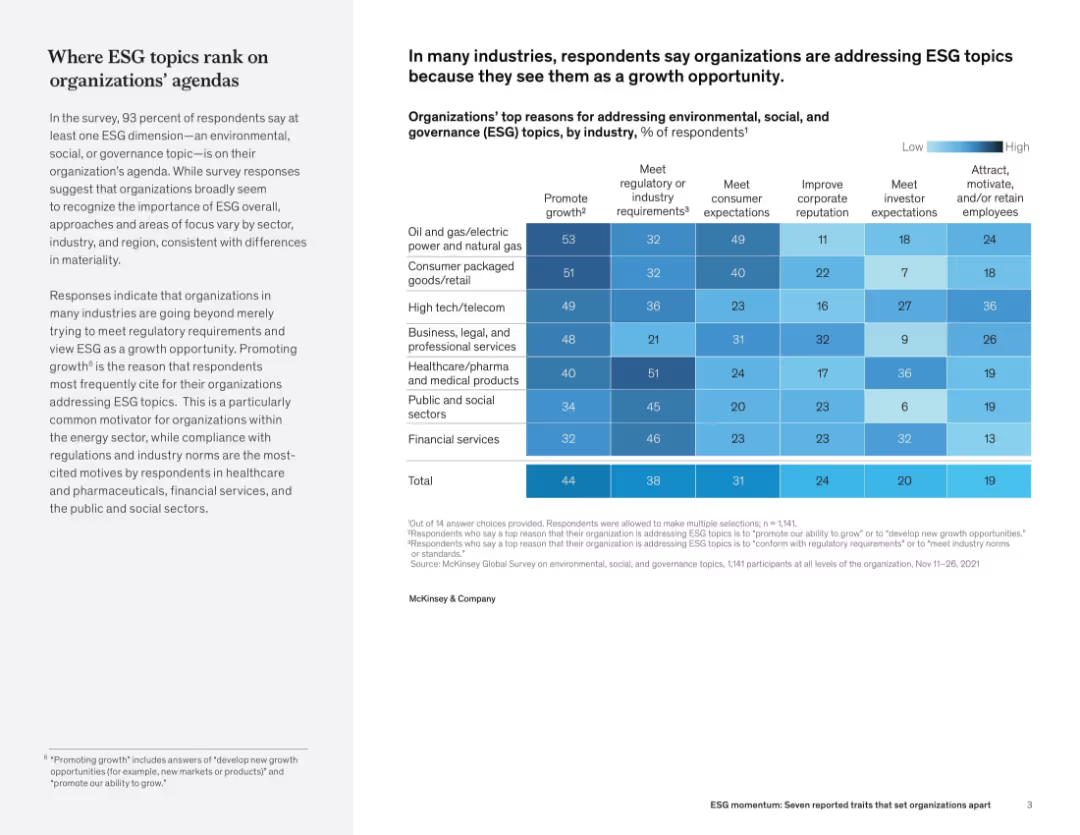
Split layout with narrative on the left and a heatmap chart on the right showing percentages of organizations addressing ESG topics by industry and reason.
Regulatory and Compliance
Professional Services
The slide details how different industries prioritize ESG issues and their reasons—primarily to promote growth or meet regulatory demands. The chart breaks down ESG motivations (e.g., compliance, reputation, employee retention) across multiple sectors, showing strong emphasis in energy, healthcare, and public services.
ESG, regulation, industry comparison, sustainability, corporate responsibility, survey data, public sector, compliance
false
Regulatory and Compliance
Professional Services professional-services
Mixed Chart
McKinsey
View slide
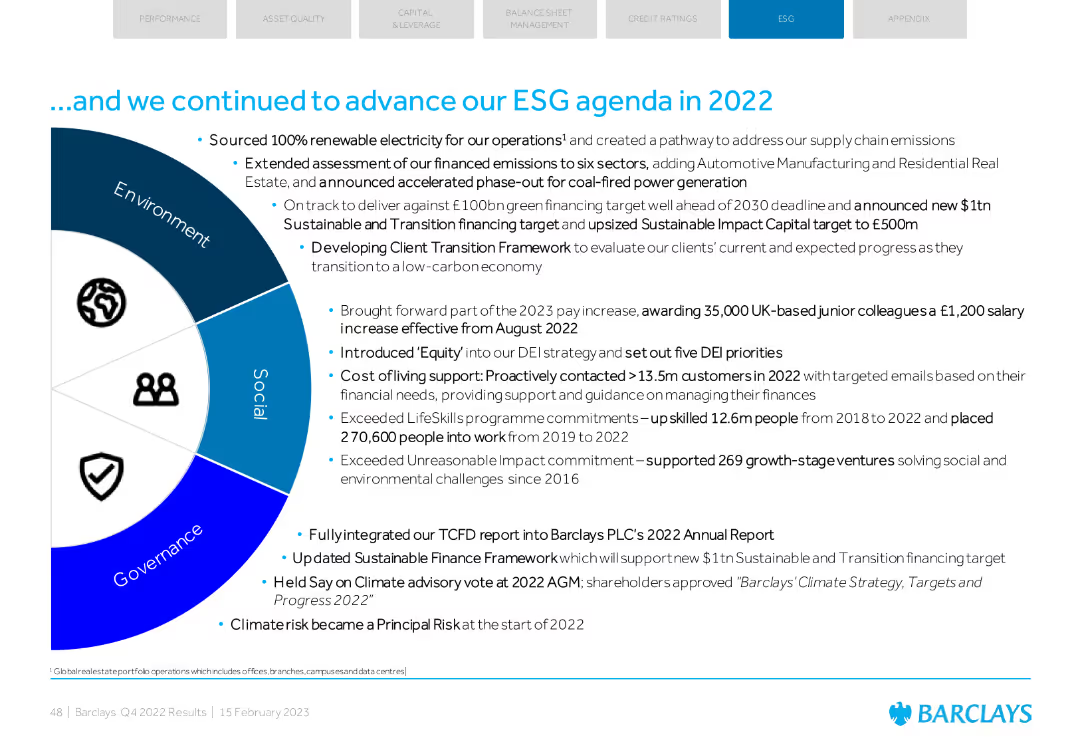
A mix of text and an infographic wheel illustrating ESG progress across Environment, Social, and Governance.
Regulatory and Compliance
Financial Services
Summarizes Barclays' ESG advancements in 2022, including renewable energy sourcing, DEI initiatives, and support for social and environmental ventures.
ESG, renewable energy, DEI, social impact, governance
false
Regulatory and Compliance
Financial Services financial-services
Diagram
Barclays
View slide
The slide features two column charts showing the value that ESG projects bring to companies over time, comparing increased revenue and brand credibility across different time spans (less than 1 year, 2-5 years, 5-10 years, and 10+ years).
Market Analysis and Trends
Environmental Services & Sustainability
This slide emphasizes the long-term financial benefits of ESG initiatives, showing how companies with mature ESG programs see increased revenue and brand credibility over various time periods. It highlights the importance of sustained ESG efforts for long-term gains.
ESG, revenue, brand, long-term, benefits
false
Market Analysis and Trends
Environmental Services & Sustainability environmental-services-and-sustainability
Multiple Chart
Kearney
View slide
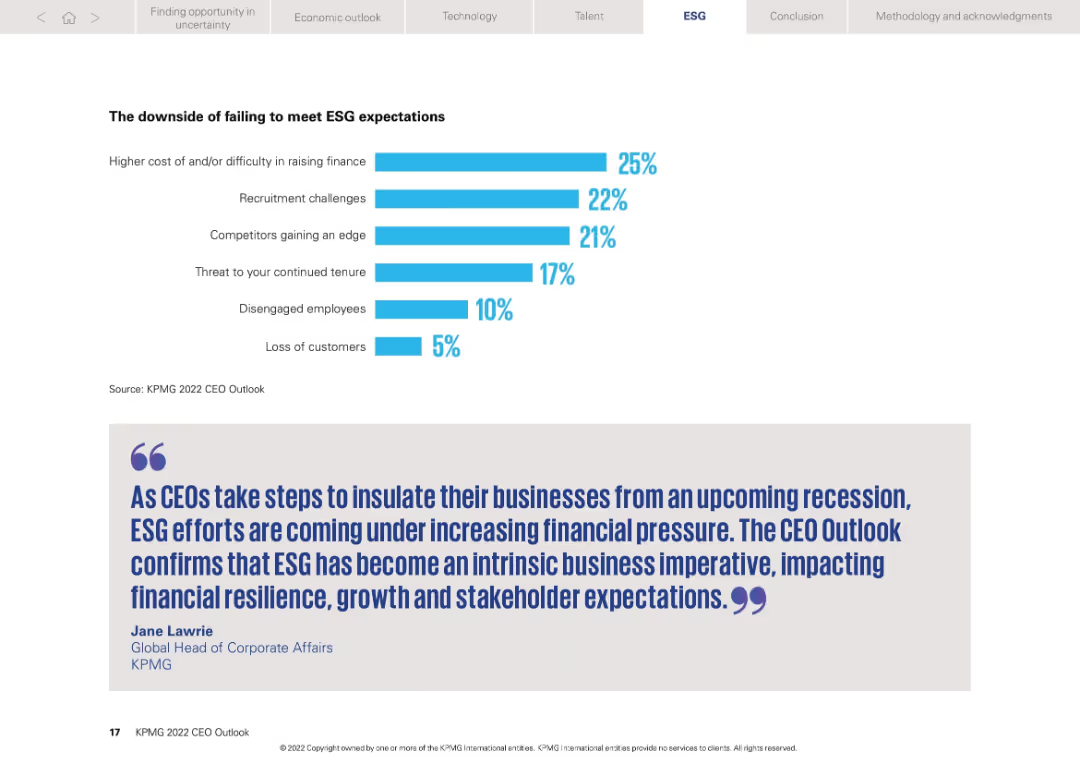
Clean, minimalist layout with horizontal bar chart and quote section. Blue theme with bold fonts.
Risk Assessment and Management
Professional Services
This slide outlines the business risks associated with failing to meet ESG expectations, such as difficulty in financing, recruitment issues, and disengaged employees. A quote emphasizes ESG as a core business imperative linked to resilience and stakeholder expectations.
ESG, risk, recruitment, finance, disengagement, stakeholder, KPMG, quote
false
Risk Assessment and Management
Professional Services professional-services
Mixed Chart
KPMG
View slide
The slide includes a pie chart and column charts, with text describing the evolution of ESG awareness.
Regulatory and Compliance
Environmental Services & Sustainability
This slide discusses how organizations are evolving in their focus on ESG risks, with statistics and survey results.
ESG, risks, evolution, awareness, survey
false
Regulatory and Compliance
Environmental Services & Sustainability environmental-services-and-sustainability
Single Chart
Deloitte
View slide
The slide contains a column chart showing different ESG structures investors plan to invest in. The left side features an image of professionals working outdoors.
Market Analysis and Trends
Financial Services
Details how investors are gaining exposure to socially responsible products, including various ESG structures and investment plans, highlighting different fund types.
ESG, socially responsible, investment, products, fund managers, investors, structures, analysis, outdoor professionals
false
Market Analysis and Trends
Financial Services financial-services
Mixed Chart
EY
View slide
Features a central circular diagram with arrows pointing to related components, emphasizing integration of ESG strategies with corporate strategy.
Strategic Planning
Financial Services
Focuses on the integration of ESG strategies with corporate strategies, discussing material topics, ESG opportunities, and vision alignment.
ESG, strategy, corporate strategy, integration, material topics, opportunities, vision
false
Strategic Planning
Financial Services financial-services
Framework
PwC/Strategy&
View slide
A content slide with graphical elements such as icons representing "EMPLOYER DIVERSE TALENT," "MAKE INNOVATION ACCESSIBLE TO ALL," and "DRIVE COMMUNITY RESILIENCE." Green and yellow color theme with text sections and labeled graphics.
Strategic Planning
Professional Services
Slide detailing a company's ESG strategy including internal and external drivers with three main pillars aimed at securing a resilient and equitable future.
ESG, strategy, diversity, innovation, resilience, governance, sustainability
false
Strategic Planning
Professional Services professional-services
Pillar
Booz Allen Hamilton
View slide
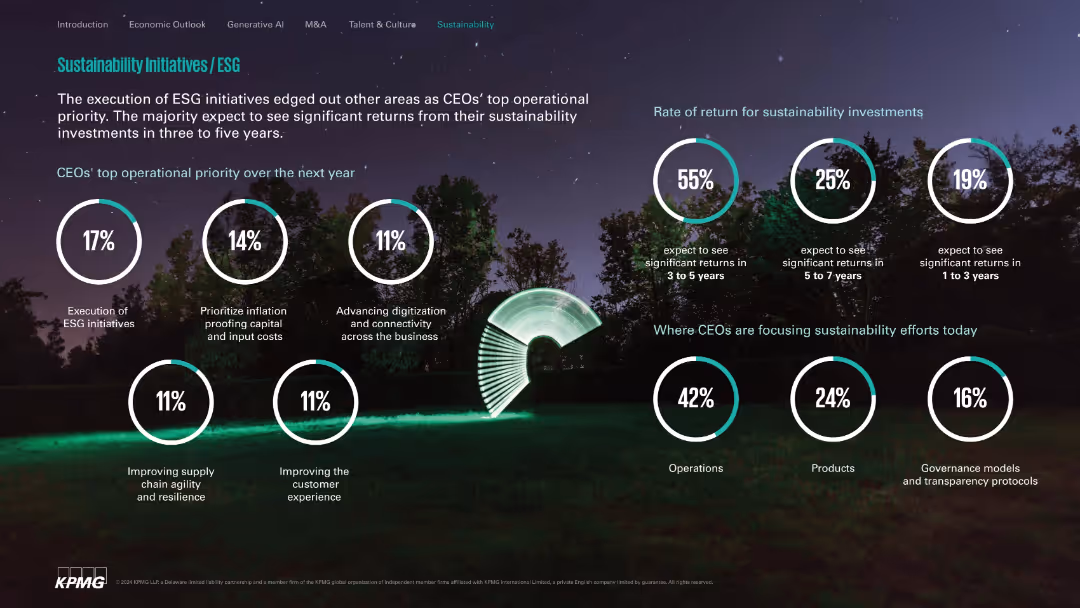
Nature-themed background with white circle stats; clean and segmented layout.
Customer and Market Segmentation
Environmental Services & Sustainability
Highlights ESG execution as a top CEO priority, expected investment return timelines, and primary focus areas like operations, products, and governance. Communicates optimism on sustainability ROI within 3–5 years.
ESG, sustainability, ROI, operations, governance, digital transformation
false
Customer and Market Segmentation
Environmental Services & Sustainability environmental-services-and-sustainability
Single Chart
KPMG
View slide
A graph slide with a bar chart showing the levels of concern across different sectors for ESG dimensions. The slide is divided into three sections with color-coded bars corresponding to environment, social, and governance concerns.
Risk Assessment and Management
Technology & Software
Analyzes ESG concerns in SEA's core digital economy sectors, highlighting the higher levels of concern in areas like e-commerce, transport, and gaming.
ESG, sustainability, SEA, digital economy, concerns, environment, social, governance, sectors
false
Risk Assessment and Management
Technology & Software technology-and-software
Table
Bain
View slide
Two column charts showing ESG ratings and risk, with a blue color theme. Accompanied by a list of awards on the right side, contrasting against a white background.
Regulatory and Compliance
Financial Services
Showcases the company’s ESG ratings and recognitions to convey commitment to sustainable and ethical operations, likely used in reports or presentations to highlight achievements and market position in terms of responsibility.
ESG, sustainability, awards, ethical operations, market position
false
Regulatory and Compliance
Financial Services financial-services
Multiple Chart
Goldman Sachs
View slide
The slide features three charts: a pie chart of climate commitments of sustainability leaders, a column chart of ESG bonds issued, and a table showing the share of companies meeting climate recommendations. The layout is clean and uses a blue and white color scheme with clear labels and legends.
Strategic Planning
Environmental Services & Sustainability
The slide discusses the value of comprehensive approaches to sustainability, supported by data on climate commitments of sustainability leaders, ESG bond issuance, and the share of companies meeting climate recommendations across different sectors.
ESG, sustainability, climate commitments, ESG bonds, corporate climate
false
Strategic Planning
Environmental Services & Sustainability environmental-services-and-sustainability
Multiple Chart
EY
View slide
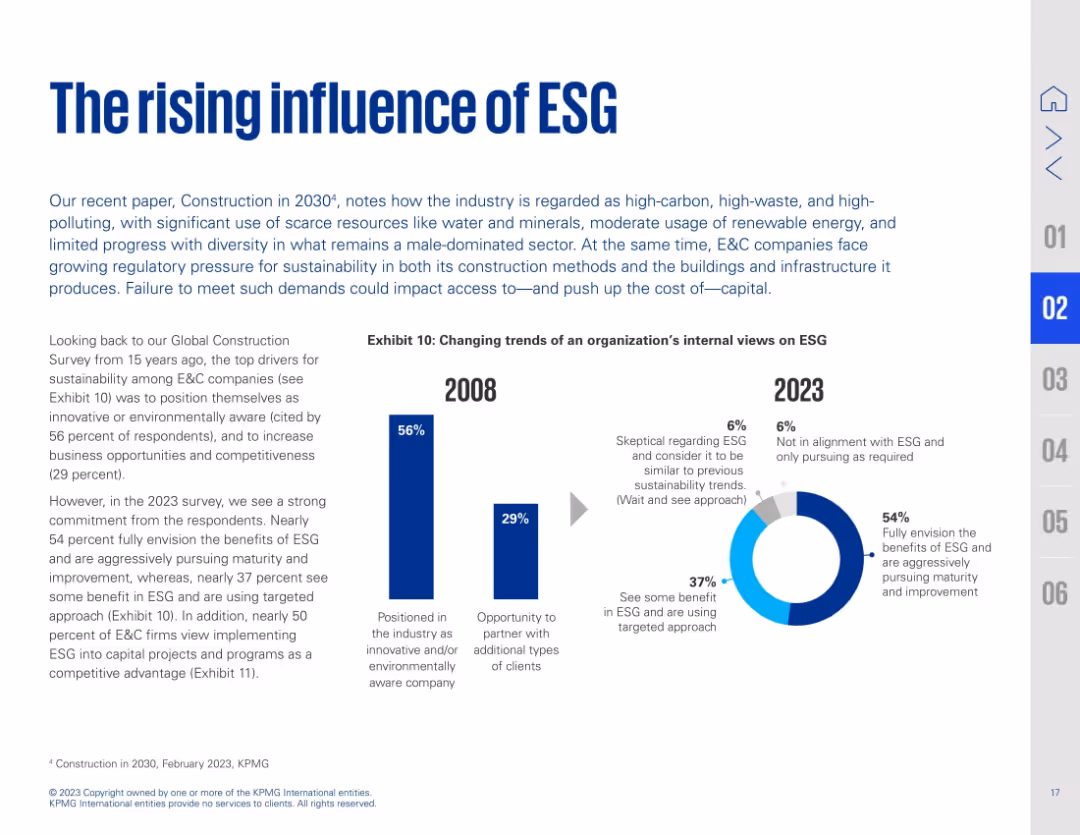
Text on left with a bold title and subtitle; right side features side-by-side bar and donut charts showing ESG perception shifts from 2008 to 2023. Blue accents highlight key data.
Strategic Planning
Real Estate & Construction
This slide presents the growing importance of ESG in construction. It compares ESG sentiment from 2008 to 2023, noting a shift from surface-level awareness to full integration. 54% now fully embrace ESG's value, with significant increases in those pursuing ESG maturity. The industry recognizes ESG as both a strategic and compliance priority.
ESG, sustainability, construction, awareness, maturity, climate, corporate strategy, environmental policy
false
Strategic Planning
Real Estate & Construction real-estate-and-construction
Multiple Chart
KPMG
View slide
The slide contains three sections with icons (Environmental, Social, Governance), multiple bullet points, and images symbolizing growth, teamwork, and governance.
Regulatory and Compliance
Transportation & Logistics
Discusses environmental and social initiatives and corporate governance, highlighting efforts in fleet efficiency, compliance, and corporate transparency.
ESG, sustainability, corporate governance, fleet efficiency, compliance, transparency, environmental initiatives, social responsibility
false
Regulatory and Compliance
Transportation & Logistics transportation-and-logistics
Header Vertical
Deutsche Bank
View slide
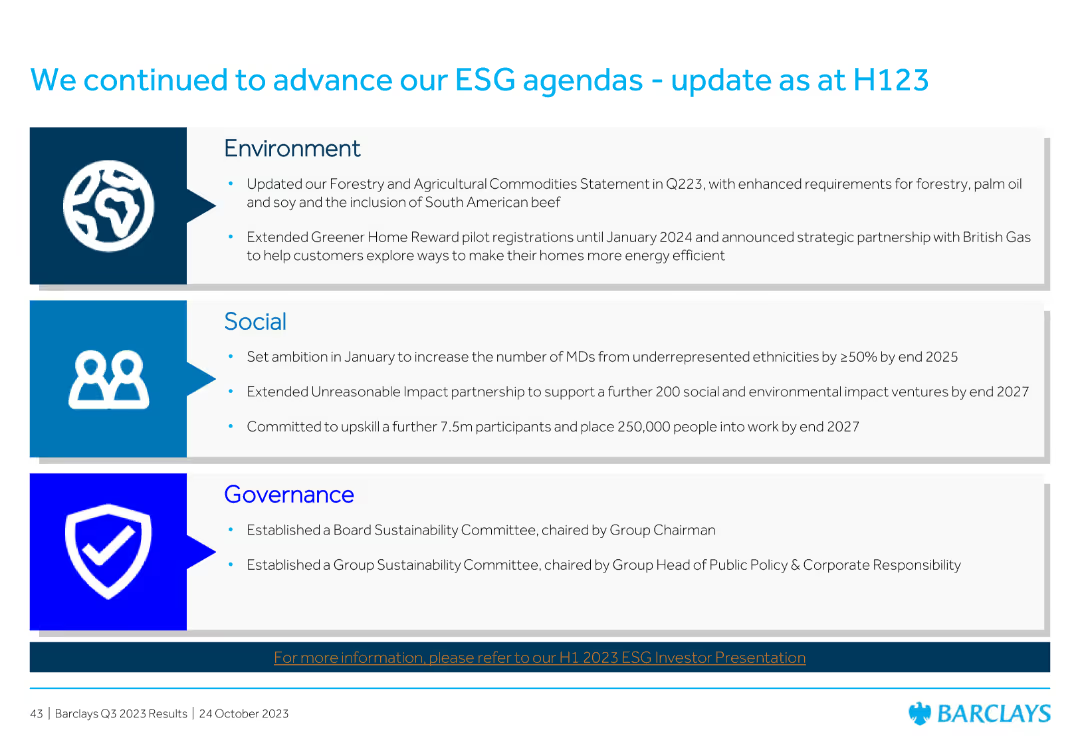
Divided into three sections: Environment, Social, and Governance, each with bullet points summarizing recent initiatives and achievements.
Market Analysis and Trends
Financial Services
Summarizes Barclays' progress on its ESG (Environmental, Social, and Governance) agendas as of H123, detailing initiatives in each area to enhance sustainability and social impact.
ESG, sustainability, environment, social, governance, Barclays, initiatives, H123, progress
false
Market Analysis and Trends
Financial Services financial-services
Header Vertical
Barclays
View slide
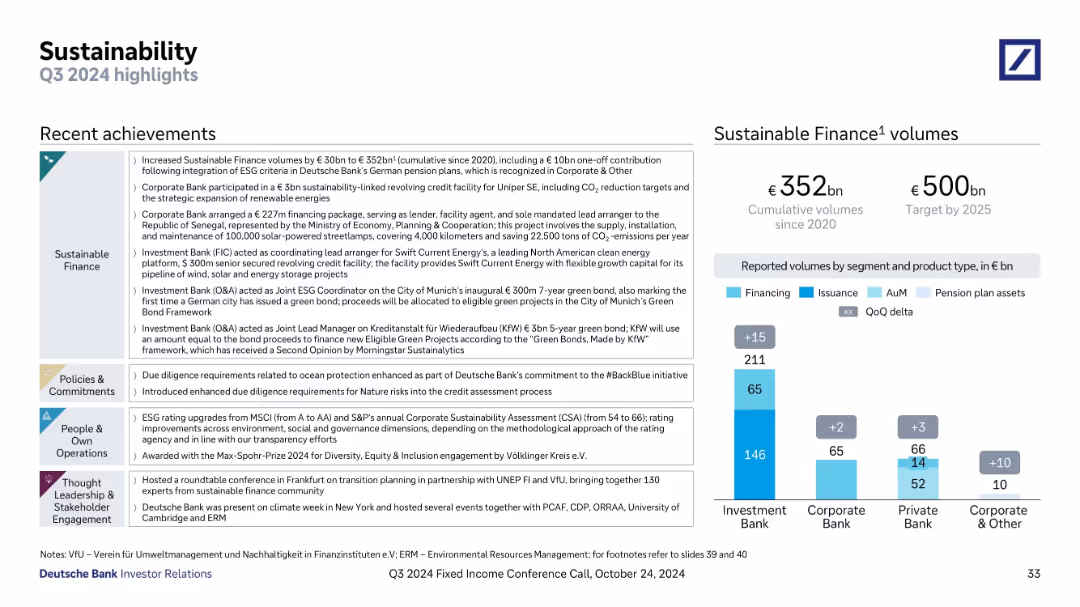
Left: bullet-based achievements by theme (Finance, Commitments, Operations, Thought Leadership); Right: vertical bar chart with segment breakdown
Strategic Planning
Financial Services
Highlights Deutsche Bank’s Q3 2024 sustainability efforts, with updates on green financing, ESG initiatives, and policy changes. Shows cumulative sustainable finance volumes and targets by 2025, segmented by business unit and type.
ESG, sustainability, green bonds, sustainable finance, corporate responsibility, Q3 2024, Deutsche Bank, investment banking
false
Strategic Planning
Financial Services financial-services
Mixed Chart
Deutsche Bank
View slide
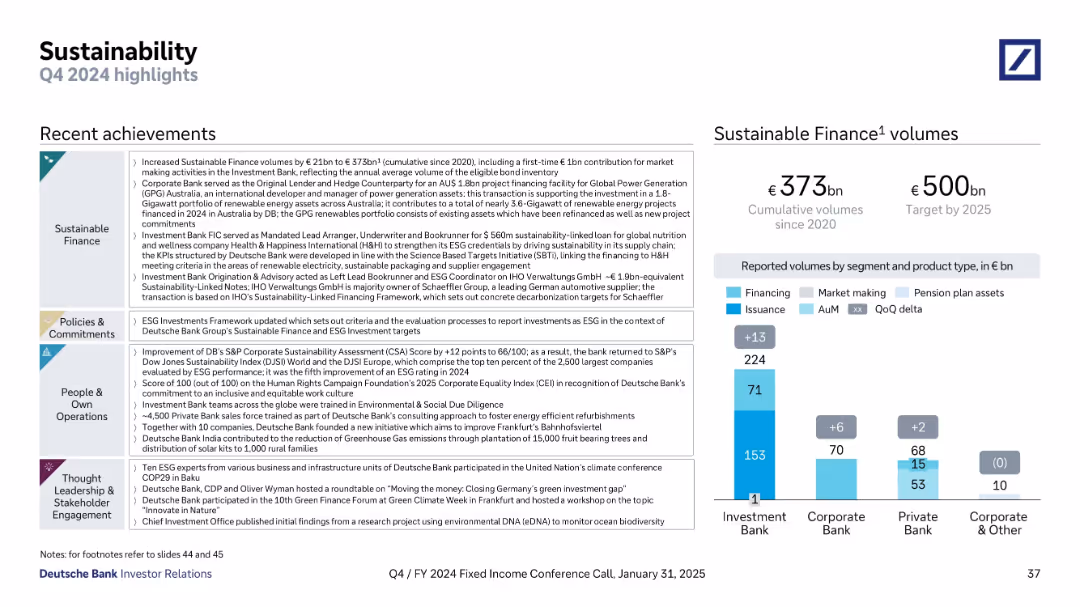
Left side lists sustainability achievements across finance, operations, and policy; right shows cumulative volumes by segment toward €500bn 2025 target.
Regulatory and Compliance
Financial Services
Highlights Q4 2024 ESG milestones, including €373bn in sustainable finance volumes and strategic deals in Australia and ESG-linked bonds. Notes corporate ESG frameworks, internal initiatives, and 2025 target of €500bn.
ESG, sustainability, green finance, investment, compliance, 2025 targets
false
Regulatory and Compliance
Financial Services financial-services
Mixed Chart
Deutsche Bank
View slide
The slide contains pie charts, bar charts, and text sections. The left side emphasizes the focus on corporate sustainability goals with a quote and statistics.
Strategic Planning
Energy & Utilities
It discusses the role of procurement leaders in corporate sustainability, metrics to measure impact, and commitment levels. It is used for showcasing sustainability.
ESG, sustainability, procurement, corporate goals, impact, commitments, metrics
false
Strategic Planning
Energy & Utilities energy-and-utilities
Mixed Chart
Kearney
View slide
The slide contains pie charts, bar charts, and text sections. The left side emphasizes the focus on corporate sustainability goals with a quote and statistics.
Strategic Planning
Energy & Utilities
It discusses the role of procurement leaders in corporate sustainability, metrics to measure impact, and commitment levels. It is used for showcasing sustainability.
ESG, sustainability, procurement, corporate goals, impact, commitments, metrics
false
Strategic Planning
Energy & Utilities energy-and-utilities
Multiple Chart
Kearney
View slide
This Data-Driven Slide presents Michelin’s ratings from various ESG agencies, along with distribution graphs showing the market average performance and Michelin's standing. The visual elements, including the column charts, rating icons, and color-coded tables, create a data-rich yet clear and structured presentation. It demonstrates Michelin’s strong ESG performance in an impactful and visually effective manner.
Corporate Finance and Valuation
Industrial & Manufacturing
The slide highlights Michelin’s exemplary ESG ratings, showcasing their strong performance in non-financial aspects like sustainability, compared to industry and global averages. It demonstrates their leadership and commitment to environmental and social governance, aligning with investors' and consumers' increasing focus on corporate responsibility.
ESG, sustainability, ratings, performance, Michelin, industry average, leadership, non-financial
false
Corporate Finance and Valuation
Industrial & Manufacturing industrial-and-manufacturing
Multiple Chart
Morgan Stanley
View slide
Image of an icy landscape. Column chart showing how organizations incorporate ESG factors and sustainability risk into risk management agendas.
Risk Assessment and Management
Environmental Services & Sustainability
This slide discusses the integration of ESG and sustainability risks into risk management frameworks. It covers various approaches, including incorporating these risks into business strategies and monitoring potential ESG-related reputation risks. It highlights the importance of aligning risk management with ESG principles.
ESG, sustainability, risk management, business strategy, reputation risks
false
Risk Assessment and Management
Environmental Services & Sustainability environmental-services-and-sustainability
Multiple Chart
EY
Previous
Loading...
Hold On!
We are searching in our database
If nothing, comes up, please try different filters!
Column Chart
Heatmap
Chevron
Org Chart
Infographic
Callouts
Timeline
List
Graphic
Picture
Process Flow
Diagram
Paragraph
Map
Table
Framework
Subtitle
Takeaway Box
Icon
Other Chart
Radar Chart
Waterfall Chart
Mekko Chart
Pie Chart
Scatter Plot
Line Chart
Bar chart
Bullet points
Create a FREE account to continue browsing
Receive Instant Access to 1,000+ slides from companies like McKinsey, Google, and Goldman Sachs
First Name
Last Name
Email
Password
I agree to all
Terms & Privacy Policy
Thank you! Your submission has been received!
Oops! Something went wrong while submitting the form.
Have an account?
Sign in
Upgrade to PRO to Save slides
Advanced Search and Filters
Access to 15,000+ slides
Access to Category Pages
Save/Bookmark Slides
PowerPoint Template Library
Pick a Plan
MONTHLY
$12/month
Billed every month, Cancel anytime.
YEARLY
$9/year
Billed $108 annually, Cancel anytime.
Checkout for $12/month
Checkout for $108/yr
Secured by Stripe | AES-256 bit encryption