My Account
My Slides
Search by Category
Templates
View All Templates
Download Template Slides
Leave Feedback
Login
Logout
Get Started
Browse all Slides
Browse all Slides
Create a FREE Account
Instant access to 1,000+ real slides from top companies like McKinsey, BCG, Goldman Sachs, Google and many more!
First Name
Last Name
Email
Password
I agree to all
Terms & Privacy Policy
Thank you! Your submission has been received!
Oops! Something went wrong while submitting the form.
Have an account?
Sign in
Instant access to the internet's best slides
Get access to 40+ advanced filters and more
Advanced Search and Filters
Access to
10,000+ slides
Access to Category Pages
Save/Bookmark Slides
PowerPoint Template Library (New)
Choose your plan
MONTHLY
$12/month
Billed every month, cancel anytime.
YEARLY
$9/month
Billed $108 annually, cancel anytime.
Checkout for $12/month
Checkout for $108/yr
Secured by Stripe | AES-256 bit encryption
Spark Your Next Big Idea with New Presentation Templates
VIEW ALL Templates
Welcome,
Welcome
Upgrade to SlideStart
Pro
Instant access to 15,000+ slides
Show Featured Only
Checkbox 8
Companies
Mckinsey
Bain
BCG
EY
Deloitte
Accenture
PwC/Strategy&
JP Morgan
Goldman Sachs
Morgan Stanley
Citigroup
Deutsche Bank
Barclays
LEK
Kearney
Oliver Wyman
Booz Allen Hamilton
Gartner
IPSOS
Nielsen
Slide type
Header Horizontal
Framework
Vertical Flow
Single Chart
Single Chart
Text Only
Mixed Chart
Header Vertical
Graphic
Pillar
Multiple Chart
Agenda
Title
Table
Linear Flow
Upgrade to SlideStart
Pro
Instant access to 40+ advanced filters
Industry
Upgrade to SlideStart
Pro
Instant access to 40+ advanced filters
Technology
Healthcare
Financial Services
Consumer Goods
Energy & Utilities
Manufacturing
Retail
E-commerce
Logistics
Telecommunications
Real Estate
Professional Services
Education
Media
Entertainment
Hospitatlity
Tourism
Agriculture
Food Production
Government & Public Sector
Environmental
Sustainability
Use Case
Upgrade to SlideStart
Pro
Instant access to 40+ advanced filters
Sales and Business Development
Mergers and Acquisitions
Corporate Finance and Valuation
Performance Metrics and KPIs
Client Case Studies
Competitive Landscape
Product and Service Analysis
Customer and Market Segmentation
Organizational Structure
Human Resources and Talent Management
Industry Overview
Regulatory and Compliance
Risk Assessment and Management
Agriculture & Food Production
Hospitality and Tourism
Government
Environmental
Sustainability
Clear all
Thank you! Your submission has been received!
Oops! Something went wrong while submitting the form.
Show Featured Only
Checkbox 8
Companies
Mckinsey
Bain
BCG
EY
Deloitte
Accenture
PwC/Strategy&
JP Morgan
Goldman Sachs
Morgan Stanley
Citigroup
Deutsche Bank
Barclays
LEK
Kearney
Oliver Wyman
Booz Allen Hamilton
Gartner
IPSOS
Nielsen
Slide type
Text Only
Linear Flow
Vertical Flow
Single Chart
Header Horizontal
Mixed Chart
Header Vertical
Pillar
Multiple Chart
Graphic
Agenda
Title
Table
Framework
Industry
Technology
Healthcare
Financial Services
Consumer Goods
Energy & Utilities
Manufacturing
Retail
E-commerce
Logistics
Telecommunications
Real Estate
Professional Services
Education
Media
Entertainment
Hospitatlity
Tourism
Agriculture
Food Production
Government & Public Sector
Environmental
Sustainability
Use Case
Sales and Business Development
Mergers and Acquisitions
Corporate Finance and Valuation
Performance Metrics and KPIs
Client Case Studies
Competitive Landscape
Product and Service Analysis
Customer and Market Segmentation
Organizational Structure
Human Resources and Talent Management
Industry Overview
Regulatory and Compliance
Risk Assessment and Management
Agriculture & Food Production
Hospitality and Tourism
Government
Environmental
Sustainability
Clear all
Thank you! Your submission has been received!
Oops! Something went wrong while submitting the form.
Tag
View slide
Slide includes multiple pie charts illustrating daily usage rates for various digital devices, and a photograph of a man using a smartwatch.
Market Analysis and Trends
Telecommunications
Discusses the varying daily usage rates of digital devices, from smartphones to VR headsets, highlighting the multifunctionality of smartphones.
digital devices, usage rates, smartphone, smartwatch, VR headset
false
Usage rates of digital devices varies massivelyDigital Consumer Trends 2023
Mixed Chart
Deloitte
View slide
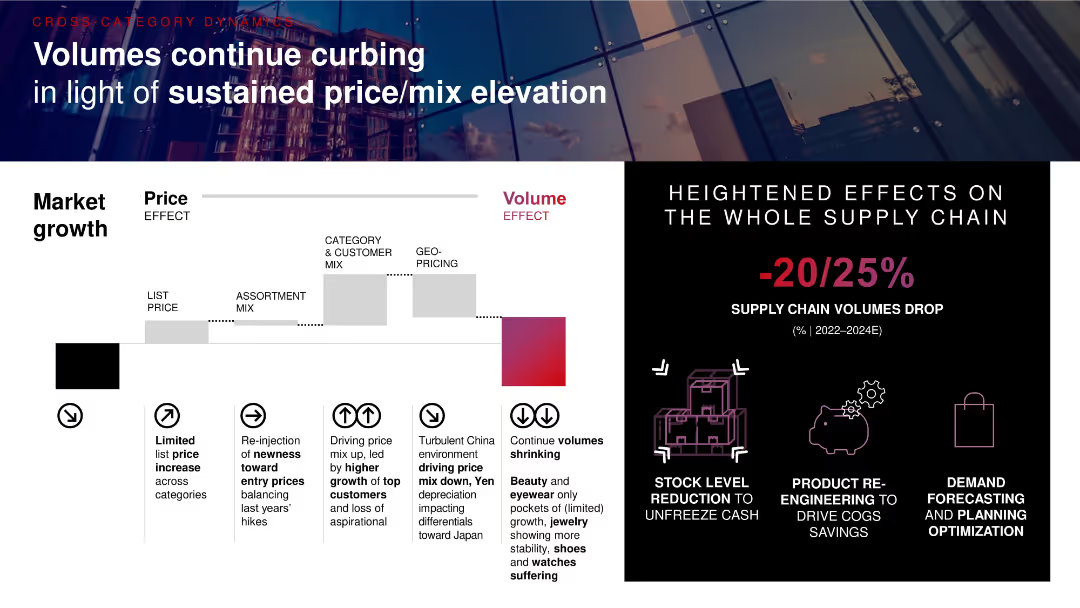
Waterfall chart illustrating price vs. volume effects on growth; callout boxes summarize drivers and impacts; right panel shows supply chain effects and visual icons.
Strategic Planning
Consumer Goods
Volume contraction is impacting luxury markets despite sustained price/mix elevation. Factors include limited price hikes, shifts in assortment and geographic pricing, and supply chain adjustments, with volume drops projected at 20–25% through 2024.
volume drop, pricing strategy, mix effect, supply chain, market growth, COGS savings
false
Volumes continue curbing in light of sustained price/mix elevationGood times for a change
Mixed Chart
Bain
View slide
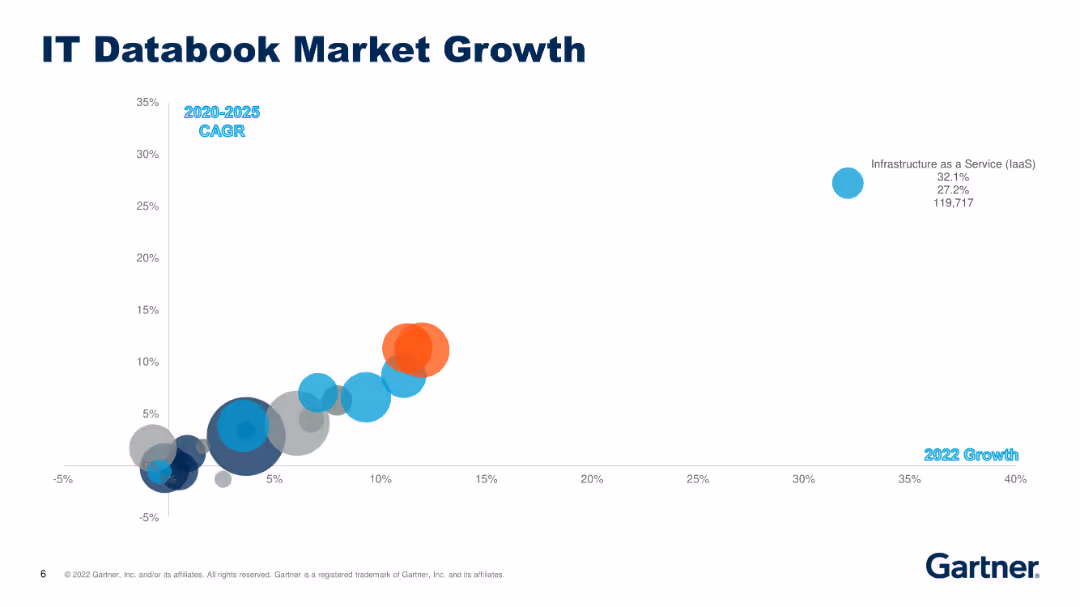
The slide includes a scatter plot showing IT market growth across various segments, highlighting growth rates and compound annual growth rates (CAGR) for different IT services and products from 2020 to 2025.
Market Analysis and Trends
Technology & Software
The slide presents a detailed analysis of market growth in the IT sector, highlighting segments like infrastructure as a service (IaaS), enterprise application software, and consulting with projected CAGR.
IT market, growth, CAGR, 2020-2025, segments, services, products, infrastructure, enterprise, consulting
false
IT Databook Market Growth Infrastructure as a Service (IaaS)Gartner delivers actionable, objective insight, guidance and tools to enable stronger performance on your organization’s mission critical priorities
Single Chart
Gartner
View slide
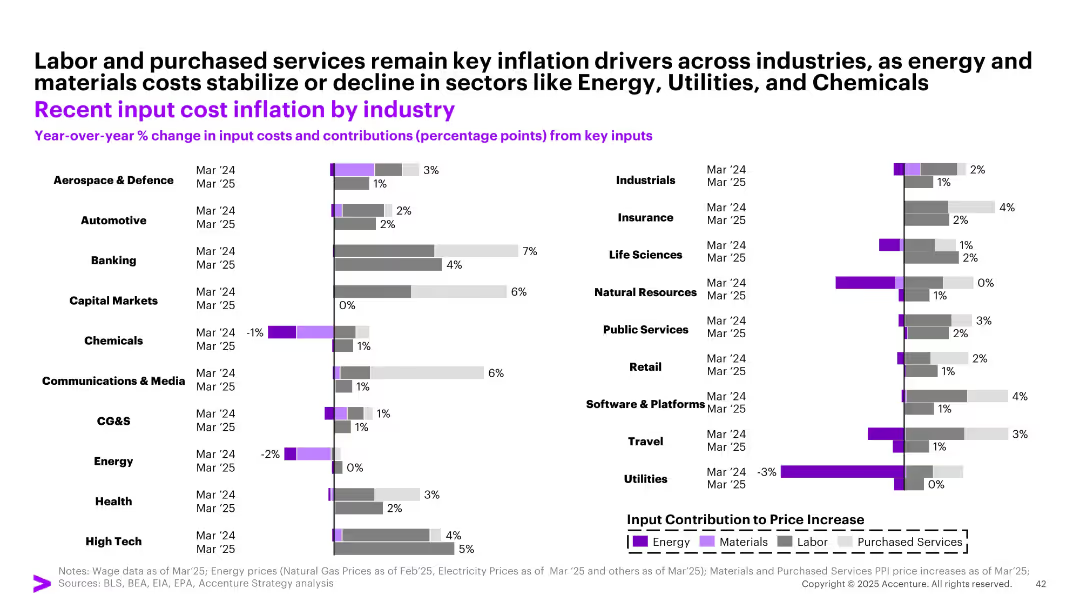
Horizontal bar chart segmented by industry and key cost drivers (Energy, Materials, Labor, Services); two bars per industry (Mar ‘24/’25)
Operational Efficiency
Industrial & Manufacturing
The slide details year-over-year changes in input costs for different industries as of March 2024 and March 2025. Key inflation drivers such as labor and purchased services remain dominant, while energy and materials costs have declined in sectors like Utilities, Chemicals, and Energy.
input costs, inflation, labor, services, industries, 2025, chemicals, utilities, manufacturing
false
Labor and purchased services remain key inflation drivers across industries, as energy and materials costs stabilize or decline in sectors like Energy, Utilities, and ChemicalsMay Macro Brief Consumer spending in flux
Single Chart
Accenture
View slide
The slide shows a bar chart comparing the top 5 services consumers use or want in an EV app across different regions (APAC, EMEA, North America). Icons and colors differentiate services.
Strategic Planning
Transportation & Logistics
The slide presents the results of a survey on the most desired features in EV apps, illustrating regional differences in consumer preferences. It aims to guide EV app development strategies.
EV apps, consumer preferences, regional analysis, digital tools, survey results
false
OEM car apps are seen as a useful tool to manage the car lifecycle, schedule a service appointment and manage an EV remotely4th edition eReadiness 2023
Mixed Chart
PwC/Strategy&
View slide
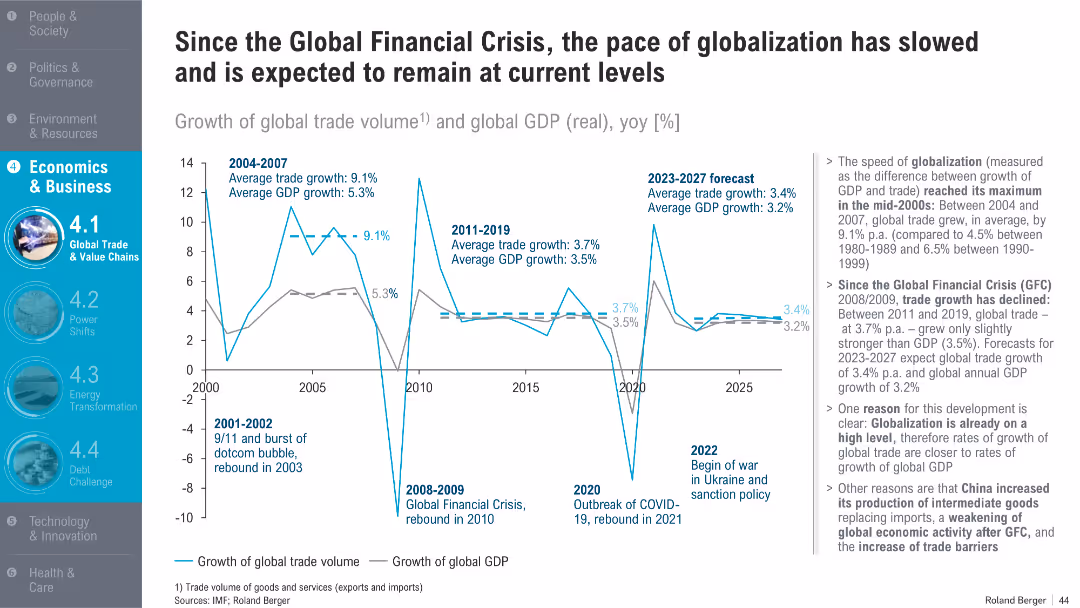
Dual-line graph of trade volume and GDP growth from 2000–2025 with annotated events; textual summary on the right
Market Analysis and Trends
Financial Services
This slide shows a decline in the pace of globalization since the 2008 financial crisis, with global trade growing at a slower rate than before. It attributes the trend to factors like economic maturity, trade barriers, and geopolitical tensions.
globalization, trade volume, GDP growth, financial crisis, economic trends, 2023 forecast
false
Since the Global Financial Crisis, the pace of globalization has slowed and is expected to remain at current levelsTrend Compendium 2050 Six megatrends that will shape the world
Mixed Chart
Roland Berger
View slide
Structured slide with hexagonal graphics, connecting various business operations aspects centered around commercial banking.
Operational Efficiency
Financial Services
Discusses enhancing client experience and operational excellence in commercial banking by improving onboarding, service channels, and lending processes.
Banking, operational excellence, client experience, service improvement, digital transformation, KYC
false
Relentless focus on client experience and operational excellenceCommercial Banking 2022
Framework
JP Morgan
View slide
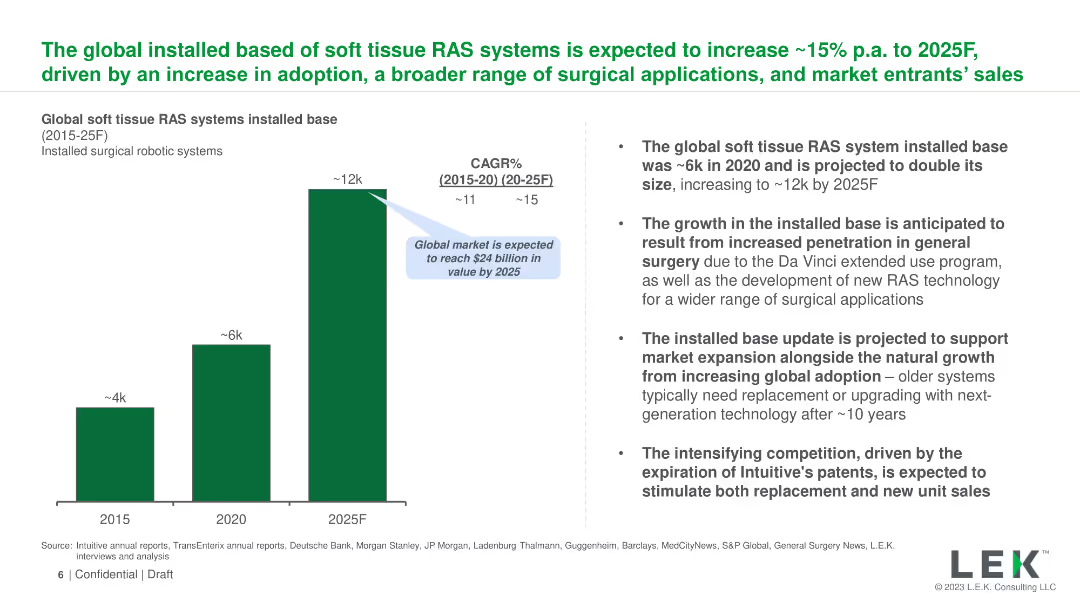
The slide uses a column chart to show the projected growth of the global installed base of soft tissue RAS systems from 2015 to 2025. Text on the right provides context and details about the projected growth, market expansion, and competitive landscape.
Market Analysis and Trends
Healthcare & Pharmaceuticals
The slide forecasts the growth of the installed base of soft tissue robotic-assisted surgery (RAS) systems globally, expecting an increase from ~6k in 2020 to ~12k by 2025. It outlines the drivers of this growth, including market expansion and technological advancements.
RAS, growth, global, installed base, soft tissue, projection, 2025, market expansion, technology, competition
false
The global installed based of soft tissue RAS systems is expected to increase ~15% p.a. to 2025F, driven by an increase in adoption, a broader range of surgical applications, and market entrants’ salesWhat is and how to navigate the RAS opportunity in LatAm?
Mixed Chart
LEK
View slide
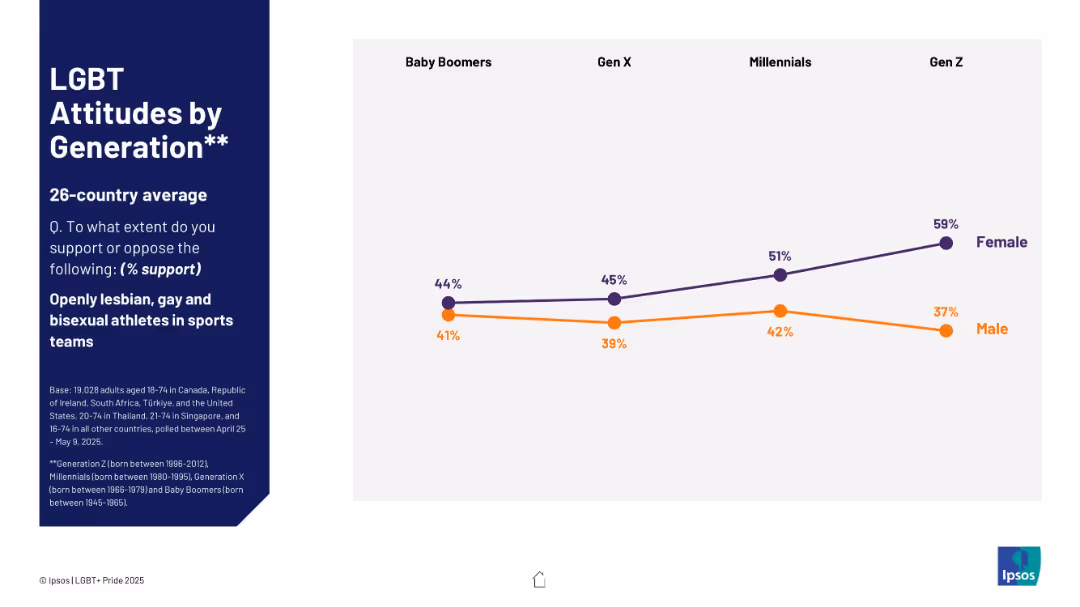
Split-screen layout; left section has text on a dark blue background; right side shows a dual-line chart.
Market Analysis and Trends
Government & Public Sector
This slide compares generational support for openly LGB athletes in sports teams across four generations. It highlights a consistent gender gap, with women showing higher support across all groups.
LGBT, generation, sports, gender, support, Baby Boomers, Gen X, Millennials, Gen Z, attitudes
false
LGBT Attitudes by GenerationIPSOS LGBT+ PRIDE REPORT 2025
Mixed Chart
IPSOS
View slide
Column chart showing the adoption of digital health solutions among public and private hospitals in SEA.
Technology and Digital Transformation
Healthcare & Pharmaceuticals
This slide details the adoption rates of digital health solutions in Southeast Asia hospitals, comparing public and private sector implementation.
Digital health, adoption, public hospitals, private hospitals, SEA
false
SEA hospitals generally exhibit a higher rate of digital solution implementation, particularly in areas related to patient administration, patient information management, and initial consultation2023 APAC Hospital Insights Survey Findings for Healthcare Providers
Multiple Chart
LEK
View slide
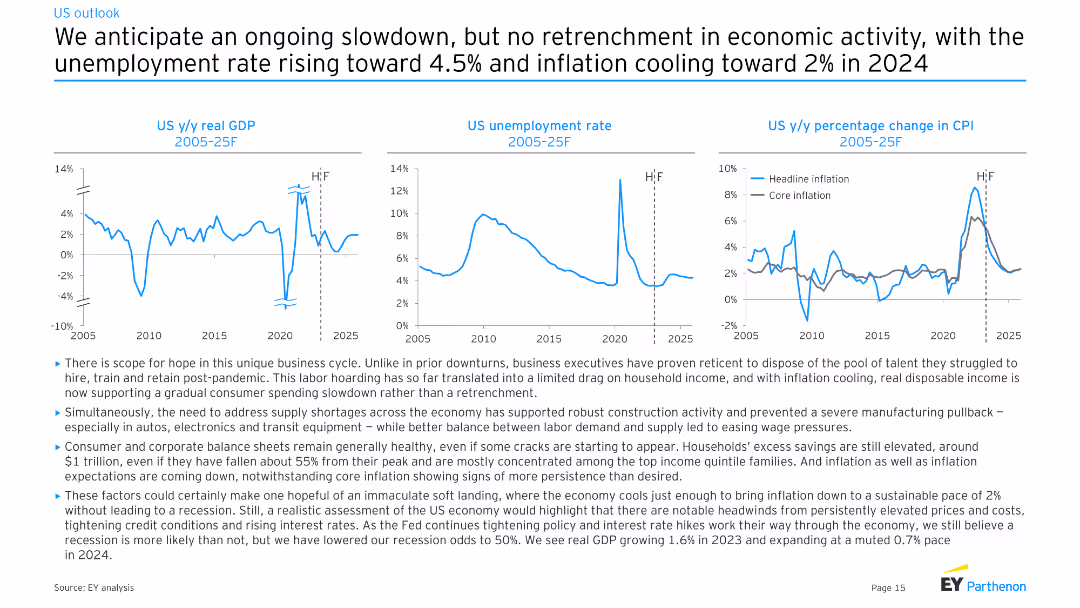
This slide includes three line charts showing US real GDP growth, unemployment rate, and percentage change in CPI from 2005 to 2025. The text box below discusses factors influencing the economic slowdown and labor market.
Market Analysis and Trends
Financial Services
The slide forecasts an economic slowdown with rising unemployment and cooling inflation in the US. It provides insights into factors like labor hoarding, consumer spending, and inflation trends, suggesting a soft landing for the economy.
Economic slowdown, GDP growth, unemployment rate, inflation trends, labor market, US economy, financial forecast, EY analysis, consumer spending
false
We anticipate an ongoing slowdown, but no retrenchment in economic activity, with the unemployment rate rising toward 4.5% and inflation cooling toward 2% in 2024Global economic outlook Macroeconomic outlook and impact on businesses
Multiple Chart
EY
View slide
The slide presents two sets of column charts. The left chart shows a slight increase in technology expenses from 2019 to 2022. The right side shows infrastructure costs remaining steady from 2015 to 2021 alongside a dramatic doubling of compute and storage volumes. Each chart includes annotations like percentage changes.
Financial Performance
Financial Services
The slide illustrates control over banking operational expenses against a backdrop of doubling technology volumes, indicating efficient resource allocation.
Banking, Expense Management, Technology Investment, Operational Efficiency, Growth, Infrastructure, Financial Services, Cost Control, Computational Volume, Scalability
false
We have held run the bank expense relatively flat, while volumes have doubledGlobal Technology
Multiple Chart
JP Morgan
View slide
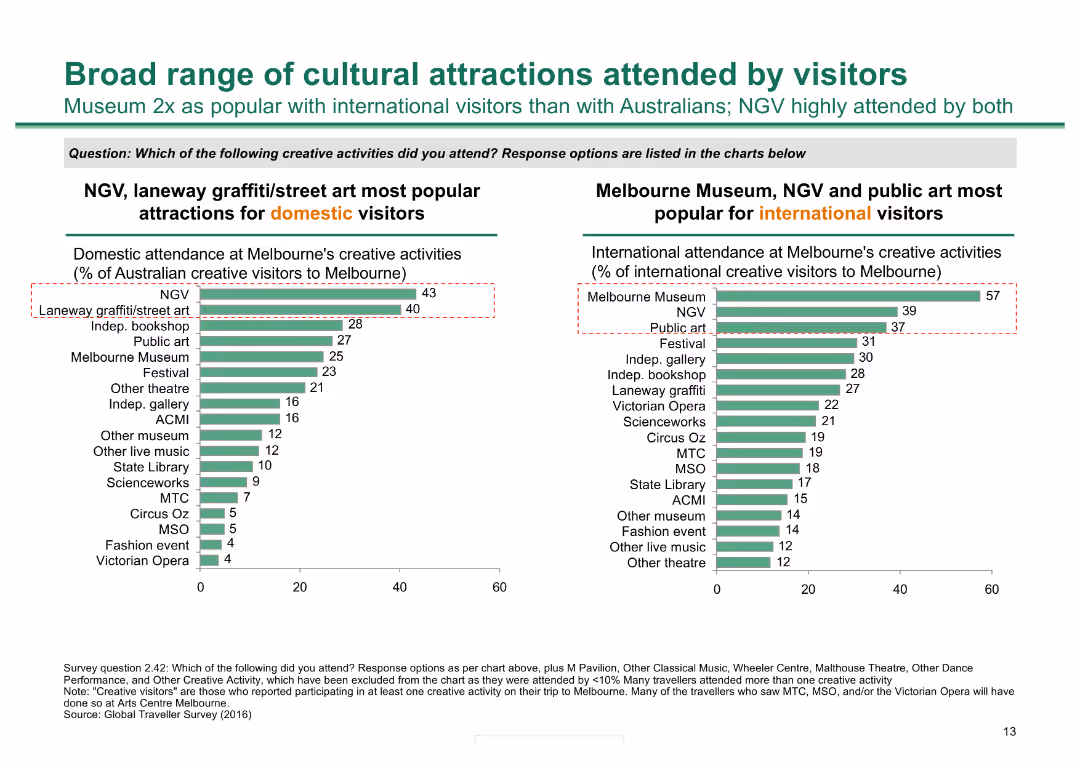
Two column charts: one showing the popularity of creative activities among domestic visitors and the other among international visitors, highlighting key cultural attractions.
Market Analysis and Trends
Hospitality & Tourism
The slide details the attendance at various creative activities in Melbourne, comparing the preferences of domestic and international visitors to identify popular cultural attractions.
cultural attractions, Melbourne, creative activities, domestic visitors, international visitors, popularity, tourism, trends
false
Broad range of cultural attractions attended by visitorsMelbourne as a Global Cultural Destination
Multiple Chart
BCG
View slide
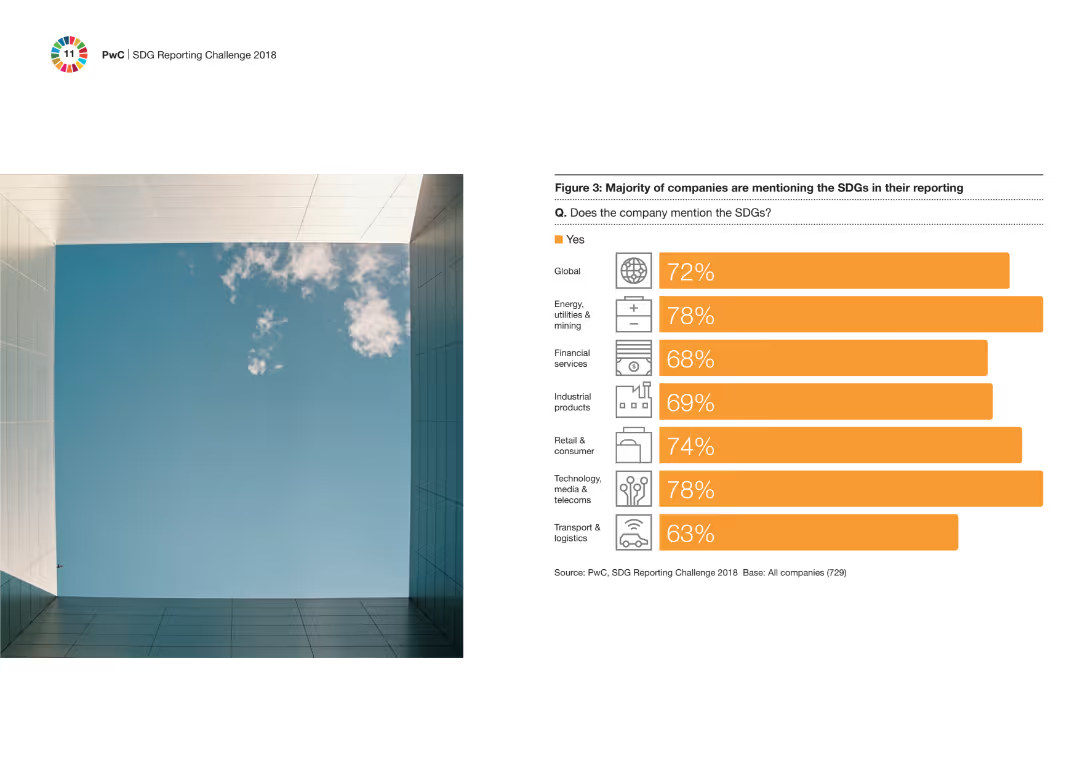
Column chart illustrating the percentage of companies across various industries that mention the SDGs in their reports. Visual includes icons representing different industries on the right side of the chart.
Regulatory and Compliance
Financial Services
The slide details the percentage of companies in various industries that mention the SDGs in their reporting, highlighting that most sectors are engaging with these sustainability goals.
SDGs, industries, reporting, sustainability, companies
false
Figure 3: Majority of companies are mentioning the SDGs in their reportingFrom promise to reality: Does business really care about the SDGs?
Mixed Chart
PwC/Strategy&
View slide
A multi-year column chart presents investment trends in HealthTech, with a distinct color for each year. The layout includes a title at the top, a legend, and a source citation at the bottom.
Investment Analysis
Healthcare & Pharmaceuticals
The slide shows an upward trend in HealthTech investments over several years, highlighting deal numbers and values, which indicates growing financial interest in the sector.
HealthTech, Investments, Trends, Deal Value, Financial Interest, Growth, Sector, Analysis, Multi-Year, Data
false
Investment in HealthTech has been rising over the yearse-Conomy SEA 2020 At full velocity: Resilient and racing ahead
Single Chart
Bain
View slide
A colorful table showing variation in maturity across different SHoP dimensions.
Technology and Digital Transformation
Professional Services
Examines how companies vary in maturity across different dimensions such as marketing, loyalty, and tech stack.
maturity, variation, marketing, loyalty, commerce, analytics
false
Significant variation in maturity level of companies evidenced across SHoP dimensionsA DATA DRIVEN APPROACH TO IMPROVE CUSTOMER ENGAGEMENT
Multiple Chart
BCG
View slide
Two bar charts displaying MMIS spend and cost savings opportunities over fiscal years, with detailed explanatory text boxes. Dense layout.
Regulatory and Compliance
Government & Public Sector
Review of MMIS contract costs and potential cost savings for the state, emphasizing shifting enhancement costs to vendors in future MMIS contracts.
MMIS, Costs, Savings, Fiscal Year, Contract
false
Medicaid | MMIS | Assessment Findings Highlight (1 of 2)NH DHHS Operations Assessment
Multiple Chart
Alvarez & Marsal
View slide
Left: narrative explanation; Right: circular infographic showing SDG reporting rates (2017–2022) for N100 and G250. Bottom panel explains SDGs.
Regulatory and Compliance
Environmental Services & Sustainability
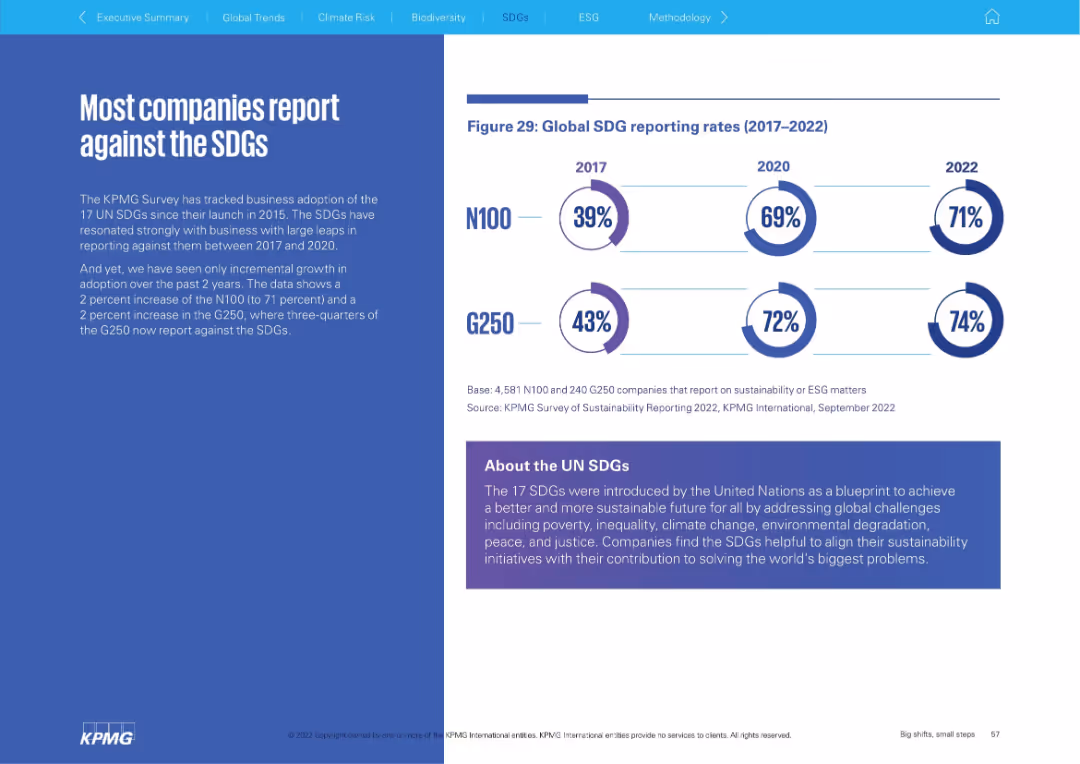
The slide shows a high and gradually increasing rate of corporate reporting against the UN Sustainable Development Goals (SDGs). It explains the relevance of SDGs and highlights that three-quarters of G250 companies now report against them.
SDGs, sustainability goals, reporting, UN, ESG, corporate responsibility
false
Most companies report against the SDGsBig shifts, small steps Survey of Sustainability Reporting 2022
Mixed Chart
KPMG
View slide
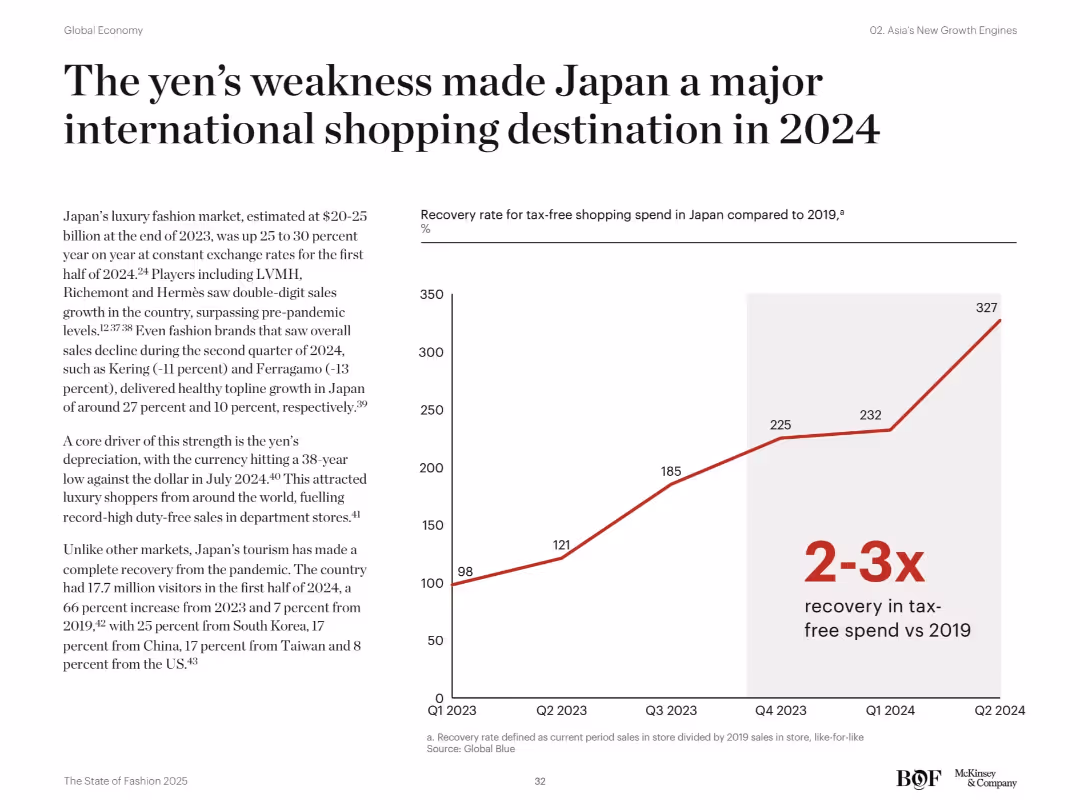
Line graph tracks recovery rate in tax-free spending in Japan from Q1 2023 to Q2 2024. Accompanying text highlights yen depreciation and tourism rebound.
Market Analysis and Trends
Consumer Goods
The slide presents Japan's strong rebound as a luxury shopping hub in 2024, fueled by yen depreciation and a surge in international tourism. It shows a 2–3x increase in tax-free spending over 2019 levels, with contributions from travelers across Asia and the US.
Japan, tax-free shopping, yen depreciation, luxury market, tourism, sales recovery, international shoppers, fashion retail, exchange rate
false
The yen’s weakness made Japan a major international shopping destination in 2024The State of Fashion 2025
Mixed Chart
McKinsey
View slide
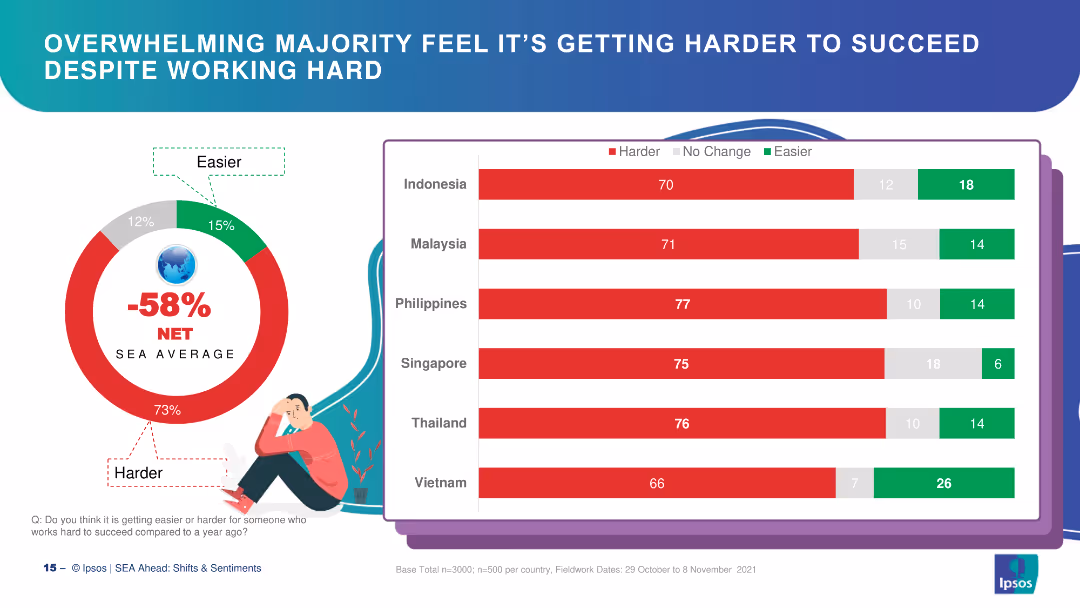
Circle chart and bar charts showing perceptions of difficulty in succeeding despite hard work in SEA.
Market Analysis and Trends
Financial Services
The slide shows that a majority of respondents find it harder to succeed despite working hard, highlighting regional variations.
difficulty, success, hard work, SEA, perceptions
false
OVERWHELMING MAJORITY FEEL IT’S GETTING HARDER TO SUCCEED DESPITE WORKING HARDIPSOS SEA AHEAD SHIFTS & SENTIMENTS
Multiple Chart
IPSOS
View slide
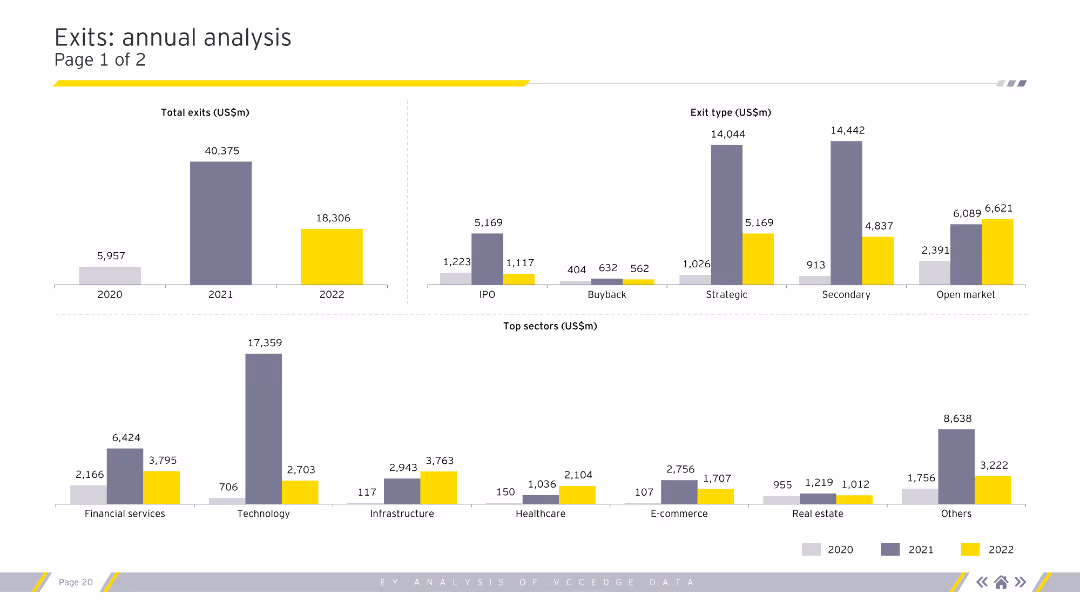
Column charts depicting total exits, exit types, and top sectors for exits by value for 2020-2022.
Market Analysis and Trends
Financial Services
Detailed analysis of exit types, sizes, and segments, highlighting top-performing sectors in exits.
exits, exit types, sectors, trends, analysis
false
Exits: annual analysisPage 1 of 2Is private equity rewriting what value means? Explore the emergence of NextWaveprivate equity and its impact on the economy and society
Multiple Chart
EY
View slide
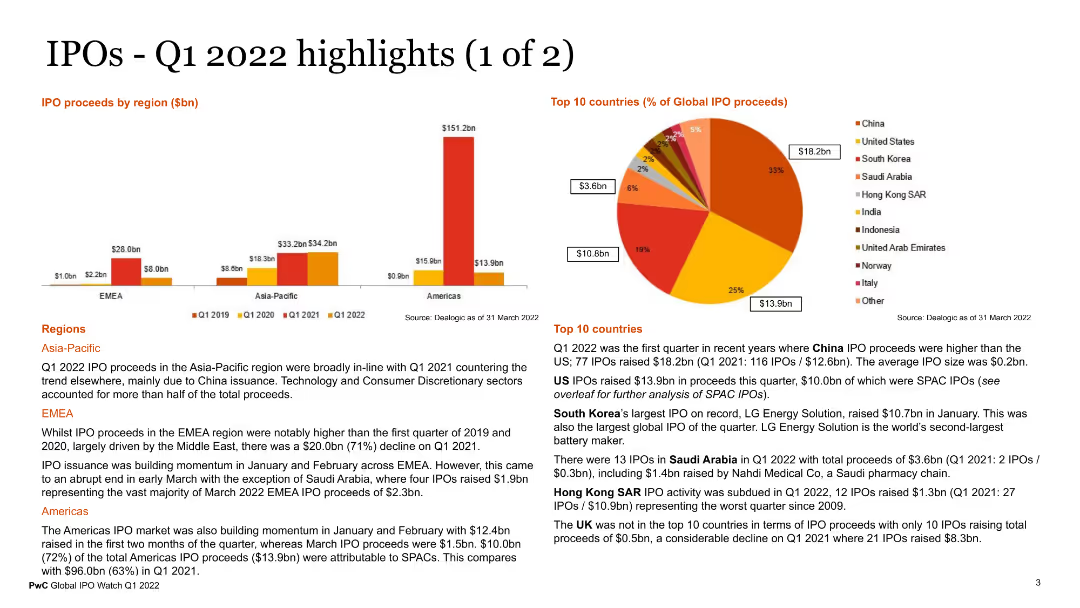
The slide features multiple visual elements, including a column chart for IPO proceeds by region, a pie chart for the top 10 countries by global IPO proceeds, and text sections detailing regional IPO activities in Asia-Pacific, EMEA, and the Americas. The charts use various colors to represent different data points.
Market Analysis and Trends
Financial Services
This slide presents key highlights of IPO activities in Q1 2022, with detailed regional analysis and top countries contributing to IPO proceeds. It provides a clear picture of global IPO trends and regional performance, useful for investors and market analysts.
IPO highlights, Q1 2022, regional analysis, global IPOs, financial trends
false
IPOs - Q1 2022 highlights (1 of 2)Global IPO Watch Q1 2022
Multiple Chart
PwC/Strategy&
View slide
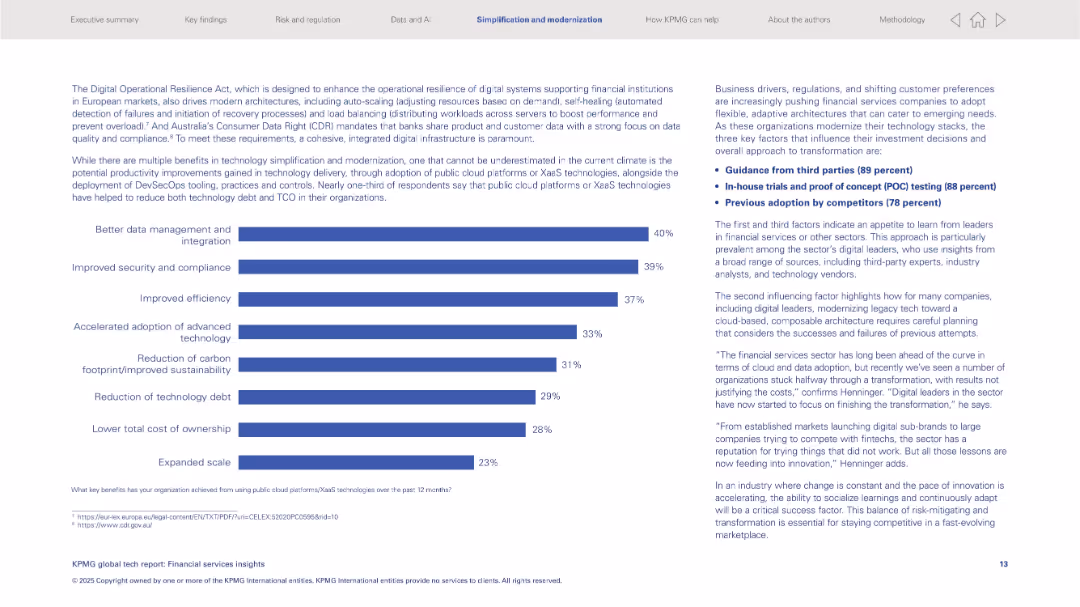
Left: horizontal bar graph listing tech benefits; right: text insights and key influencing factors.
Operational Efficiency
Financial Services
Discusses benefits from public cloud/XaaS like better data integration and security. Key transformation drivers include third-party guidance, in-house testing, and competitor adoption. Also addresses modernization of legacy tech stacks.
XaaS, cloud platforms, modernization, security, integration, third-party advice, financial sector
false
The Digital Operational Resilience Act, which is designed to enhance the operational resilience of digital systems supporting financial institutions in European marketsKPMG global tech report: Financial services insights
Mixed Chart
KPMG
View slide
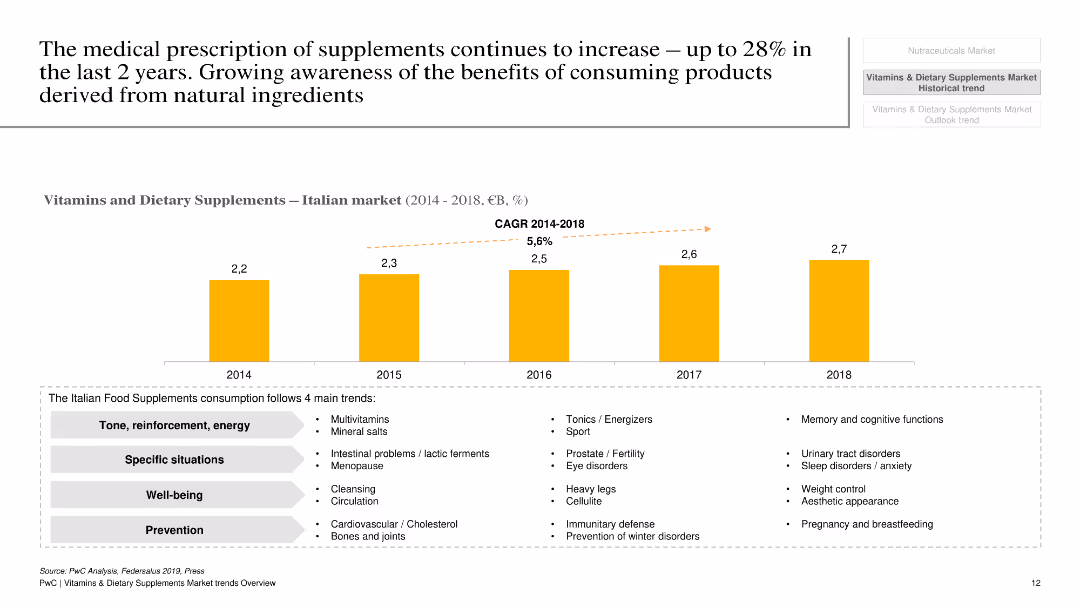
The slide has a white background with a column chart showing market growth of vitamins and dietary supplements in Italy from 2014 to 2018, along with key trends.
Market Analysis and Trends
Healthcare & Pharmaceuticals
This slide presents the growth of the vitamins and dietary supplements market in Italy, highlighting key trends, growth rate, and market drivers.
Vitamins, dietary supplements, Italy, market growth, trends, healthcare, pharmaceuticals, analysis, growth rate
false
The medical prescription of supplements continues to increase –up to 28% in the last 2 years.Vitamins & Dietary Supplements Market trends - Overview
Mixed Chart
PwC/Strategy&
View slide
Features two sets of column charts comparing 4G download speeds and availability among major operators from 2018 to 2020. The visual style uses different colors for each operator to facilitate comparison. Annotations emphasize improvements in network quality.
Market Analysis and Trends
Telecommunications
Examines the discrepancies in 4G download speeds across various operators over time, highlighting how smaller operators are improving their services to remain competitive despite having similar levels of 4G network availability.
4G, download speed, network quality, operators, competition, service improvement
false
Significant difference in 4G download speeds observed across operators despite similar 4G availabilityIndonesia case study
Multiple Chart
BCG
View slide
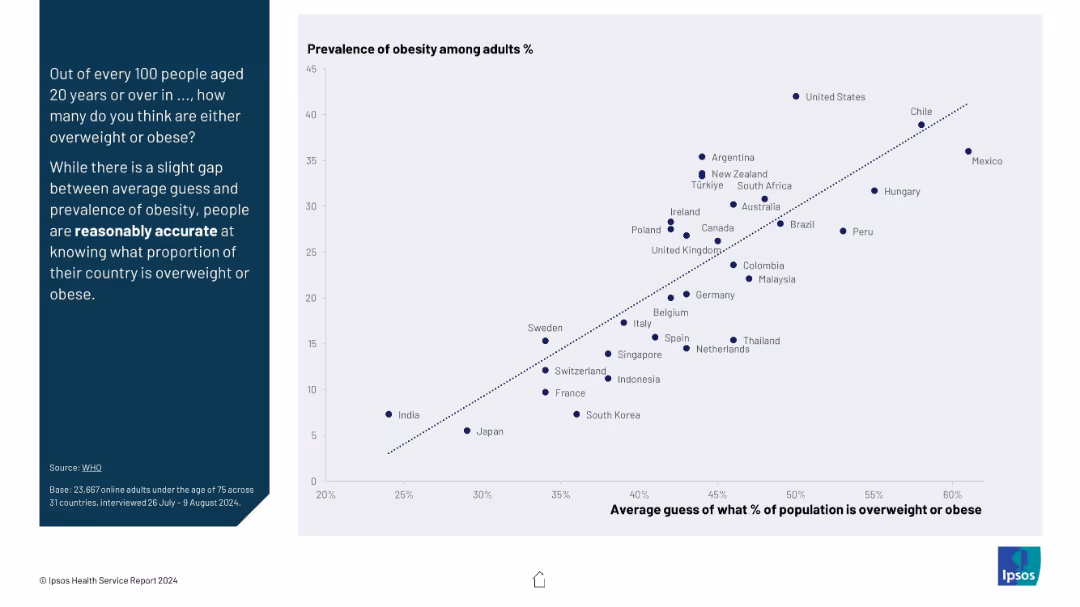
Scatter plot comparing average public guesses vs actual obesity prevalence; includes diagonal trend line for accuracy.
Market Analysis and Trends
Healthcare & Pharmaceuticals
The slide shows a correlation between the actual obesity rates and public estimates across countries. Despite minor gaps, it suggests people are reasonably accurate in estimating national obesity rates, indicating awareness of public health issues.
obesity, public perception, health awareness, statistical comparison, accuracy, health trend, overweight population
false
Prevalence of Obesity Among Adults %IPSOS HEALTH SERVICE REPORT 2024
Mixed Chart
IPSOS
View slide
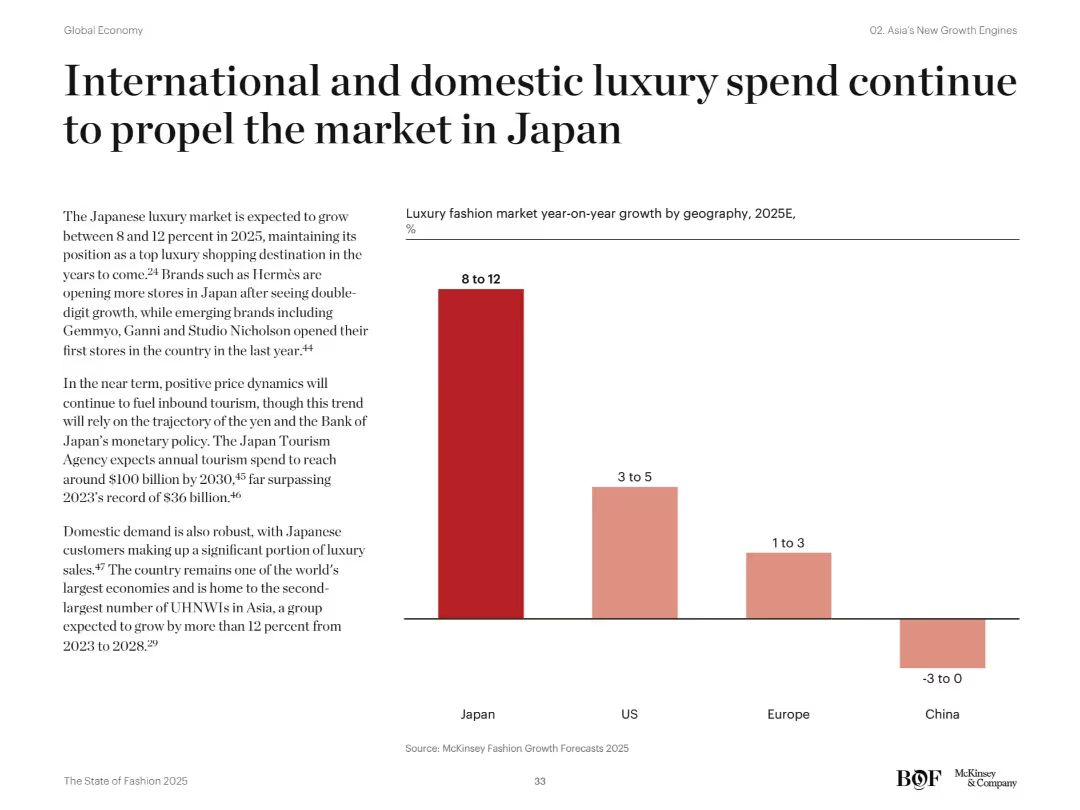
Vertical bar chart comparing luxury market growth forecasts across regions for 2025. Text highlights brand openings and macroeconomic factors.
Financial Performance
Consumer Goods
Japan’s luxury market is expected to grow 8–12% in 2025, driven by both domestic and tourist spending. The country outpaces the US, Europe, and China in growth outlook, with brands expanding presence and rising UHNWIs fueling demand.
Japan, luxury growth, domestic demand, tourism, UHNWIs, retail forecast, fashion brands, consumer spending, Asia markets, market outlook
false
International and domestic luxury spend continue to propel the market in JapanThe State of Fashion 2025
Mixed Chart
McKinsey
View slide
This slide provides a diagram and bullet points to explain the tangible impacts of company culture, featuring icons and a blue and teal color palette. Text is well organized and visually distinct.
Organizational Structure and Change
Professional Services
Emphasizing the practical effects of company culture, this slide could be part of a presentation advocating for the development of a strong organizational culture and its positive outcomes.
company culture, impact, organizational, development, outcomes, engagement, satisfaction, performance, motivation, improvement
false
Culture has tangible impact on companies; there are key elements crucial to having a positive company cultureASEAN Growth and Scale Talent Playbook
Header Vertical
Kearney
View slide
The slide presents a funnel infographic with stages of application selection along with a bar chart. The funnel shows three stages of filtering applications with specific numbers at each stage, leading down to the final selected 3,050 applications. The bar chart to the right shows the selected applications emphasized in red.
Market Analysis and Trends
Professional Services
This slide visualizes the multi-stage process of application selection, highlighting the final selection of 3,050 applications from a larger pool through various criteria. It is used for illustrating decision-making processes and outcomes in a corporate or professional environment.
Selection, Applications, Funnel, Process, Criteria, Decision-making, Corporate, Outcomes, Analysis, Stage
false
THE FINAL LIST OF 3,050 COMPRISED OF APPLICATIONS RANKED MEDIUM AND ABOVE IN THE 3RD STAGE, AND OTHERS SELECTED ON DISCRETIONARY BASISTEF APPLICATION EVALUATION 2019
Single Chart
Accenture
View slide
Map highlighting surveyed regions, icons representing survey waves and respondent statistics.
Market Analysis and Trends
Transportation & Logistics
Summarizes the scope and methodology of a global survey on automotive and mobility trends amid COVID-19.
COVID-19, Mobility, Survey, Global, Automotive
false
Scope of global COVID-19 Auto & Mobility Consumer SurveyCOVID-19 Auto & Mobility Consumer Insights
Pillar
McKinsey
View slide
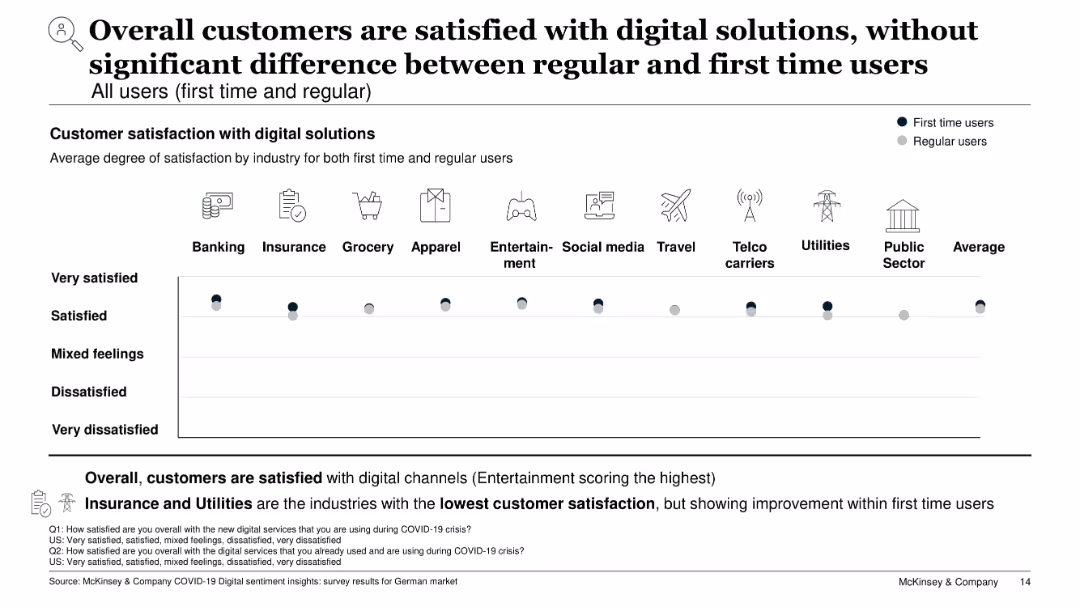
Dot chart showing satisfaction levels across industries; two tones represent regular vs. first-time users
Customer and Market Segmentation
Technology & Software
This slide compares satisfaction levels with digital channels between first-time and regular users. Across industries, satisfaction is generally high, with Entertainment showing the highest scores. The chart reveals minimal difference between the two user groups, indicating strong onboarding and usability.
digital satisfaction, first-time users, regular users, customer experience, usability, entertainment, industry comparison
false
Overall customers are satisfied with digital solutions, without significant difference between regular and first time usersCOVID-19 Digital sentiment insights
Single Chart
McKinsey
View slide
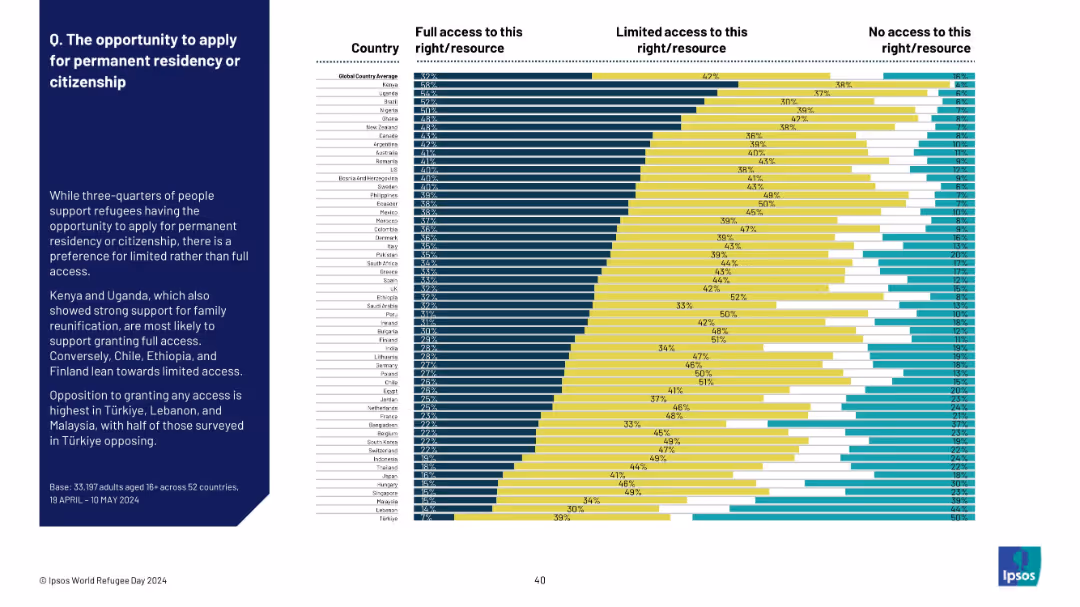
Bar chart showing three-tier access (full, limited, none) across countries, with a paragraph of insights on the left in a dark-blue sidebar. Clean, data-driven layout with emphasis on comparative support for refugee rights.
Regulatory and Compliance
Government & Public Sector
This slide compares global public opinion on whether refugees should have access to permanent residency or citizenship, showing preferences for full, limited, or no access. It highlights countries with the strongest support or resistance to full access.
refugees, citizenship, residency, public opinion, access rights, countries, Ipsos, global survey, support levels, immigration policy
false
The opportunity to apply for permanent residency or citizenshipWORLD REFUGEE DAY
Mixed Chart
IPSOS
View slide
This slide contains bullet points and projected figures, emphasizing future financial expectations and plans, laid out in a clear, structured manner.
Strategic Planning
Financial Services
The slide provides forward-looking guidance for the third quarter and the full year of 2023, focusing on revenue, expenses, cost of credit, tax rate, and capital. It is a strategic tool likely used by financial services professionals for planning and forecasting future performance.
guidance, revenue, expenses, credit, tax rate, capital, forecasting
false
3Q 2023 and Full Year 2023 GuidanceEarnings Results Presentation Second Quarter 2023
Table
Citigroup
View slide
Features multiple pie charts displaying the percentage use of AI in different operational areas.
Operational Efficiency
Technology & Software
Outlines the use of AI in daily operations across various industries, focusing on customer experience and operations, and highlights the sectors and processes where AI has the most significant impact.
AI, operations, customer experience, day-to-day, industries
false
Consumer The consumer industry includes a vast array of business types, ranging from consumer products to hotels, restaurants and airlines.Fueling the AI transformation: Four key actions powering widespread value from AI, right now.
Multiple Chart
Deloitte
View slide
Continuation of the bar chart survey series; country-specific agreement/disagreement shown; typical color coding and consistent visual style maintained.
Strategic Planning
Professional Services
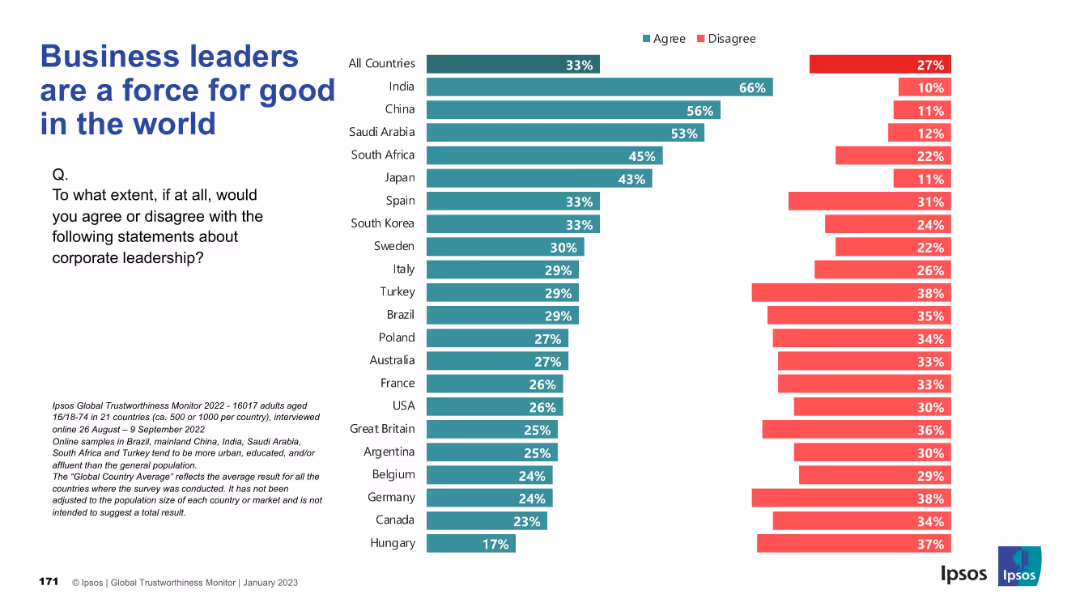
Respondents were asked whether they view business leaders as a positive force globally. India leads with strongest support, while Western countries express mixed or low sentiment.
corporate goodwill, leadership impact, public trust, Ipsos, global role, responsibility, positive change
false
Business leaders are a force for good in the worldIPSOS GLOBAL TRUSTWORTHINESS MONITOR January 2023
Mixed Chart
IPSOS
View slide
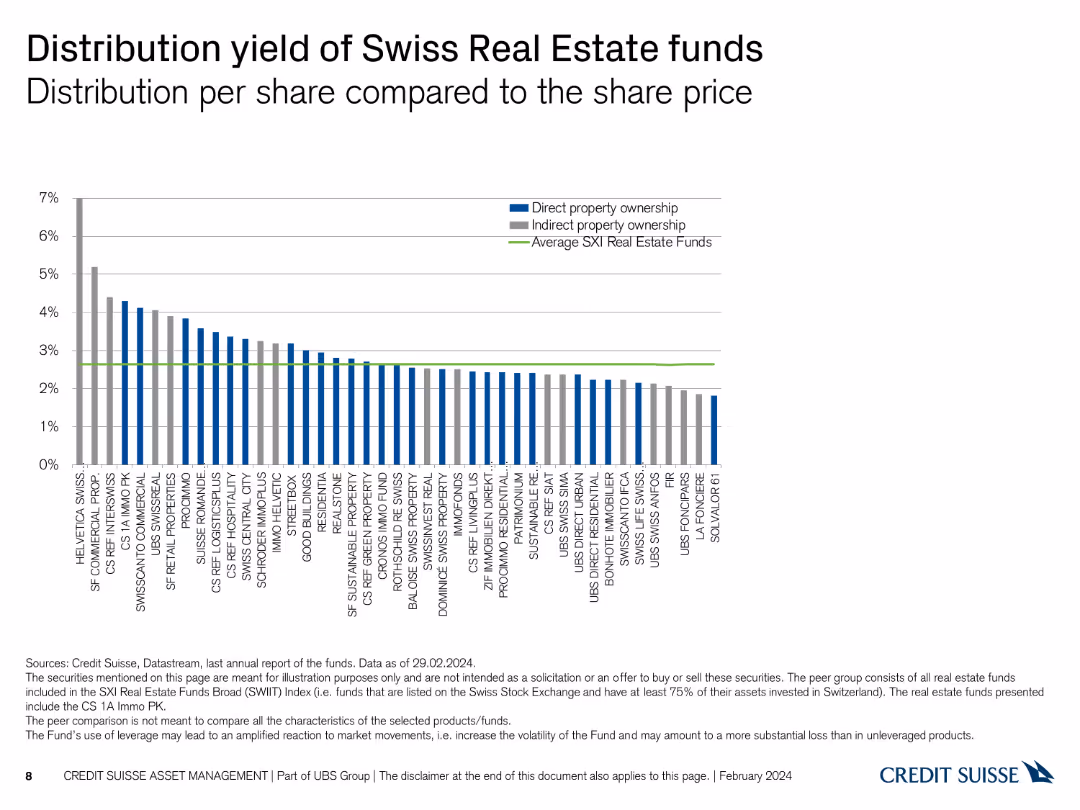
A column chart comparing the distribution yield per share for various Swiss real estate funds, with average yields highlighted.
Financial Performance
Financial Services
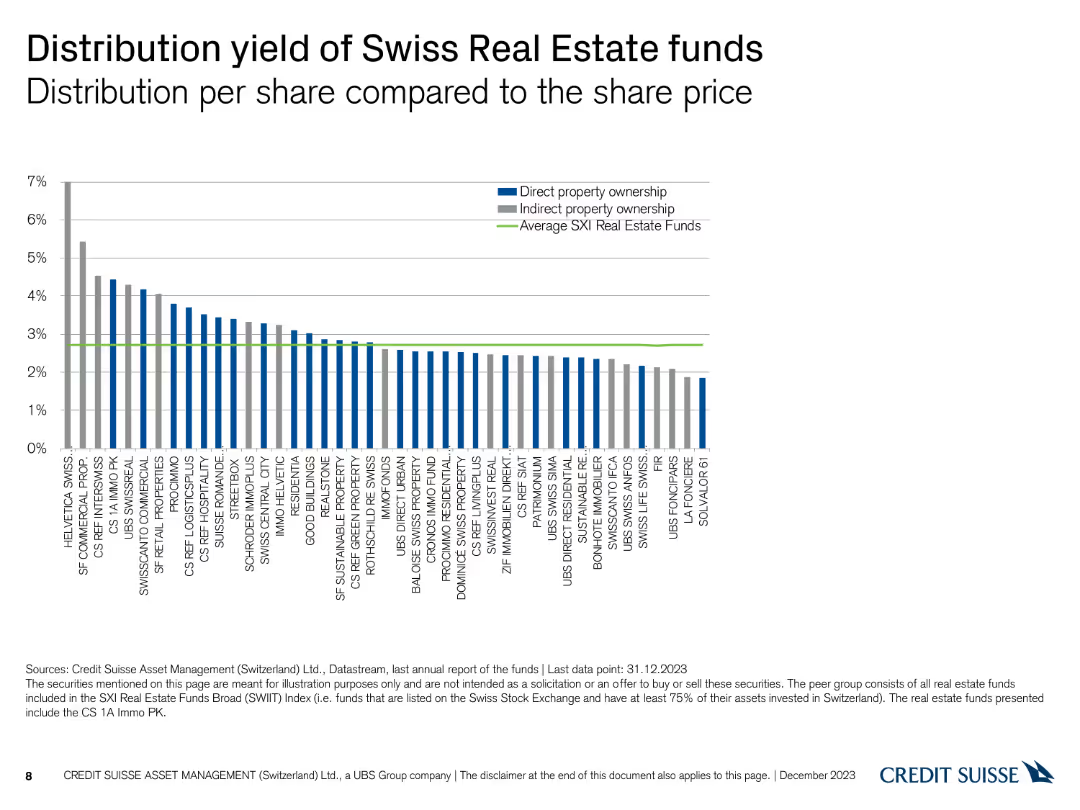
This slide compares the distribution yields of Swiss real estate funds, presenting data on direct and indirect property ownership against the average SXI real estate funds.
Distribution Yield, Real Estate Funds, Ownership, Yields
false
Distribution yield of Swiss Real Estate funds Distribution per share compared to the share priceSwiss Real Estate Funds At a glance December 2023
Single Chart
Credit Suisse
View slide
Dual bar charts on left and right comparing trust in various industries for data security and transparency. Survey-based.
Risk Assessment and Management
Telecommunications
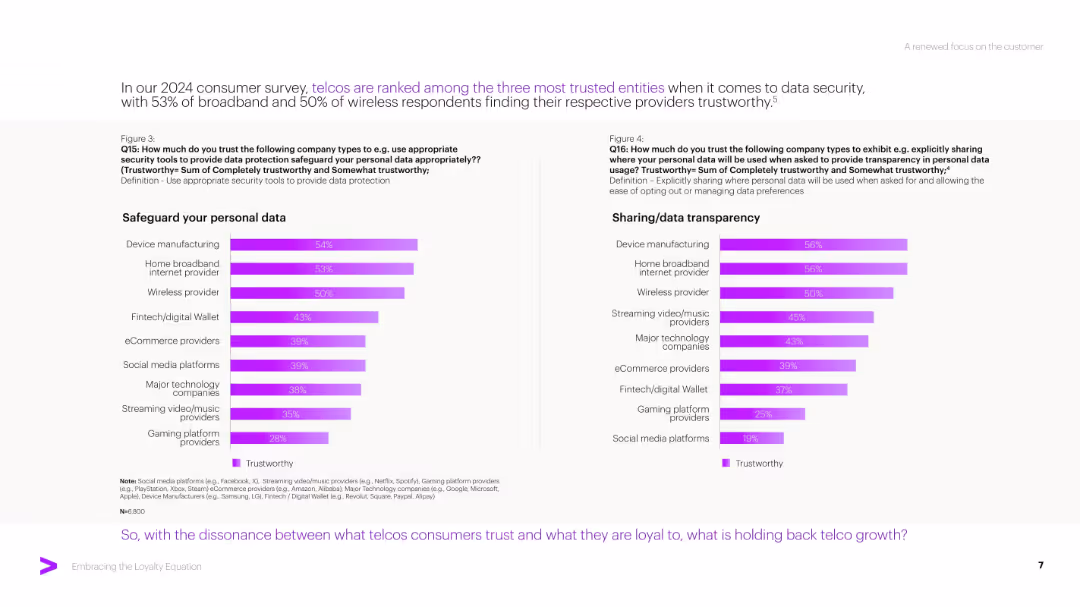
The slide presents consumer trust ratings across sectors for safeguarding personal data and transparency. Telecoms rank high, particularly broadband providers, suggesting trust isn’t the core issue behind poor loyalty, opening the door for deeper customer engagement.
Data Security, Transparency, Trust, Telecom, Consumer Survey, Privacy, Broadband, Risk Management
false
In our 2024 consumer survey, telcos are ranked among the three most trusted entities when it comes to data security, with 53% of broadband and 50% of wireless respondents finding their respective providers trustworthy.5Embracing the Loyalty Equation
Multiple Chart
Accenture
View slide
The slide contains a pie chart illustrating investors' views on limiting managers' exposure to digital assets. A vibrant image of digital assets in a server room is on the left.
Market Analysis and Trends
Financial Services
Explores hedge fund managers' interest in digital assets and investors' requirements for limiting exposure to these assets, highlighting the percentage of discretionary assets.
hedge funds, digital assets, investors, exposure, cryptocurrency, decentralized finance, blockchain, market trends, server room
false
Hedge fund managers’ interest in digital assets is still nascent, but growing Investors: Do you require that your managers limit their exposure to crypto-/digital-related assets in funds that are not dedicated to crypto-/digital-related assets?Can resilience shape a shifting landscape?
Mixed Chart
EY
View slide
Slide contains multiple column charts, and comparative data tables for loans and deposits across different bank types over several quarters, structured with clear section headers.
Financial Performance
Financial Services
This slide provides a quarterly financial performance overview for various types of banks, illustrating trends in loans and deposits, and highlighting key financial changes and ratios.
financial, banks, quarterly, loans, deposits, trends, performance, analysis
false
Loan and deposit development In € bn, unless stated otherwise, loan-to-deposit ratio 81%Q2 2023 results
Multiple Chart
Deutsche Bank
View slide
Two columns: text explanation and line chart showing stable or declining trust across generations in tech sector.
Market Analysis and Trends
Technology & Software
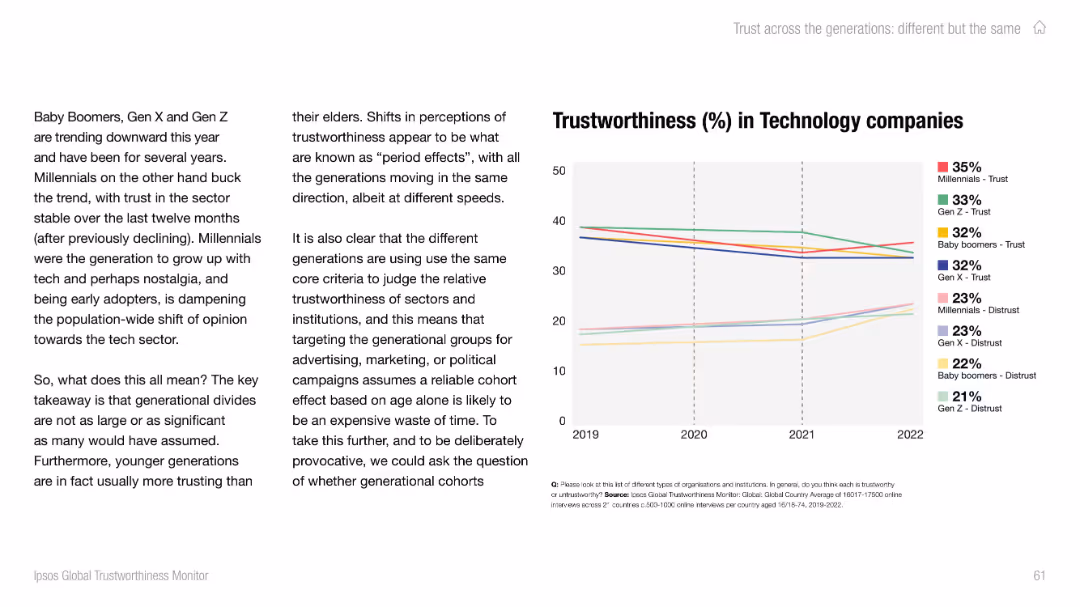
This slide notes declining trust in technology companies across most generations except Millennials, whose trust levels remained stable. It questions assumptions about generational divides in perception.
tech sector, trust, generational trends, Millennials, public opinion, Ipsos, period effects, marketing strategy, cohort behavior
false
Trustworthiness (%) in Technology companiesIPSOS GLOBAL TRUSTWORTHINESS MONITOR
Mixed Chart
IPSOS
View slide
Features an extensive flowchart diagram with different financial services offered by the firm, divided by client needs, and includes some numerical data points.
Organizational Structure and Change
Financial Services
Details the comprehensive offerings by the firm to support clients during IB transactions and the depth of relationships.
Collaboration, Franchise, Client Support, IB Transactions, Services Offering, Commercial Banking
false
We partner across the JPM franchise to support clients, adding unique value during IB transactions, and providing a complete set of offerings that deepen our relationshipsInverstors Day 2023
Table
JP Morgan
View slide
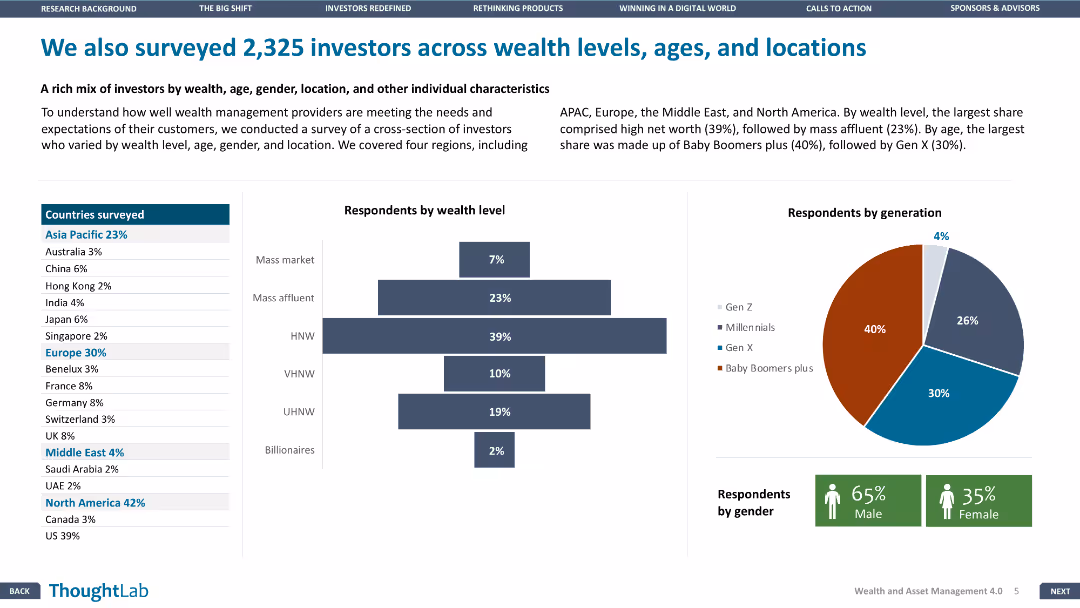
This slide contains multiple data visualizations, including a map, bar chart, and pie chart, illustrating the demographics of 2,325 investors by wealth level, age, gender, and location, across various regions.
Market Analysis and Trends
Financial Services
Presents survey data of 2,325 investors, analyzing their wealth levels, age groups, gender distribution, and geographical locations, offering insights into investor demographics and preferences.
investor demographics, survey, wealth levels, age groups, gender distribution, geographical locations, market insights
false
We also surveyed 2,325 investors across wealth levels, ages, and locationsWealth and asset management 4.0
Multiple Chart
Deloitte
View slide
Column charts display opinions on French-American relations and EU-US trade concerns with additional professional quotes.
Regulatory and Compliance
Government & Public Sector
Reviews concerns about French-American relations and potential impacts of a trade war with the US on the European Union, with industry expert insights.
French-American relations, EU, trade war, international relations, investment impact, Macron
false
Respondents are also concerned by French-American relations and a potential trade war between the European Union and the U.S.AmCham – Bain Barometer 19th Edition
Multiple Chart
Bain
View slide
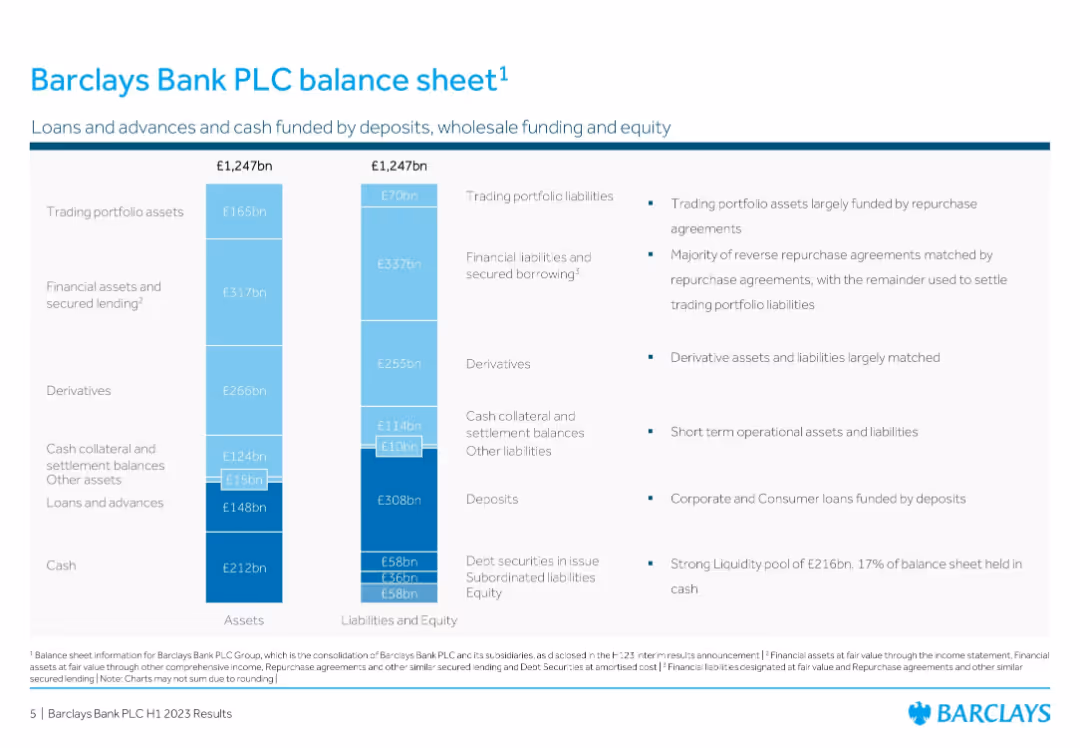
Split vertical chart: Assets vs. Liabilities & Equity; data labels with callouts and notes
Corporate Finance and Valuation
Financial Services
Provides a visual representation of Barclays’ balance sheet in H1 2023, showing the allocation of £1,247bn in both assets and liabilities. Highlights liquidity, deposits, secured lending, and trading liabilities with relevant funding details.
Balance Sheet, Assets, Liabilities, Deposits, Barclays, Valuation, Lending, Trading Portfolio
false
Barclays Bank PLC balance sheetH1 2023 Client information – Summary of existing disclosure
Mixed Chart
Barclays
View slide
The slide features infographics and charts predicting future carbon farming benefits in Maranoa, including additional ACCUs generated, revenue, and supported jobs.
Client Case Studies
Agriculture & Food Production
This slide forecasts the potential future of Maranoa through carbon farming, estimating additional ACCUs generated, revenue growth, and job support from 2021 to 2030. It highlights various carbon farming practices and their economic impact.
Carbon farming, Maranoa, Future projections, Revenue, Jobs
false
Maranoa Case Study Potential Future | 2021 2030How can Australia’s agriculture sector realise opportunity in a low emissions future?
Mixed Chart
EY
View slide
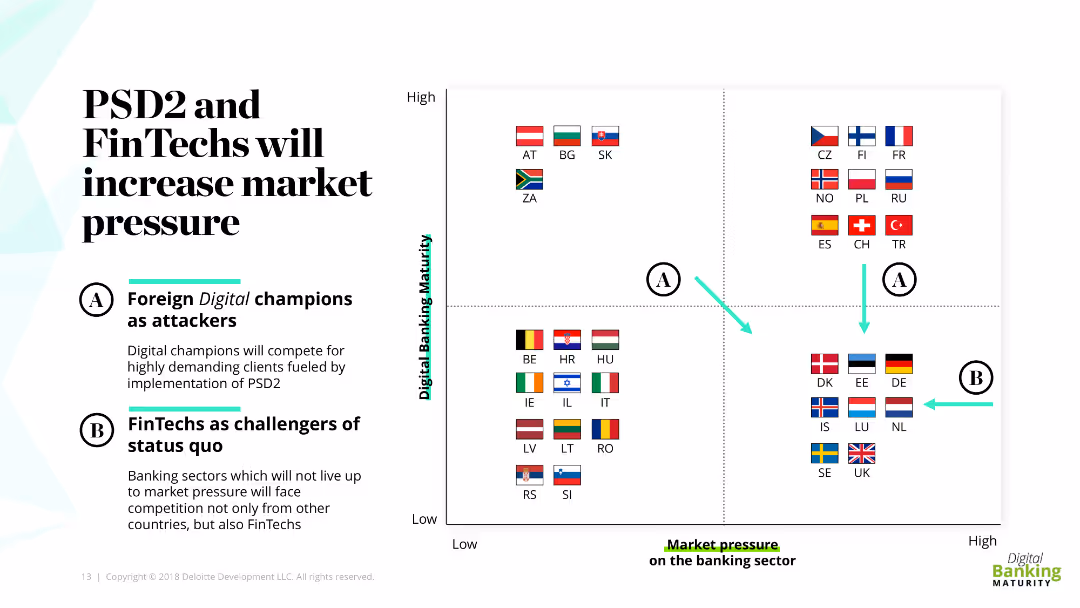
The slide features a quadrant chart with flags of various countries, representing different levels of digital banking maturity and market pressure. It also includes descriptive text boxes labeled A and B explaining the roles of digital champions and FinTechs as challengers.
Market Analysis and Trends
Financial Services
This slide discusses how PSD2 and FinTechs are increasing market pressure in banking, categorizing countries based on their digital banking maturity. It emphasizes the roles of foreign digital champions and FinTechs as challengers to the status quo.
PSD2, FinTechs, digital banking, market pressure, challengers
false
PSD2 and FinTechs will increase market pressureEMEA Digital Banking Maturity 2018
Diagram
Deloitte
View slide
The slide displays two column charts with varying backgrounds, showing survey responses by country.
Technology and Digital Transformation
Professional Services
This slide illustrates the principle of removing backgrounds to improve the clarity of data presentations in charts, following Tufte's guidelines.
Tufte, data-to-ink, ratio, survey, responses, visualization, backgrounds, chart, clarity, design
false
Tufte principles: data-to-ink ratio Remove backgroundsEY Academic Resource Center – mission
Multiple Chart
EY
View slide
Features four small column charts comparing capacity differences between Option 3C and the Base case across various scenarios (Central, Step Change, Fast Change, Slow Change).
Financial Performance
Energy & Utilities
Compares capacity differences between Option 3C and the Base case, providing insights into potential changes in energy production capacities across different scenarios.
Option 3C, capacity, comparison, Base case, energy, scenarios, Central, Step Change, Fast Change, Slow Change
false
Option 3C outcomes - Capacity (Option 3C minus Base case)Reinforcing the New South Wales Southern Shared Network (HumeLink) PADR – EY Market Modelling
Multiple Chart
EY
View slide
This slide presents a line chart showing historical trends in the levelized cost of energy for various utility-scale renewable energy technologies over time.
Market Analysis and Trends
Energy & Utilities
The slide tracks the historical cost declines in utility-scale renewable energy, providing insights into cost trends, technological advancements, and market competitiveness over several years.
Historical Trends, Utility-Scale, LCOE, Renewable Energy, Cost Decline
false
Levelized Cost of Energy Comparison—Historical Utility-Scale GenerationLazards Lcoeplus
Single Chart
Roland Berger
View slide
Two sets of line charts, one on each side. Left charts represent "Labor Slack" with lines for "Labor Force," "Nonfarm Employment + Job Openings," and "Supply/Demand Gap." Right chart shows "Median Wage (12-Month Moving Average)" with wage percentiles.
Market Analysis and Trends
Financial Services
This slide analyzes labor market conditions, presenting data on employment, job openings, and median wages across different percentiles. It is useful for economic forecasts and labor market strategies.
labor market, employment, job openings, median wage
false
Labor Markets Remain TightCredit Market Monitor
Multiple Chart
Morgan Stanley
View slide
The slide features a column chart showing changes in assets under management over time, with callout boxes indicating specific factors contributing to the increases or decreases, and an annotation explaining equity movements. The chart uses shades of blue and gray for visual differentiation.
Financial Performance
Financial Services
This slide presents the movements in Macquarie Infrastructure and Real Assets (MIRA) Equity Under Management (EUM), highlighting the impact of new equity raised, listed security price movements, and foreign exchange movements, suitable for financial analysis and investor presentations.
MIRA, EUM, equity, investment, financial analysis, Macquarie, bar graph, performance, capital, foreign exchange
false
MIRA EUM movement Increase of 5% primarily due to new equity raisedGoldman Sachs 16thAnnual Australia and New Zealand Investment Forum
Single Chart
Goldman Sachs
View slide
Features multiple data visualizations including a bar chart, a resource flow diagram, and detailed bullet points summarizing the economic benefits of Copernicus for the forestry sector. Visuals are complemented by text explaining each point.
Investment Analysis
Environmental Services & Sustainability
This slide details the economic impact of Copernicus data on forestry management, quantifying revenue enhancements and cost savings achieved through improved resource management and monitoring. It targets stakeholders considering investments in geospatial and EO data technologies.
Copernicus, forestry, economic benefits, EO data, resource management
false
FORESTRY COPERNICUS BENEFITS FOR FORESTRYCOPERNICUS Market report February 2019
Mixed Chart
PwC/Strategy&
View slide
The slide is structured with texts and graphical icons, depicting embedded finance solutions. It features an intricate flowchart that connects various service categories and key use cases, with a light blue and white color scheme.
Product and Service Analysis
Financial Services
Detailing embedded finance solutions that address payment acceptance, fund management, and payment disbursement. It showcases how these solutions cater to client needs and support various industry sectors, highlighting scalability and client traction.
embedded finance, payment solutions, client demand, scalability
false
Many of our end to end Embedded Finance solutions are now live and scaling to support client demandInverstors Day 2023
Table
JP Morgan
View slide
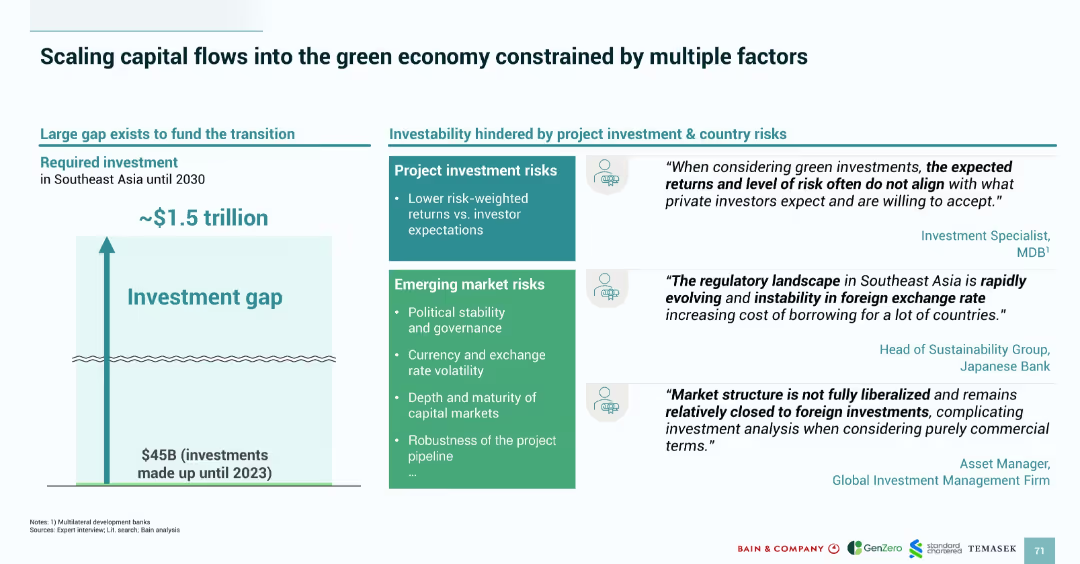
Split layout with a vertical bar graphic on the left showing a $1.5T investment gap and boxes on the right outlining project and market risks. Includes quotes from finance experts.
Investment Analysis
Financial Services
The slide addresses the investment gap (~$1.5T) required to fund Southeast Asia’s green transition and outlines risks that hinder investability—namely lower returns, political instability, currency volatility, and regulatory uncertainty. Expert quotes support the data, emphasizing challenges in attracting private sector finance due to perceived high risk.
green economy, investment gap, Southeast Asia, project risk, market risk, finance, regulation, currency, political stability
false
Scaling capital flows into the green economy constrained by multiple factorsSOUTHEAST ASIA’S GREEN ECONOMY 2024
Mixed Chart
Bain
View slide
Iceberg diagram with labeled layers representing components like models, data architecture, and cloud infrastructure.
Technology and Digital Transformation
Artificial Intelligence
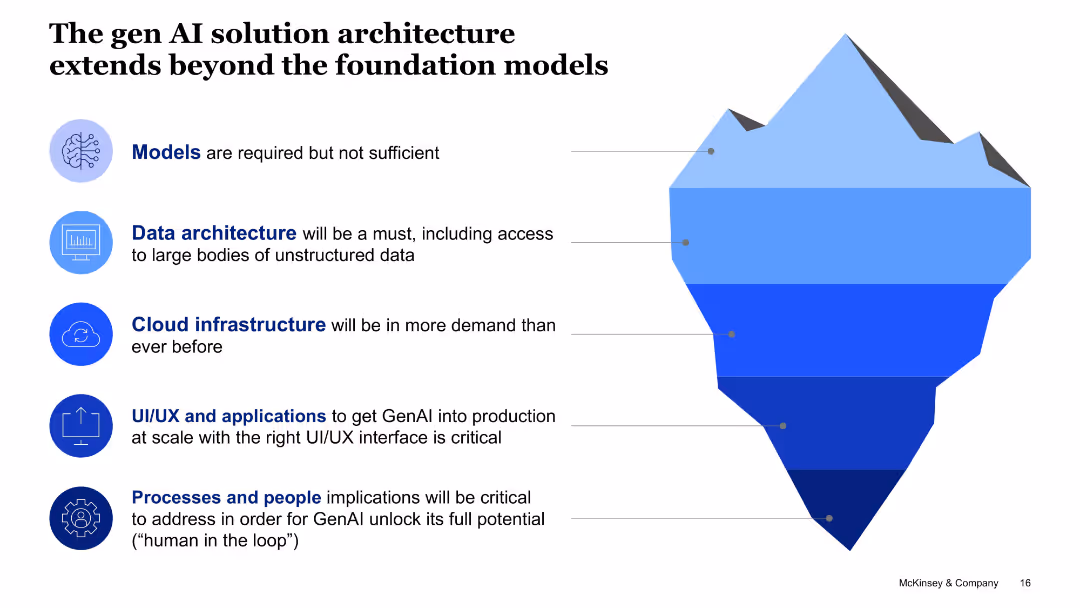
This slide emphasizes that foundational models alone aren't sufficient for Gen AI deployment. It highlights essential architecture components like cloud and data infrastructure, applications, and human-in-the-loop systems.
solution architecture, GenAI, foundation models, cloud, data, UI/UX, people processes
false
The gen AI solution architecture extends beyond the foundation modelsThe age of Generative AI: Unveiling the next frontier of digital procurement
Uncategorized
McKinsey
View slide
Detailed textual content with logos and a list of various organizational types supporting the FoodTech sector.
Market Analysis and Trends
Agriculture & Food Production
Describes the core entities that support and enable food innovation in Switzerland, including corporations and research centers.
Switzerland, FoodTech, support, innovation, ecosystem
false
The 2021 Ecosystem Strong core of enabling entitiesThe Swiss FoodTech Ecosystem 2021
Header Horizontal
Accenture
View slide
Displays column and line graphs comparing equities and FICC market share growth over time, with blue and dark tones.
Market Analysis and Trends
Financial Services
Exhibits the market share gains in Equities and FICC from 2017, showing progress and ranking improvements.
equities, FICC, market share growth, financial trends, rankings
false
We have gained share across Equities and FICC since 2017 with further room to growInverstors Day 2023
Mixed Chart
JP Morgan
View slide
Contains three stacked bar charts comparing openness about gender and sexual orientation in the workplace.
Human Resources and Talent Management
Professional Services
Discusses visibility and openness about gender and sexual orientation at work, offering insights into workplace diversity challenges.
gender, sexual orientation, workplace, diversity, inclusion
false
The diverse gender identifications and sexual orientations are not similarly out at workOut @ Work Barometer
Multiple Chart
BCG
View slide
A dual-chart layout, one depicting yield/duration for various financial instruments and the other showing correlation with U.S. Treasuries, to compare rate risks and credit exposure.
Risk Assessment and Management
Financial Services
The slide contrasts the yield/duration metrics of different investment vehicles with their correlation to U.S. Treasuries, useful in risk management and investment strategy formulation.
yield, duration, rate risk, credit exposure, investment vehicles, correlation, US Treasuries, strategy
false
Loans and High yield: Swapping Rate Risk for Credit ExposureMonthly Market Monitor November 2023
Multiple Chart
Morgan Stanley
View slide
Featuring a map of the U.S., this slide provides data points on the firm’s advisors, clients, and revenues, emphasizing their market presence. The design uses contrasting colors and icons to depict expansion in high net worth services.
Market Analysis and Trends
Financial Services
The slide promotes the firm's expansion into the high net worth sector within the U.S., highlighting its presence in key metropolitan areas and the importance of management fees to its revenue stream.
high net worth, expansion, U.S. market, advisors, revenue
false
High Net Worth ExpansionGoldman Sachs Investor Day
Graphic
Goldman Sachs
View slide
Left: text narrative; right: bar chart on Black viewership growth; bottom: sports-themed photo.
Market Analysis and Trends
Media & Entertainment
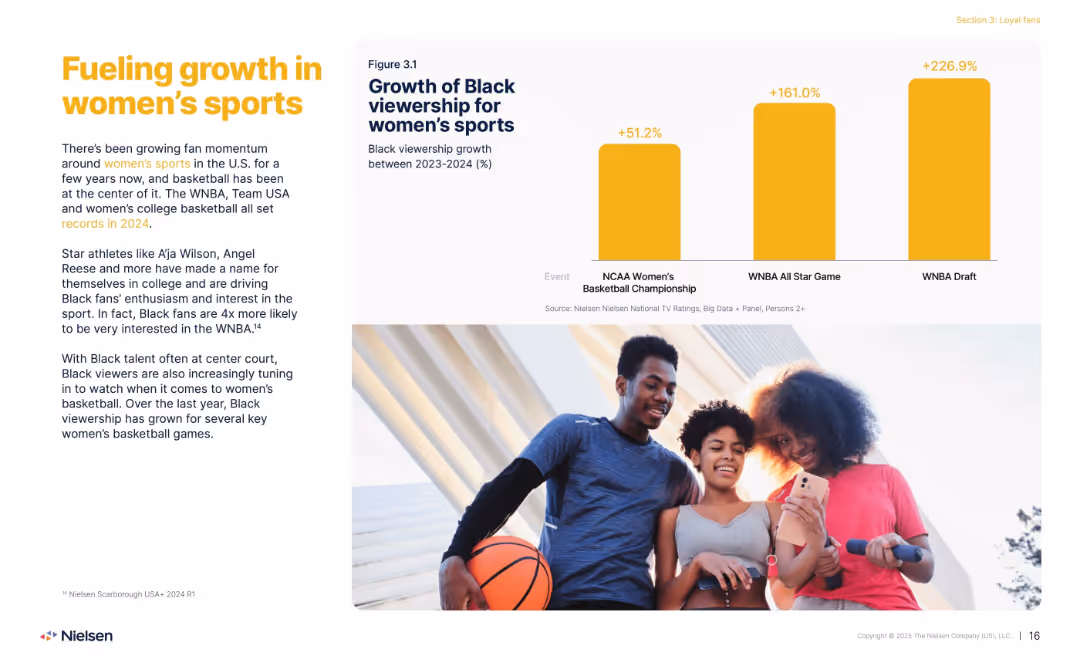
Discusses the rising interest in women’s basketball among Black viewers, citing major growth in viewership for NCAA, WNBA All-Star, and WNBA Draft events. Highlights the role of star athletes and increased visibility of Black talent in driving engagement and sports enthusiasm.
women’s sports, Black viewers, WNBA, growth, basketball
false
Fueling growth in women’s sportsEngaging Black Audiences
Mixed Chart
Nielsen
View slide
This slide features a horizontal bar chart showing the percentage of respondents in various countries who have experienced a decrease versus an increase in income.
Market Analysis and Trends
Consumer Goods
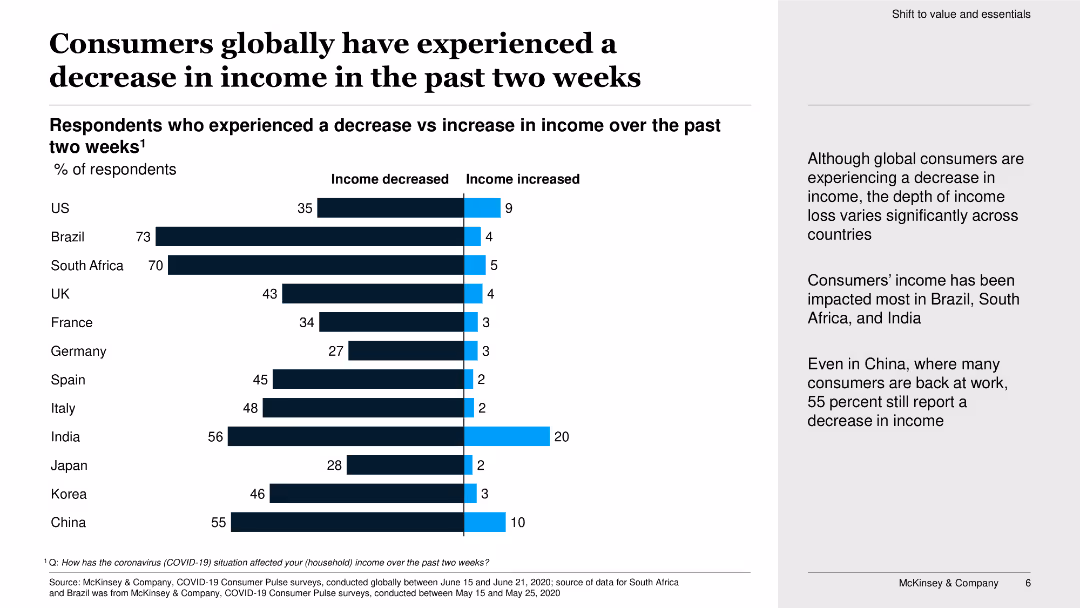
The slide presents data on how consumers globally have experienced income changes over the past two weeks, highlighting significant income decreases in certain countries.
income, consumers, global, decrease, increase, countries, percentage, bar chart, income changes, survey
false
Consumers globally have experienced a decrease in income in the past two weeksA global view of how consumer behavior is changing amid COVID-19
Mixed Chart
McKinsey
View slide
The slide features a bar chart and analysis showing the biomass potential and infrastructure adaptability, including upstream and downstream factors such as biomass transport, storage, blending limits, and marine biofuels. It includes a survey on barriers to biofuels uptake conducted by IRENA in 2019.
Technology and Digital Transformation
Energy & Utilities
This slide examines the infrastructure adaptability for biomass, highlighting the upstream and downstream factors affecting biofuel uptake, and presenting survey results on the barriers to biofuels adoption, focusing on transport, storage, and blending limits.
biomass potential, infrastructure adaptability, upstream, downstream, biofuels uptake, survey, transport, storage, blending limits, marine biofuels
false
Biomass potential—infrastructure adaptabilityDeveloping sustainable carbon circularity Looking at advanced applications and business models
Mixed Chart
Kearney
View slide
Two-part slide: left side shows professions and related work tasks; right side outlines required capabilities grouped into categories (Physical, Sensory, Cognitive, NLP, Social).
Technology and Digital Transformation
Artificial Intelligence
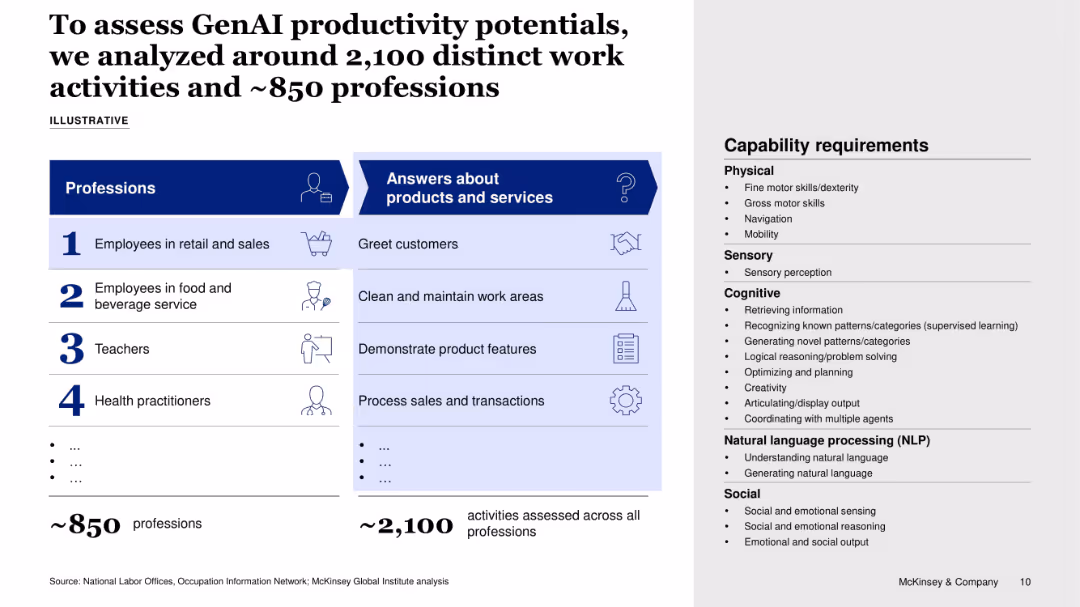
This slide presents a framework for evaluating GenAI’s productivity potential across ~850 professions and ~2,100 work activities, linking tasks like greeting customers or processing transactions to required physical, cognitive, and social capabilities.
GenAI, productivity, task automation, professions, capabilities, workforce analysis, McKinsey, skills taxonomy
false
To assess GenAI productivity potentials, we analyzed around 2,100 distinct work activities and ~850 professionsEffects of GenAI on the German labor market
Boxed
McKinsey
View slide
Similar dark background and white text with circular charts displaying percentages and yellow highlights.
Market Analysis and Trends
Healthcare & Pharmaceuticals
This slide demonstrates consumer openness to personalized medicine and technology-enhanced care, with 66% willing to take genetic tests, 66% open to non-urgent care at mini clinics, 64% willing to take medications made for their genetic profile, and 61% using wearables and mobile apps for health monitoring.
technology-enhanced care, personalized medicine, genetic testing, wearables, U.S. consumers
false
‘I am open to technology enhanced care for more personalized care and better health care experiences.’ Consumers: United StatesHealth care consumer views on value
Mixed Chart
EY
View slide
This slide contains a line chart comparing perceptions of inclusive culture maturity between different respondent groups with color-coded lines and percentage annotations.
Strategic Planning
Professional Services
Examines how U.S. respondents view the maturity of inclusive culture compared to a global sample, particularly among non-minority women.
inclusive culture, U.S., global comparison, line chart, maturity assessment, gender perspective, diversity
false
U.S. RESPONDENTS EVALUATE MATURITY IN INCLUSIVE CULTURE LESS FAVORABLY THAN THE OVERALL GLOBAL SAMPLE. NON MINORITY WOMEN IN U.S. EVALUATE THE SAME CORNERSTONE EVEN LESS FAVORABLY.Inclusion and Diversity Survey MAKE IT MORE THAN A MANTRA
Mixed Chart
Accenture
View slide
Vertical bar chart with purple (“likely”) and teal (“unlikely”) indicators showing global sentiment on 13 tech-related predictions.
Strategic Planning
Technology & Software
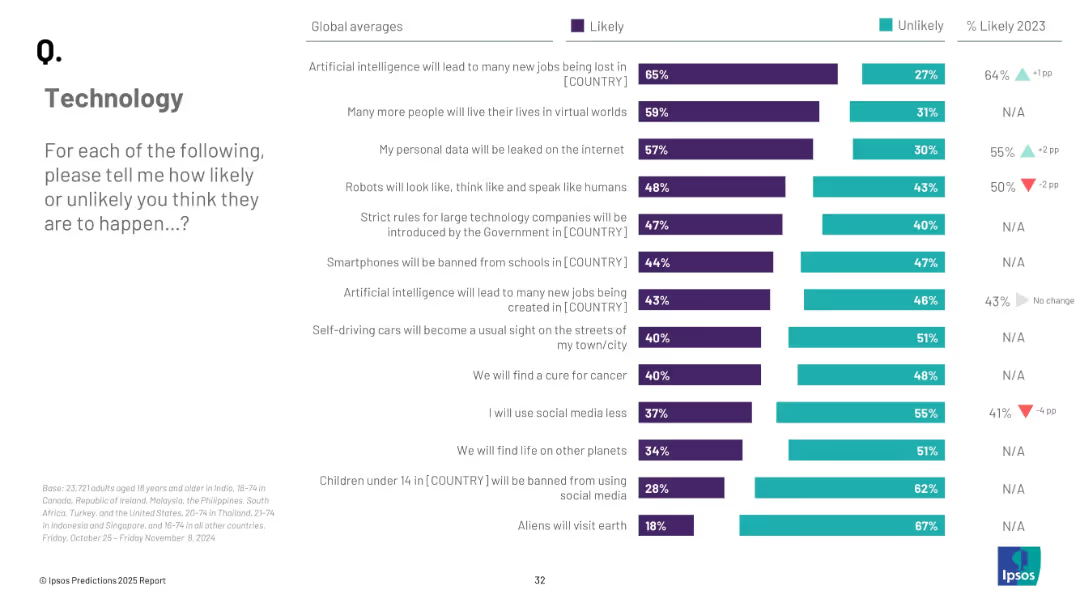
This global view slide presents public perceptions on technological advancements, such as AI’s impact on jobs, virtual worlds, and self-driving cars. It illustrates which innovations the global public believes are most likely to occur in 2025, with AI job loss and virtual living scoring highest in perceived likelihood.
technology, AI, virtual worlds, future predictions, innovation
false
TechnologyPREDICTIONS 2025 REPORT
Mixed Chart
IPSOS
View slide
Horizontally ranked bar chart with % values by country and a gender split table on the right; left side panel in blue for context and explanation.
Risk Assessment and Management
Government & Public Sector
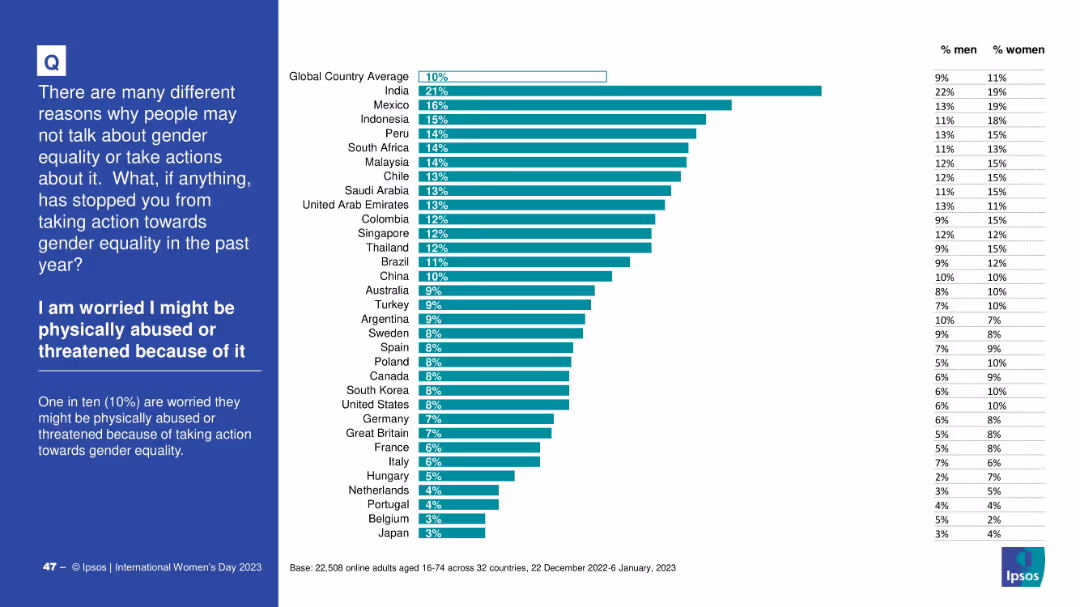
This slide shows the proportion of respondents by country who fear physical abuse or threats for taking action toward gender equality. India ranks highest at 21%. The global average is 10%, with a gender breakdown showing some differences.
threat, abuse, fear, gender equality, country comparison, survey data, risk, Ipsos
false
I am worried I might be physically abused or threatened because of itINTERNATIONAL WOMEN'S DAY 2023
Mixed Chart
IPSOS
View slide
This slide compares current customer experience metrics with future goals using bullet points and lists, divided by a central arrow indicating direction.
Strategic Planning
Financial Services
This slide compares current customer service ratings and future improvement areas for a bank, emphasizing the need for more resilient platforms and a tailored servicing model to achieve best-in-class customer experiences, thus guiding strategic customer service enhancements.
Customer Experience, Service Quality, Improvement
false
Better customer experience and outcomes: where we need to do moreFY 2023 Results Announcement
Linear Flow
Barclays
View slide
Column chart on aging PE portfolios with EV/EBITDA line; right-side explanation
Risk Assessment and Management
Financial Services
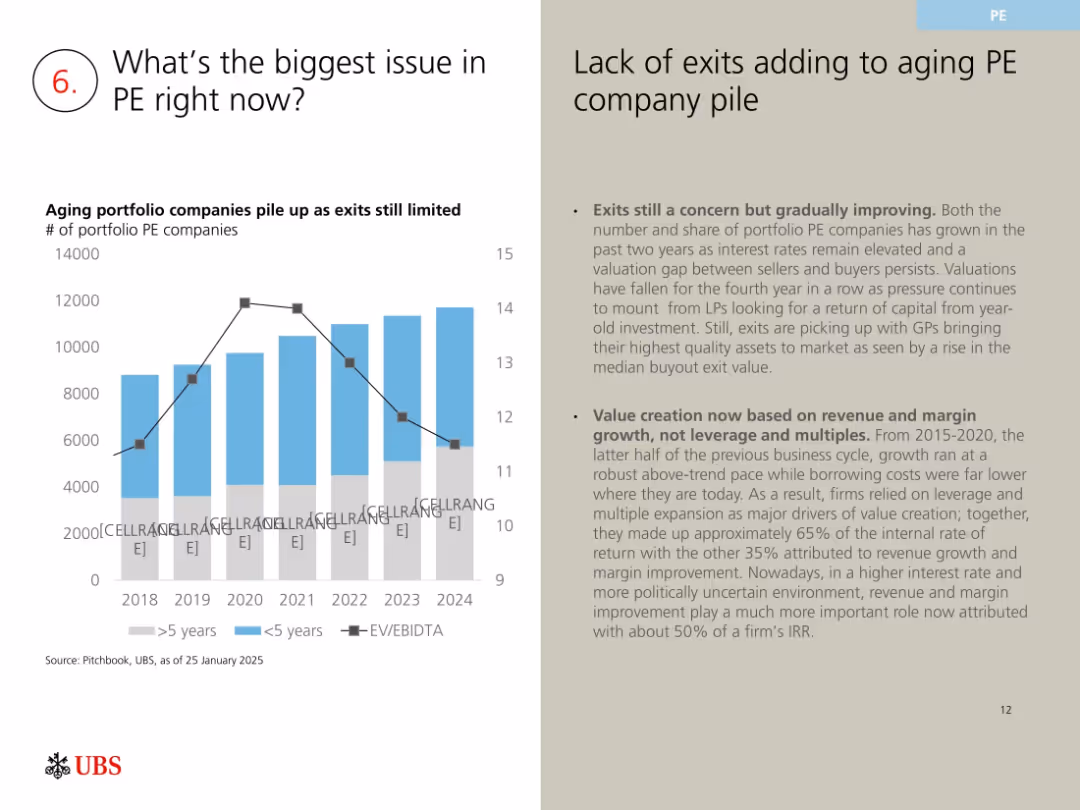
Discusses limited exit activity in private equity, leading to aging portfolios. Notes valuation compression, limited buyer interest, and shift from leverage-based value to margin/revenue-based growth due to macroeconomic shifts.
private equity, exit backlog, valuations, EV/EBITDA, aging portfolio, PE concerns
false
What’s the biggest issue in PE right now?The CEO Macro Briefing Book
Mixed Chart
UBS
View slide
Features a map of the UK with key points listed about market growth, emphasizing the UK's strengths such as regulatory environment and London as a financial centre.
Market Analysis and Trends
Financial Services
The slide argues for the strategic timing of expanding financial operations in the UK, emphasizing national economic resilience, strong regulatory frameworks, and London’s role as a global financial hub, supporting a strategic business decision for market expansion.
UK Market, Growth, Strategy, Financial Hub
false
Now is the right time to grow in our UK home marketFY 2023 Results Announcement
Graphic
Barclays
View slide
Slide with a title at the top, three columns with blue and black text. The left column has monetary values, the middle column has checkmarks and benefits, and the right column has progress details in blue boxes.
Financial Performance
Financial Services
The slide outlines the opportunity, value proposition, and progress plan in building transaction banking services, including deposit balances, onboarding, and team development.
Banking, Deposit Balances, Analytics, Onboarding, Team Building
false
Build Transaction BankingGoldman Sachs Investor Day
Table
Goldman Sachs
View slide
This slide includes a title, column charts contrasting the number of cases finalised per FTE in FCoA and FCC, and a sidebar explaining differences in judicial output.
Regulatory and Compliance
Government & Public Sector
The slide details the differences in case finalisation per FTE between FCoA and FCC, with a focus on the lower finalisation rate in FCoA despite its higher number of non-judicial staff, pointing to differences in case complexity.
judicial efficiency, FCoA, FCC, finalisation rate, full-time equivalent, case complexity
false
Accounting for differences in finalisation there still remains a significant difference in judicial outputReview of efficiency of the operation of the federal courts
Multiple Chart
PwC/Strategy&
View slide
Text and line chart showing the UK's leading position in new investment projects in Europe.
Market Analysis and Trends
Financial Services
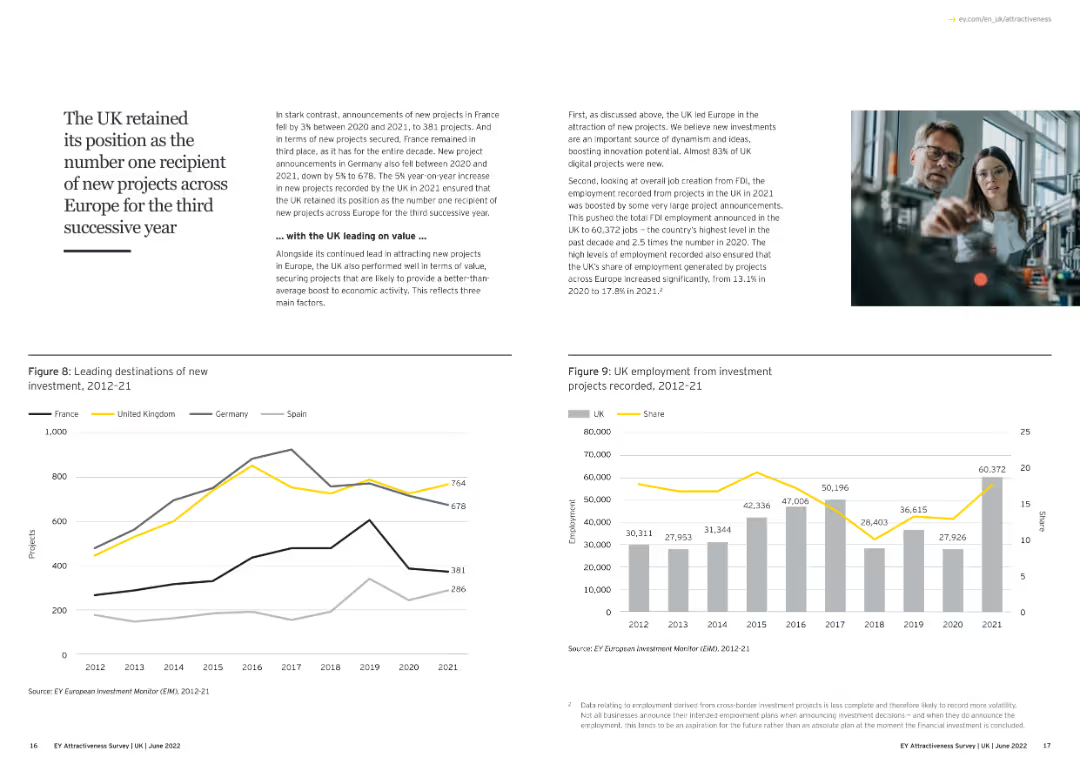
The slide highlights the UK's continued leadership in attracting new FDI projects across Europe for the third successive year, emphasizing the economic benefits and job creation resulting from these investments.
UK, FDI, Leadership, New Projects, Economic Benefits
false
The UK retained its position as the number one recipient of new projects across Europe for the third successive yearAdapting to a changed world EY Attractiveness Survey
Multiple Chart
EY
View slide
Column chart comparing distribution yields per share with share prices across Swiss real estate funds.
Financial Performance
Real Estate & Construction
Compares the distribution yield per share with the share prices of various Swiss real estate funds.
real estate, distribution yield, share price, comparison, funds
false
Distribution yield of Swiss Real Estate funds Distribution per share compared to the share priceSwiss Real Estate Funds At a glance
Single Chart
Credit Suisse
View slide
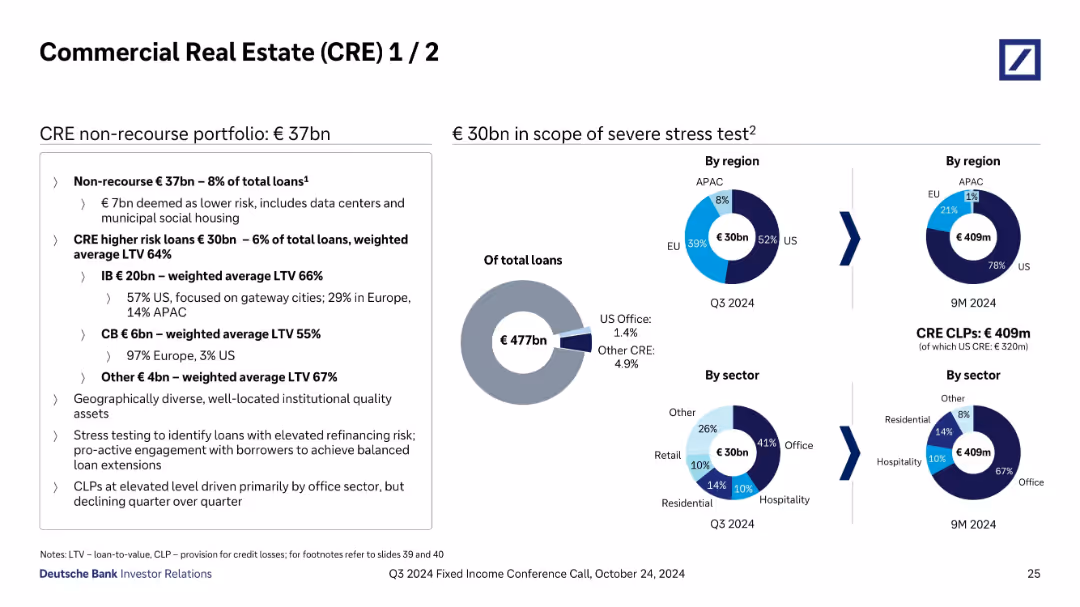
Multiple donut charts showing CRE stress testing exposure by region and sector; text box outlines risk mitigation and portfolio quality.
Risk Assessment and Management
Financial Services
Covers Deutsche Bank’s €37bn non-recourse CRE portfolio, with €30bn in stress testing. Portfolio is diversified by region and sector, with most risk in US office segment. Stress testing identifies refinancing risk, and Q3 2024 CRE CLPs total €409m, largely driven by US office exposure.
CRE, non-recourse, stress testing, US office, CLPs, risk, Deutsche Bank, Q3 2024
false
Commercial Real Estate (CRE) 1 / 2Q3 2024 Fixed Income Investor Conference Call
Mixed Chart
Deutsche Bank
View slide
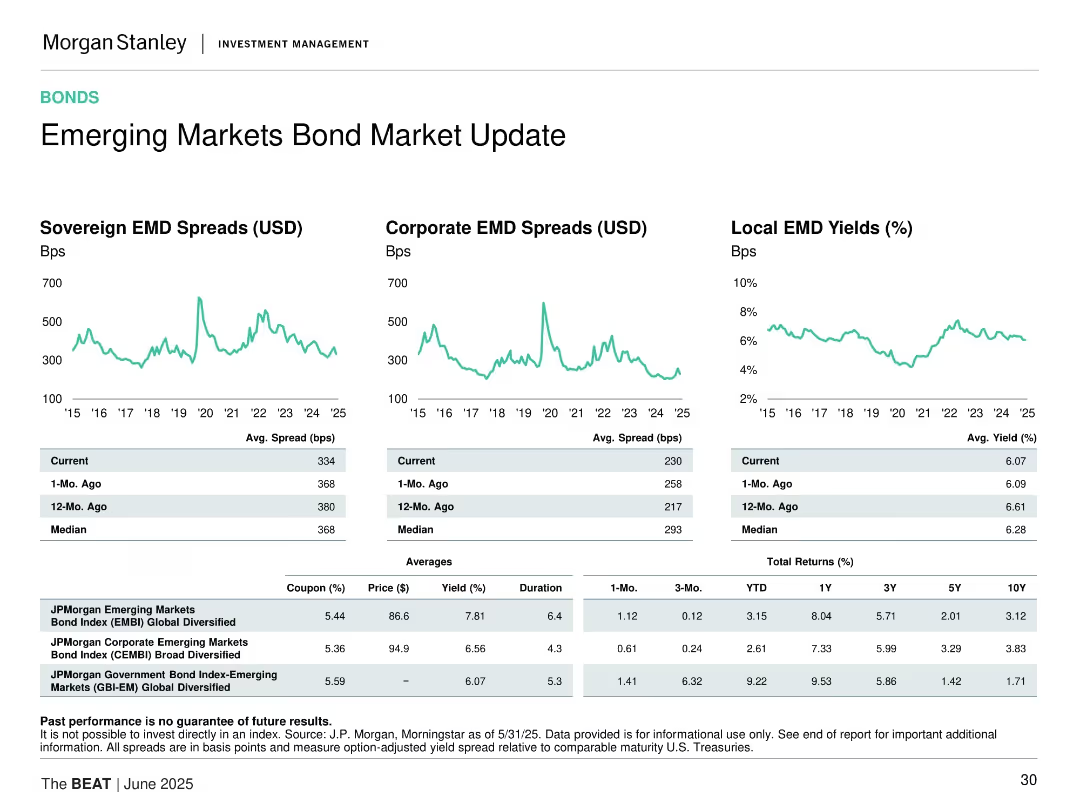
Three time-series graphs for sovereign, corporate, and local EM bonds; tables for spread, yield, and returns.
Market Analysis and Trends
Financial Services
Reviews sovereign and corporate bond spreads and local bond yields in emerging markets, comparing current data vs. past and averages, with return tables.
emerging markets, bond spreads, sovereign debt, corporate bonds, yield, returns, fixed income, investment strategy
false
Emerging Markets Bond Market UpdateThe BEAT June 2025
Multiple Chart
Morgan Stanley
View slide
Displays column charts comparing net new households and wealth management referrals over several years. The graphs are accompanied by textual explanations and key growth drivers.
Strategic Planning
Financial Services
Discusses the organic growth and enterprise connectivity strategies, highlighting new household acquisition and referral trends within the business, underpinned by a variety of strategic growth drivers.
Organic Growth, Enterprise Connectivity, Net New Households, Wealth Management, Referrals, Growth Drivers, BAC, Market Connectivity
false
Organic Growth and Enterprise Connectivity Power Our BusinessMorgan Stanley Financials Conference
Multiple Chart
Morgan Stanley
View slide
Image of a man working on a laptop. Column chart illustrating additional operational resilience requirements expected from regulators in the next two years.
Regulatory and Compliance
Financial Services
This slide highlights additional operational resilience requirements expected from regulators, such as higher standards for monitoring critical third-party service providers and heightened oversight expectations. It underscores the growing trend towards stricter regulatory standards in risk management and compliance.
operational resilience, regulatory requirements, third-party, monitoring, compliance
false
No discussion of risk management in insurance is complete without acknowledging the increasing scrutiny from regulators around the world,Risk management in a time of transformation
Mixed Chart
EY
View slide
The slide features two main sections with column charts: the top section shows total PE/VC investments over time, and the bottom section splits investments across different asset classes.
Investment Analysis
Financial Services
This slide presents monthly trends in PE/VC investments, displaying total investment values and the distribution across various asset classes.
PE/VC investments, monthly trends, asset classes, investment values, financial analysis
false
PE/VC monthly headline trends: investments Total PE/VC investmentsWhy do uncertain times need a certainty of purpose? February 2023
Multiple Chart
EY
View slide
Features column charts, icons, and illustrations depicting the telecommunications industry's growth. Includes charts on internet speeds and telecommunications gross output.
Market Analysis and Trends
Telecommunications
Discusses advancements in the Philippine telecommunications industry, including increased internet speeds and mobile usage.
telecommunications, Philippines, internet, growth, output
false
In December 2020, the Philippines ranked 96th out of 139 countries in terms of mobile internet speed, an improvement of 14 notches from the previous month, based on the Ookla Speedtest Global Index.Doing business in the Philippines 2021
Mixed Chart
Deloitte
View slide
Bar chart showing recent average Z-spread and change relative to average for various sectors with commentary on the right.
Risk Assessment and Management
Financial Services
Highlights the perceived credit risk in the financial, real estate, and energy sectors due to recent US bank failures.
Bond spreads, financial sectors, risk, credit, US
false
In the wake of recent US bank failures, perceived credit risk has risen the most for companies in the financial, real estate and energy sectorsMarch Macro Brief Financial fissures emerge
Mixed Chart
Accenture
View slide
A balance of text and graphics, showing the bank's strengths and how it aligns with J.P.Morgan's strategies, accompanied by a pie chart.
Mergers and Acquisitions
Financial Services
Slide compares the business models of First Republic Bank and J.P.Morgan, focusing on client service, credit performance, and strategic alignment. Suitable for M&A context or business model comparison.
First Republic Bank, client service, credit performance, strategic alignment, loan portfolio, high-growth markets, talent acquisition
false
First Republic Bank –building on our strengthInverstors Day 2023
Mixed Chart
JP Morgan
View slide
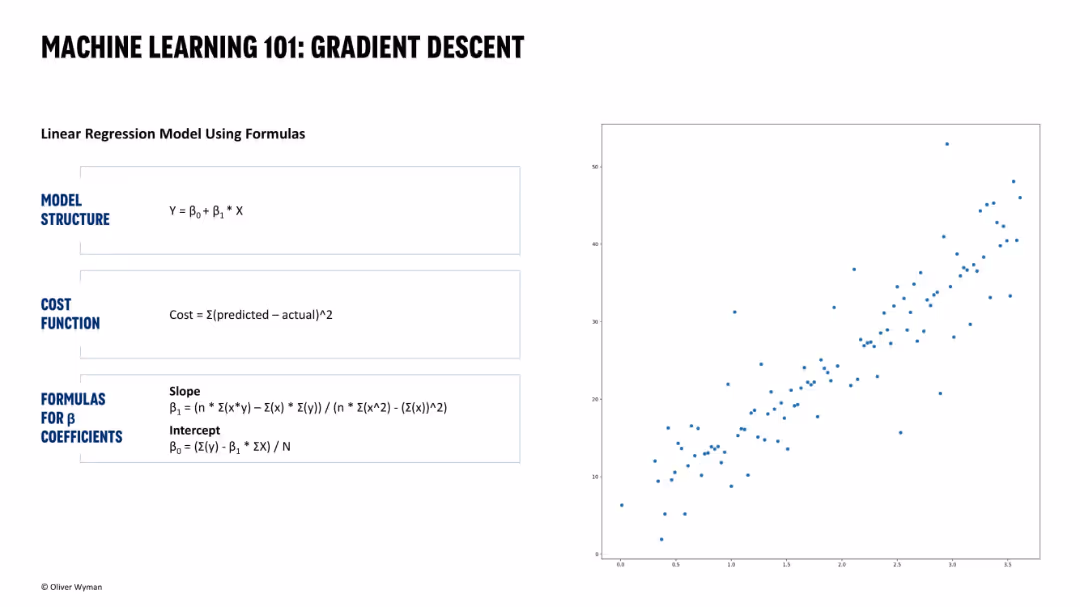
Left half shows linear regression formulas and cost function breakdown; right half displays a raw scatterplot. Simple and clean black-and-blue academic-style layout.
Technology and Digital Transformation
Artificial Intelligence
This introductory slide explains gradient descent using a linear regression example. It defines the model equation, cost function, and formulas for computing coefficients. A raw scatterplot helps visualize the data points the model is intended to fit. This slide is foundational and educative in nature.
gradient descent, machine learning, regression, cost function, linear model, scatterplot, formula
false
MACHINE LEARNING 101: GRADIENT DESCENTGPT-3 and the actuarial landscape
Single Chart
Oliver Wyman
View slide
Horizontal bar chart by country with strong pink title emphasis; percentage agreement shown; global average marked.
Risk Assessment and Management
Government & Public Sector
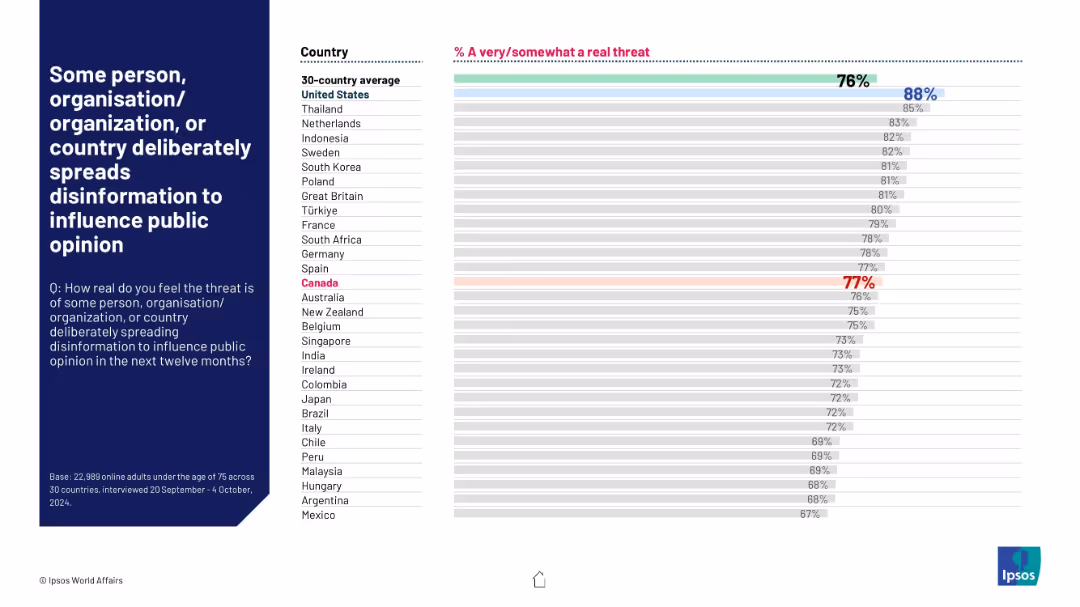
This slide captures public concern about disinformation campaigns. 76% globally see this as a real threat. The United States tops the list at 88%, followed closely by Thailand and the Netherlands. Canada is highlighted at 77%, indicating high awareness across regions.
disinformation, media trust, public opinion, misinformation, perception, security threat, Ipsos, global survey, political influence, digital risk
false
Some person, organisation/organization, or country deliberately spreads disinformation to influence public opinionWORLD AFFAIRS
Mixed Chart
IPSOS
View slide
Lists emerging, growing, and stabilizing trends in the luxury market with corresponding icons and brief descriptions, like collaborations, second-hand markets, and sustainability efforts.
Market Analysis and Trends
Retail & E-commerce
Summarizes the 2019 luxury market trends, focusing on the influence of casualwear, influencers, and digital media on consumer preferences and market dynamics.
luxury trends, market analysis, 2019, casualwear, influencers, digital media, sustainability, collaborations
false
True-Luxury Global Consumer Insight 2019 Edition: the 12 key trends2019 True-Luxury Global Consumer I nsight
Table
BCG
View slide
Stacked bar chart showing personal luxury goods market by category (2019–2027E) with YoY growth and CAGR on the right.
Market Analysis and Trends
Consumer Goods
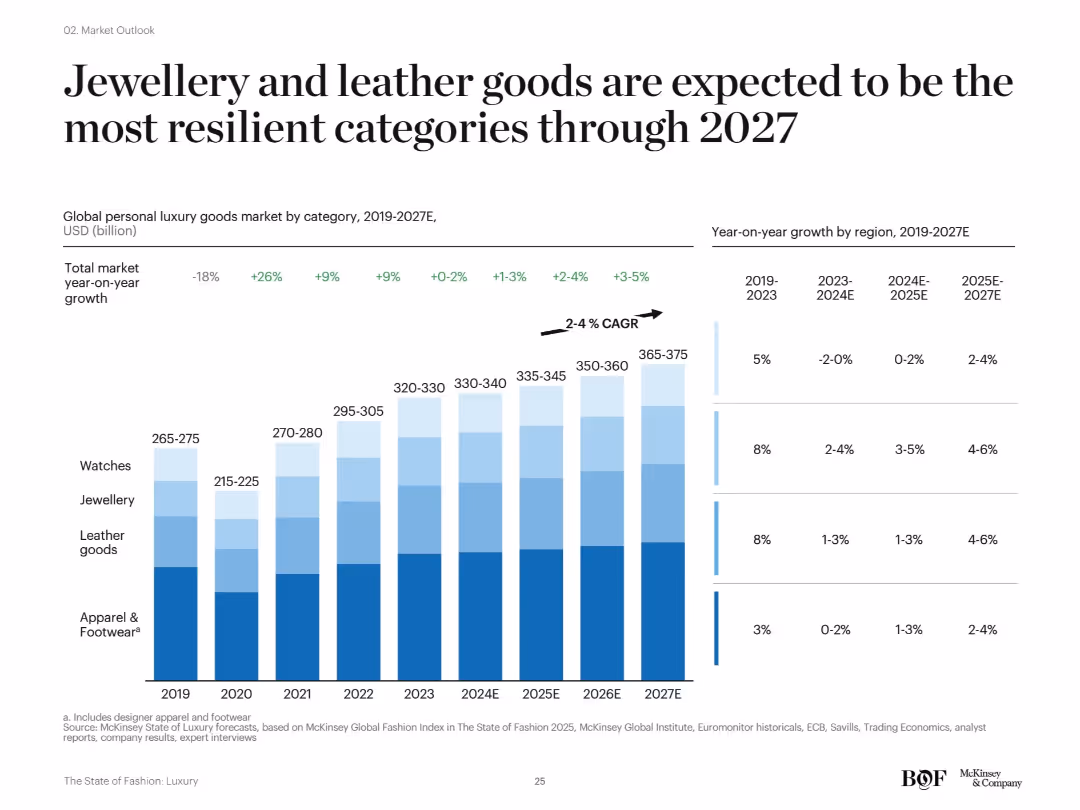
This slide shows projections of category-wise performance in the luxury market, identifying jewellery and leather goods as the most resilient segments. CAGR data through 2027 suggests steady growth, while apparel and watches are expected to recover more slowly.
jewellery, leather goods, growth resilience, luxury categories, CAGR, forecast, 2027
false
Jewellery and leather goods are expected to be the most resilient categories through 2027The State of Fashion Luxury
Single Chart
McKinsey
View slide
This slide features a complex line chart comparing inflation trends over time among the US, Eurozone, and UK. The chart is accompanied by detailed text explanations on both sides, highlighting key statistics and analysis.
Financial Performance
Financial Services
The slide compares inflation rates across developed economies with insights into potential economic rebounds and consumer confidence. It's suited for financial analysis presentations or economic briefings, offering a detailed view of inflation trends and their implications for future policies and decisions.
inflation, economic trends, line chart, developed economies, financial analysis, policy implications
false
Inflation has slowed to the lowest level since the middle of 2021, but disparities among countries persistGlobal Economics Intelligence (August 2023)
Mixed Chart
McKinsey
View slide
The layout is split into three sections for environment, social, and governance, each with bullet points and icons. At the bottom, there's a section with key FY19 highlights and corresponding icons.
Regulatory and Compliance
Financial Services
Showcases Macquarie's ESG commitment and achievements, outlining key principles, initiatives, and FY19 highlights, important for stakeholder engagement and showcasing corporate responsibility.
ESG, environment, social, governance, sustainability, corporate responsibility, Macquarie
false
Environmental, Social and Governance (ESG) Macquarie’s ESG commitment reflects our responsibility to clients, shareholders, communities, our people and the environment in which we operateGoldman Sachs 16thAnnual Australia and New Zealand Investment Forum
Table
Goldman Sachs
View slide
Stacked bar chart tracking number of mega-deals (> US$1bn) from 2015 to 2024 by buyer type; declining trend visible; segment colors match categories.
Performance Metrics and KPIs
Financial Services
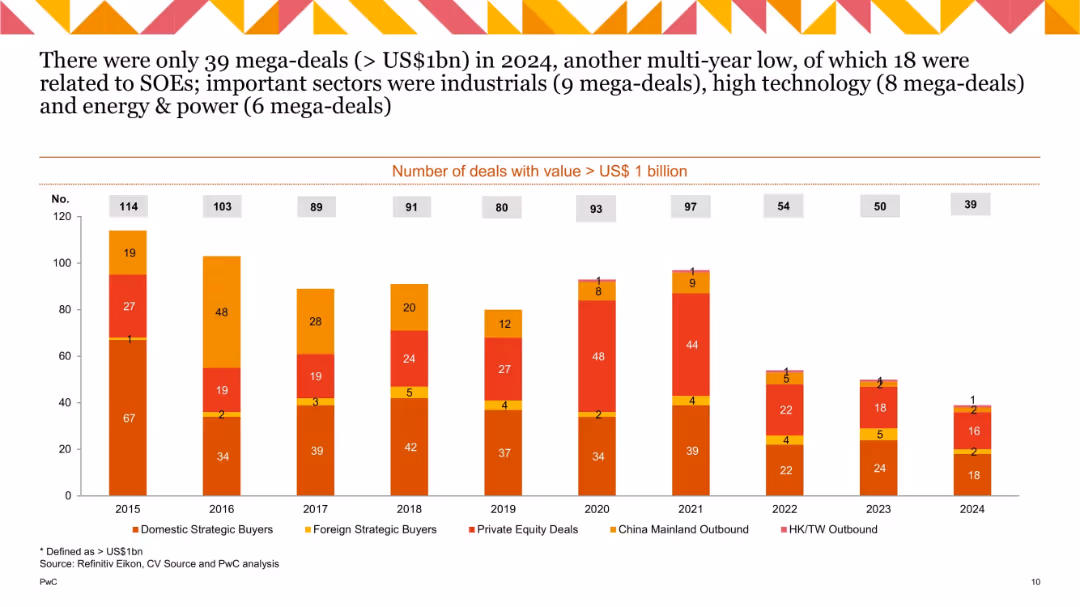
Tracks annual number of mega-deals by type. 2024 saw only 39, the lowest in a decade. Industrial, technology, and energy sectors dominated. Many were state-owned enterprise-driven, reflecting weak private mega-deal activity.
mega-deals, US$1bn, deal count, strategic buyers, SOEs, sectors
false
There were only 39 mega-deals (> US$1bn) in 2024China M&A 2024 Review and Outlook
Single Chart
PwC/Strategy&
1
...
Next
Load More
Hold On!
We are searching in our database
If nothing, comes up, please try different filters!
Create a FREE account to continue browsing
Receive Instant Access to 1,000+ slides from companies like McKinsey, Google, and Goldman Sachs
First Name
Last Name
Email
Password
I agree to all
Terms & Privacy Policy
Thank you! Your submission has been received!
Oops! Something went wrong while submitting the form.
Have an account?
Sign in
Column Chart
Heatmap
Chevron
Org Chart
Infographic
Callouts
Timeline
List
Graphic
Picture
Process Flow
Diagram
Paragraph
Map
Table
Framework
Subtitle
Takeaway Box
Icon
Other Chart
Radar Chart
Waterfall Chart
Mekko Chart
Pie Chart
Scatter Plot
Line Chart
Bar chart
Bullet points