My Account
My Slides
Leave Feedback
Login
Logout
Get Started
Browse all Slides
Browse Slides Pro
Create a FREE Account
Instant access to 1,000+ real slides from top companies like McKinsey, BCG, Goldman Sachs, Google and many more!
First Name
Last Name
Email
Password
I agree to all
Terms & Privacy Policy
Thank you! Your submission has been received!
Oops! Something went wrong while submitting the form.
Have an account?
Sign in
Instant access to the internet's best slides
Get access to 40+ advanced filters and more
Advanced Search and Filters
Access to
8,000+ slides
Access to Category Pages
Save/Bookmark Slides
PowerPoint Template Library (Coming Soon)
Choose your plan
MONTHLY
$12/month
Billed every month, cancel anytime.
YEARLY
$9/month
Billed $108 annually, cancel anytime.
Checkout for $12/month
Checkout for $108/yr
Secured by Stripe | AES-256 bit encryption
Welcome,
Welcome
Upgrade to SlideStart
Pro
Instant access to 8,000+ slides
Show Featured Only
Checkbox 8
Companies
Mckinsey
Bain
BCG
EY
Deloitte
Accenture
PwC/Strategy&
JP Morgan
Goldman Sachs
Morgan Stanley
Citigroup
Deutsche Bank
Barclays
LEK
Kearney
Oliver Wyman
Booz Allen Hamilton
Gartner
IPSOS
Nielsen
Slide type
Header Horizontal
Framework
Vertical Flow
Single Chart
Single Chart
Text Only
Mixed Chart
Header Vertical
Graphic
Pillar
Multiple Chart
Agenda
Title
Table
Linear Flow
Upgrade to SlideStart
Pro
Instant access to 40+ advanced filters
Industry
Upgrade to SlideStart
Pro
Instant access to 40+ advanced filters
Technology
Healthcare
Financial Services
Consumer Goods
Energy & Utilities
Manufacturing
Retail
E-commerce
Logistics
Telecommunications
Real Estate
Professional Services
Education
Media
Entertainment
Hospitatlity
Tourism
Agriculture
Food Production
Government & Public Sector
Environmental
Sustainability
Use Case
Upgrade to SlideStart
Pro
Instant access to 40+ advanced filters
Sales and Business Development
Mergers and Acquisitions
Corporate Finance and Valuation
Performance Metrics and KPIs
Client Case Studies
Competitive Landscape
Product and Service Analysis
Customer and Market Segmentation
Organizational Structure
Human Resources and Talent Management
Industry Overview
Regulatory and Compliance
Risk Assessment and Management
Agriculture & Food Production
Hospitality and Tourism
Government
Environmental
Sustainability
Clear all
Thank you! Your submission has been received!
Oops! Something went wrong while submitting the form.
Show Featured Only
Checkbox 8
Companies
Mckinsey
Bain
BCG
EY
Deloitte
Accenture
PwC/Strategy&
JP Morgan
Goldman Sachs
Morgan Stanley
Citigroup
Deutsche Bank
Barclays
LEK
Kearney
Oliver Wyman
Booz Allen Hamilton
Gartner
IPSOS
Nielsen
Slide type
Text Only
Linear Flow
Vertical Flow
Single Chart
Header Horizontal
Mixed Chart
Header Vertical
Pillar
Multiple Chart
Graphic
Agenda
Title
Table
Framework
Industry
Technology
Healthcare
Financial Services
Consumer Goods
Energy & Utilities
Manufacturing
Retail
E-commerce
Logistics
Telecommunications
Real Estate
Professional Services
Education
Media
Entertainment
Hospitatlity
Tourism
Agriculture
Food Production
Government & Public Sector
Environmental
Sustainability
Use Case
Sales and Business Development
Mergers and Acquisitions
Corporate Finance and Valuation
Performance Metrics and KPIs
Client Case Studies
Competitive Landscape
Product and Service Analysis
Customer and Market Segmentation
Organizational Structure
Human Resources and Talent Management
Industry Overview
Regulatory and Compliance
Risk Assessment and Management
Agriculture & Food Production
Hospitality and Tourism
Government
Environmental
Sustainability
Clear all
Thank you! Your submission has been received!
Oops! Something went wrong while submitting the form.
Tag
View slide
A combination slide with a table on the left showing a breakdown of loan portfolios and a pie chart on the right detailing corporate loans by industry. Key credit metrics are presented below the table. The slide is data-heavy and designed for an analytical audience.
Financial Performance
Financial Services
The slide provides an overview of loan portfolio allocations and credit quality with specific focus on corporate loans distribution across various industries. It also includes key credit metrics like net charge-off rates. This could be used in investor briefings to explain the company's asset quality and credit management.
Asset Quality, Credit Overview, Loan Portfolio, Corporate Loans, Credit Metrics, Industry Distribution
false
Asset Quality & Credit OverviewFixed Income Investor Presentation
Mixed Chart
Goldman Sachs
View slide
This slide presents a structured list with the table of contents for the ESG report, detailing different sections such as leadership, business, and approaches to ESG.
Regulatory and Compliance
Professional Services
The table of contents for the 2022 ESG report, outlining key sections and page numbers, functioning as a navigational guide for readers.
Contents, ESG, Sections, Structure, Professional
false
Table of Contents2022 Environmental, Social, Governance Report
Agenda
Booz Allen Hamilton
View slide
Includes a line graph and a column chart comparing global trade intensity and trade barriers, alongside detailed textual analysis, on a background of purple and white tones.
Strategic Planning
Energy & Utilities
Analyzes the shift towards economic nationalism and its effects on Australia's energy strategies, discussing global trade trends and barriers in relation to energy independence.
economic nationalism, trade barriers, global trends, energy strategy, Australia, geopolitical analysis
false
Efforts to build sovereign energy capabilities align with a broader global trend towards economic nationalismCharging Ahead Australia’s battery powered future
Multiple Chart
Accenture
View slide
A comparative slide with a grid layout, comparing offline and online channels for different stages of vehicle purchase and aftersales, including information gathering, testing, purchase, and care.
Sales and Business Development
Retail & E-commerce
The slide compares online and offline channels for different stages of the vehicle purchase process, highlighting that online channels dominate for information gathering, but offline for testing and purchase.
car buyers, online channel, offline channel, vehicle purchase, customer lifecycle, information gathering, pre-purchase testing, purchase, customer care
false
While potential car buyers prefer an online channel for gathering vehicle information, dealerships continue to be prominent at other stages of the customerinteraction lifecycleEY Mobility Consumer Index (MCI) 2023 study
Multiple Chart
EY
View slide
Split design detailing the benefits of engaging with ML on the left, and the risks and uncertainties on the right.
Technology and Digital Transformation
Technology & Software
Discusses the advantages and risks involved in ML industrialization, aiming to guide leadership in their strategic decisions.
ML, leadership, benefits, risks, AI adoption
false
What should leaders consider when engaging with the trend?McKinsey Technology Trends Outlook 2022 Industrializing machine learning
Boxed
McKinsey
View slide
The slide features two column charts showing the value that ESG projects bring to companies over time, comparing increased revenue and brand credibility across different time spans (less than 1 year, 2-5 years, 5-10 years, and 10+ years).
Market Analysis and Trends
Environmental Services & Sustainability
This slide emphasizes the long-term financial benefits of ESG initiatives, showing how companies with mature ESG programs see increased revenue and brand credibility over various time periods. It highlights the importance of sustained ESG efforts for long-term gains.
ESG, revenue, brand, long-term, benefits
false
What value do current ESG projects bring to your company?ESG maturity research and findings in Croatia
Multiple Chart
Kearney
View slide
Slide contains three column charts displaying factors affecting regional attractiveness in Île-de-France, Auvergne-Rhône-Alpes, and Hauts-de-France. Red header, white background, blue columns, annotations for data percentages.
Market Analysis and Trends
Government & Public Sector
Analyzes main determinants for regional attractiveness in France, focusing on geographic location, workforce, and infrastructure across three specific regions.
regional analysis, determinants, France, Île-de-France, Auvergne-Rhône-Alpes, Hauts-de-France, workforce, infrastructure, attractiveness
false
Focus on 3 regions | Geographic location, workforce, quality of infrastructure and economic dynamism contribute most to the attractiveness of regionsBAROMETER AmCham-Bain 2024
Multiple Chart
Bain
View slide
The slide displays column charts representing debt underwriting league table rankings and net revenues, accompanied by textual analysis and bullet points. The layout is structured and information-dense.
Strategic Planning
Financial Services
Outlines the advancement in client coverage in investment banking, highlighting league table rankings, net revenue, and client engagement strategies.
Investment Banking, Client Coverage, League Table, Net Revenue, Engineering, Client Engagement, Debt Underwriting, Strategy
false
Investment Banking Progress in client coverageGoldman Sachs Presentation to Credit Suisse Financial Services Conference
Multiple Chart
Goldman Sachs
View slide
The slide is divided into two columns with a dark background and a green bar on the left side for the section title "Summary." The right column contains text in white and green, highlighting various points under the headers "The Race for Innovation" and "Innovation options." The design is clean, and there is an effective use of bold text and bullet points to organize information hierarchically, making it easy to scan and digest.
Strategic Planning
Technology & Software
This summary slide synthesizes the innovation trends and options companies are pursuing. It is used to encapsulate the core messages of the presentation, focusing on companies' abilities to adapt and innovate in response to COVID-19, the decline of incumbent advantages, and strategic innovation directions. The slide provides a quick overview and is likely intended to precede a more in-depth discussion on these topics.
innovation trends, options, COVID-19 adaptation, incumbent decline, strategic focus
false
Summary: The Race for InnovationBCG Executive Perspectives: The Race for Innovation
Agenda
BCG
View slide
Features a line chart tracking the usage of channel partners by companies over a decade. Each point is annotated for clarity, and different sectors are highlighted with distinct colors. The layout includes a text box that provides additional insights and context to the trend depicted.
Operational Efficiency
Retail & E-commerce
The slide analyzes the long-term trend of companies moving towards direct marketing, reducing reliance on channel partners. This is relevant for discussions on operational strategies in marketing and sales, highlighting sector-specific behaviors and strategic shifts.
disintermediation, channel partners, marketing trends, operational strategy, direct marketing
false
Disintermediation trend: Percentage of companies using channel partners hits returns to historic lowThe CMO Survey The Highlights and Insights Report February 2022
Mixed Chart
Deloitte
View slide
This slide presents a column chart visualizing the 'Efficiency Ratio' trend, along with a comprehensive table detailing various expense categories and their respective changes compared to prior periods.
Financial Performance
Financial Services
Offers a detailed view of the company's expenses, showcasing factors contributing to the efficiency ratio and providing context for the financial data, such as increased non-compensation expenses and changes in the effective tax rate.
Efficiency Ratio, Operational Expenses, Compensation, Depreciation, Technology, Professional Fees, Tax Rate, Financial Health
false
Expenses Financial ResultsFirst Quarter 2023 Earnings Results Presentation
Mixed Chart
Goldman Sachs
View slide
Combines text sections with key numerical highlights, icons for different services, and a large background image illustrating digital banking.
Industry Overview
Financial Services
Provides an overview of Macquarie's banking and financial services, highlighting FY19 net profit, BFS deposits, and loan portfolio, valuable for business development and market positioning analysis.
banking, financial services, net profit, deposits, loans, digital banking, technology
false
Banking and Financial Services A technology-driven Australian retail bank and wealth managerGoldman Sachs 16thAnnual Australia and New Zealand Investment Forum
Mixed Chart
Goldman Sachs
View slide
Slide divided into two halves; left side has text boxes with bullet points, right side has a timeline from 2015 to 2018 with key initiatives marked along it, indicating progress.
Strategic Planning
Financial Services
Details supplier onboarding time reduction efforts, highlighting digital transformation milestones and future focus areas. Useful for presenting historical achievements and forward-looking strategies in process optimization.
Digital Transformation, Onboarding, Efficiency, Timeline, Process Improvement, Strategy, Milestones, Future Focus, Legal, RPA
false
Supplier Experience Evolution: From Paper to DigitalTrade Working Capital Finance in 2018
Text Only
Citigroup
View slide
A slide comparing key financial metrics over three years, with blue column charts and tabular data representation.
Financial Performance
Financial Services
Analyzes JPMorgan Chase & Co.'s financial performance in 2019, emphasizing growth and client relationships.
Financial results, JPMorgan Chase, client focus, revenue growth, banking performance, comparative analysis, yearly metrics, business development
false
Strong results in 2019 driven by consistent client focusCOMMERCIAL BANKING 2020
Multiple Chart
JP Morgan
View slide
Includes tables and a process flow chart describing various service delivery models and their characteristics.
Operational Efficiency
Professional Services
Examines service delivery models focusing on efficiency, effectiveness, and the optimal allocation of tasks.
service delivery, efficiency, optimization, global, local
false
Service Delivery ModelStrategic Cost Transformation Grab’n Go session
Boxed
Deloitte
View slide
The slide features column charts comparing the number of women receiving antenatal care pre and post-solar power adoption, and the percentage of antenatal care coverage across Nigeria.
Strategic Planning
Healthcare & Pharmaceuticals
This slide assesses how solar power adoption in primary healthcare centers can meet antenatal care demands in Nigeria, highlighting significant improvements in service delivery with increased electricity access.
healthcare, solar power, antenatal care, Nigeria, electricity access, service improvement, ANC coverage
false
Survey findings reveal, enhancing PHC's access to elec. though solar could enable PHC's meet ANC demands, and increase ANC coverage by ~10-20%ptSocio-economic case for deepening solar PV deployment in Nigeria
Multiple Chart
BCG
View slide
The slide features a prominent image of a man writing, large text, and a two-tone circle graph. It uses high contrast and minimalistic design elements.
Operational Efficiency
Professional Services
The slide presents statistical data on the failure rate of organizational transformations, highlighting that 70% fail and only 30% reach their full potential. This slide could be used in strategic planning and change management meetings.
transformation, failure, statistics, organizations, change management, strategy, professional services, data presentation
false
Most transformations failThe Secret of Transformations
Single Chart
McKinsey
View slide
This slide showcases a close-up image of a wet umbrella, with annotations highlighting potential business challenges like Earnings miss, Liquidity crunch, etc.
Strategic Planning
Professional Services
Focuses on defining strategic goals for business resilience, enumerating critical challenges that businesses might face under stress.
Resiliency, Business challenges, Strategic planning, Liquidity, Bankruptcy
false
Defining your resiliency ambitionIntroduction to Bain & Company
Linear Flow
Bain
View slide
Similar to slide 1631, this one is structured with column charts, bar graphs, and a pie chart, showcasing media usage and service adoption rates in Thailand. It uses a color palette of blue and grey, with green highlighting the pie chart for emphasis.
Market Analysis and Trends
Technology & Software
This slide is a comparative analysis of digital consumer behavior in Thailand, detailing usage intent and media consumption. It reveals the adoption rates of digital services and the willingness to pay more for sustainable products and services, vital for understanding consumer priorities and market opportunities in Thailand.
digital consumers, Thailand, media usage, adoption rates, sustainability
false
Thailand: Digital consumers in numberse-Conomy SEA 2022 Through the waves, towards a sea of opportunity
Multiple Chart
Bain
View slide
The slide features bullet points under the headers "ECONOMIC VIEWS FOR 2022" and "THEMATIC VIEWS FOR 2022 AND BEYOND." The text is black on a white background with a blue header. Each column contains points of analysis regarding economic forecasts and trends.
Market Analysis and Trends
Financial Services
The slide presents economic forecasts for the year 2022, discussing the expected slowdown in GDP growth and the potential performance of US Treasuries. It also highlights thematic investment opportunities, focusing on long-term market leaders, digitalization, Asian development, and central bank policies. The content is tailored for financial professionals and investors seeking to understand the upcoming economic landscape and strategic investment areas.
economic forecast, GDP, inflation, EPS, digitalization, Asian development, longevity, central bank policies
false
ECONOMIC VIEWS FOR 2022Citi Global Wealth Investments OUTLOOK 2022
Header Horizontal
Citigroup
View slide
Segmented pyramid chart showing three categories of lighting end-users: high-end image creators, mainstream professionals and prosumers, and amateurs
Customer and Market Segmentation
Consumer Goods
The slide provides an overview of lighting end-user segments, detailing the needs and characteristics of each segment
segmentation, lighting, end-users, professionals, amateurs
false
Lighting end-users can be segmented into high-end image creators, mainstream professionals and prosumers, and amateurs…Project Spiritus Final report Market Study
Framework
EY
View slide
Features a column chart detailing the reconciliation of ERR scalar for Japan from 2015 to current with steps outlined in text.
Market Analysis and Trends
Financial Services
This slide explains the reconciliation process of the ERR scalar for Japan, detailing the steps involved and the resulting scalar value for 2023.
Japan, ERR scalar, financial services, market trends, reconciliation
false
COUNTRY-SPECIFIC DETAILED ANALYSIS – JAPANScalar calibration For Life insurance business
Mixed Chart
Oliver Wyman
View slide
The final slide features bold text with graphic icons in a minimalistic style, delivering a clear and motivational message.
Strategic Planning
Financial Services
A conclusive slide with a motivational statement, often used as a call to action in marketing or closing presentations.
motivation, forward, progress, action
false
KEEP MOVING FORWARDKEEP MOVING FORWARD
Title
JP Morgan
View slide
The slide features a white background with text and a column chart showing company-level ESR ratios for Japan. It discusses Japan's transition to a new capital regime (ESR) by 2025, including changes to regulatory intervention points and the use of company-level data for initial calibration of the ESR scalar.
Regulatory and Compliance
Financial Services
This slide provides an example of a regime change in Japan, focusing on the move to an economic value-based capital regime (ESR) and the use of company-level data for calibration. It highlights the upward trend in ESR ratios and the expected analysis refresh in 2025.
Japan, regime change, ESR, capital regime, calibration
false
REGIME CHANGE EXAMPLE: JAPANScalar calibration For Life insurance business
Mixed Chart
Oliver Wyman
View slide
This slide contains several columns and textual analysis divided into multiple sections. It uses a two-column layout with icons representing population and migration.
Market Analysis and Trends
Professional Services
This slide discusses strategies for entering growing markets, addressing older demographics, and using city developments as business opportunities. Intended for strategic business reviews.
population growth, market entry, older demographics, city development, strategic planning
false
Corporate actions Let's talk about … opportunities arising from population and migration megatrendsRoland Berger Trend Compendium 2030: Megatrend 1 People & Society
Header Vertical
Roland Berger
View slide
Two column charts: Left chart illustrates asset growth in billions from Q4 2019 to Q1 2022. Right chart shows bank assets as a percentage of firmwide assets from Q4 2019 to Q1 2022. A box lists key growth drivers. The footer includes strategic statements about asset utilization.
Financial Performance
Financial Services
This slide compares the growth of assets over time and the allocation of assets within bank entities, highlighting key drivers such as financing activities and liquidity. The focus is on strategic asset growth and bank support for client activities.
asset growth, financing activities, liquidity, bank entities, strategic placement, column chart
false
Balance Sheet Dynamics and Bank EntitiesFixed Income Investor Presentation
Multiple Chart
Goldman Sachs
View slide
The slide presents a color-coded heatmap comparing global manufacturing PMIs, with varying shades indicating performance levels. The complex data is efficiently organized for at-a-glance analysis.
Market Analysis and Trends
Industrial & Manufacturing
Offering a comparative analysis of global manufacturing health, this slide is critical for assessing economic activity and could influence investment decisions in financial and manufacturing sectors. It is structured to provide quick insights into industry performance trends.
PMIs, Global, Manufacturing, Analysis
false
Manufacturing PMIs Were Mixed in Q4 and Remain Weaker Compared to Early 2022Credit Market Monitor
Table
Morgan Stanley
View slide
Presents break-even inflation rates over time through a dual-line graph, accompanied by a clear, concise analysis.
Investment Analysis
Financial Services
Evaluates long-term investor expectations of inflation, likely used in financial services to inform investment strategies.
inflation expectations, US Treasury yields, investment analysis, economic forecast, inflationary pressures, market trends, financial planning
false
Investors continue to expect strong inflationary pressures over the medium to long termGlobal Economics Intelligence
Single Chart
McKinsey
View slide
Utilizes bar charts to display projected vaccine production capacities by various manufacturers, highlighting planned figures for end-2020 and end-2021.
Regulatory and Compliance
Healthcare & Pharmaceuticals
Evaluates the global vaccine production capabilities and strategies, with emphasis on scaling up to meet anticipated demand.
vaccine, manufacturing, scale-up, capacity
false
Manufacturing set-up & scale-up | Developers rapidly augmenting capacity; several governments putting mechanisms for early accessVaccines & Therapeutics Outlook Part I: Timelines and Success Factors
Mixed Chart
BCG
View slide
Simple layout with a single column chart illustrating consumer responses to purchasing second-hand luxury items.
Market Analysis and Trends
Retail & E-commerce
Focuses on the reasons driving consumer interest in second-hand luxury products, including perceived value and exclusivity.
Second-hand luxury, consumer behavior, purchasing reasons, perceived value, exclusivity, market insights, consumer trends
false
Most True-Luxury consumers interested in purchasing luxury 2nd-hand products2019 True-Luxury Global Consumer I nsight
Mixed Chart
BCG
View slide
The slide features a column chart comparing the market value of crypto investment funds held in 2022 and 2023, with values ranging from less than $1,000 to over $1,000,000. There is also a side-by-side comparison for broader value ranges.
Market Analysis and Trends
Financial Services
This slide shows the distribution of market values of crypto investment funds for 2022 and 2023, indicating trends and changes over the two years. It can be used to analyze market behavior and investment patterns.
Crypto, Investment, Market Value, Trends, Comparison
false
Market Value of Crypto Investment Funds Held The approximate current market value reported by those who own crypto investment funds remained consistent with 2022.CRYPTO ASSET SURVEY 2023
Mixed Chart
IPSOS
View slide
The slide presents a series of column charts comparing the average hours spent online per day for personal use in six Southeast Asian countries, across three time phases labeled before, during, and after.
Market Analysis and Trends
Technology & Software
This slide shows the trends in internet usage in Southeast Asia, highlighting an increase with the Philippines showing the most significant rise. It's useful for analyzing digital engagement and behavior changes.
internet usage, Southeast Asia, Philippines, column chart, before, during, after, personal use, trend
false
Hours spent online per day rises, with highest spike in Philippinese-Conomy SEA 2020 At full velocity: Resilient and racing ahead
Single Chart
Bain
View slide
Multiple line graphs track retail goods sales, excluding auto and fuel, across various countries.
Strategic Planning
Retail & E-commerce
Discusses the shift in retail sales during the pandemic, comparing growth or decline across months and countries, offering insights into consumer behavior changes.
retail sales, trends, pandemic, analysis
false
Retail goods sales (excluding auto and fuel) have grown compared with pre-COVID-19 levels in most countriesWhat the Evolution of Travel Means for Business
Table
BCG
View slide
Bar chart showing the most disliked aspects of vehicle financing, using different shades of green. The layout is straightforward and highlights key dislikes.
Risk Assessment and Management
Transportation & Logistics
This slide addresses the challenges and frustrations consumers face with vehicle financing, particularly the dislike for waiting for approval and completing paper-based forms, providing insights into improving customer experiences.
Financing challenges, consumer dissatisfaction, process improvement, vehicle loans
false
Waiting for approval and completing paper-based forms are the most disliked parts of the financing process for survey respondents seeking a loan or lease.2024 Global Automotive Consumer Study
Single Chart
Deloitte
View slide
Column charts showing underlying revenues, costs, PBT, and key metrics
Financial Performance
Financial Services
Highlights financial performance metrics for 1Q24, including revenues, costs, PBT, and key metrics
financial, performance, 1Q24, metrics
false
Strong financial performance in 1Q24 with positive operating leverageFirst quarter 2024 Financial results
Multiple Chart
UBS
View slide
The slide features two doughnut charts showing Southeast Asia’s investment values for 2012 and 2016, focusing on Singapore and Indonesia.
Market Analysis and Trends
Financial Services
Highlights the investment trends in Southeast Asia, with Singapore as the main hub and significant growth in Indonesia’s investment values.
Southeast Asia, Investment, Singapore, Indonesia, Trends
false
Within Southeast Asia, Singapore remains the main hub but other countries are quickly catching up, with Indonesia leading the wayIndonesia Venture Capital Outlook 2017
Single Chart
Kearney
View slide
A pie chart labeled "2018 Sales Mix" showing Eaton's business divisions and sales distribution among different sectors such as vehicle, aerospace, and electrical products.
Market Analysis and Trends
Industrial & Manufacturing
Showcases the sales distribution across Eaton's diverse business units, aligning with market trends and highlighting Eaton's strategic positions in multiple sectors.
sales distribution, Eaton, market trends, business units
false
Eaton combines leading power management businesses that capitalize on these secular trendsDeutsche Bank Global Industrials & Materials
Mixed Chart
Deutsche Bank
View slide
This slide features a line chart depicting the Global economic policy uncertainty index from 1997 to 2022, and a column chart showing year-over-year percent change in real GDP from 2019 to 2024 for various regions and countries. It uses a blue and white color scheme with clear labels and legends.
Market Analysis and Trends
Financial Services
The slide analyzes persistent inflation and elevated interest rates, showcasing global economic policy uncertainty and projected real GDP changes for different regions and countries, suggesting these as continued characteristics of the economic slowdown.
inflation, interest rates, economic slowdown, GDP, policy uncertainty
false
Persistent inflation and elevated interest rates are likely to be continued characteristics of this slowdown2023 Global Macroeconomic Outlook
Multiple Chart
EY
View slide
The slide contains two charts: one bar chart showing analyst questions to oil majors about energy transition, and one line chart showing regional gas price spreads.
Market Analysis and Trends
Energy & Utilities
This slide addresses concerns about energy transition and gas price trends, useful for understanding industry responses and market conditions.
energy transition, gas prices, oil majors, analyst questions, market fundamentals
false
US majors respond to analyst concerns about energy transition Regional gas price spreads back to pre pandemic levelsEY Price Point: global oil and gas market outlook Q2 | April 2021
Multiple Chart
EY
View slide
This slide showcases a column chart comparing awareness of DeFi marketing from crypto trading platforms between 2022 and 2023, with percentages of responses.
Market Analysis and Trends
Financial Services
It presents data on the awareness of DeFi marketing, showing a drop in people recalling such ads, and highlighting differences across age and gender demographics.
DeFi, crypto trading platforms, marketing, 2023, 2022, awareness, demographics, ads
false
Advertising From Crypto Trading Platforms about DeFiCRYPTO ASSET SURVEY 2023
Mixed Chart
IPSOS
View slide
Features dual column charts detailing leverage exposure and risk-weighted assets in various categories, with textual overlays indicating specific figures and changes over quarters.
Risk Assessment and Management
Financial Services
Provides a comprehensive view of the bank's leverage exposure and risk-weighted assets, crucial for assessing financial stability and compliance with regulatory capital requirements. Aids in internal risk assessments and informing stakeholders about financial positioning and risk management strategies.
leverage exposure, risk-weighted assets, financial stability, regulatory compliance, risk management
false
Leverage exposure and risk-weighted assetsQ4 / FY 2023 results
Multiple Chart
Deutsche Bank
View slide
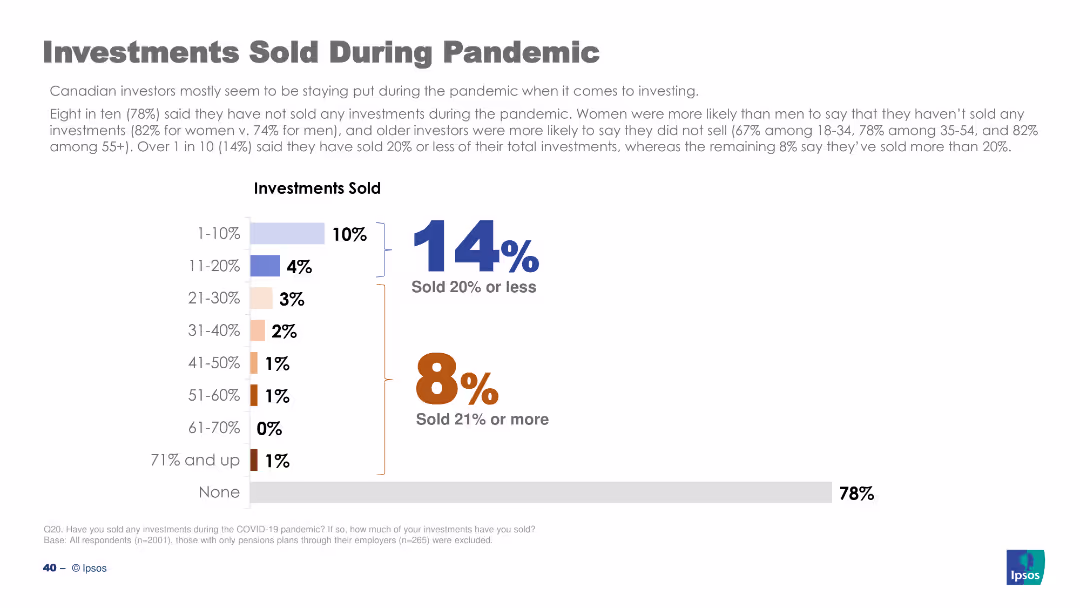
The slide features a column chart showing percentages of investments sold during the pandemic, with text describing the data. Clean white background.
Market Analysis and Trends
Financial Services
This slide presents data on the percentage of investments sold by Canadian investors during the pandemic, highlighting that most investors did not sell their investments.
investments sold, pandemic, Canadian investors, data analysis, COVID-19
false
Investments Sold During PandemicINVESTING AND THE COVID-19 PANDEMIC
Mixed Chart
IPSOS
View slide
The slide includes column charts showing sales and EBITDA growth for Q2 2020. Bullet points provide details on growth drivers and margin expansion.
Financial Performance
Agriculture & Food Production
This slide reviews Crop Science's financial performance in Q2 2020, focusing on sales and EBITDA growth, driven by regional performance and volume growth, despite challenges in specific markets.
Crop Science, Sales Growth, EBITDA, Margin Expansion, Q2 2020
false
Q2 2020: Crop Science with strong margin expansionScience for a Better Life
Multiple Chart
Credit Suisse
View slide
Slide presents a quadrant layout with icons and brief text blocks highlighting aspirations in customer experience, business model, IT, and profitability.
Strategic Planning
Financial Services
Sets forth the aspirational goals for various aspects of the banking business, providing a strategic overview. It’s suitable for discussions on aligning business objectives with technology and customer expectations.
Aspirational Goals, Strategy, Digital Business, Customer Experience, IT Efficiency, Profitability, NPS
false
Aspirational GoalsBBVA - Thinking Ahead Morgan Stanley European Financials Conference 2016
Pillar
Morgan Stanley
View slide
The slide features a dark blue color scheme with a line chart comparing Goldman Sachs and U.S. Peer Average BVPS growth over a 10-year period, and a bar chart showing GS's outperformance in 3, 5, and 10-year spans. There's a bullet point list on the left outlining capital management philosophy.
Financial Performance
Financial Services
This slide presents Goldman Sachs' prudent capital management over the years, highlighting significant returns of capital, net income, and growth in BVPS compared to its peers, likely used in financial reviews or investor presentations.
Capital management, BVPS, financial growth, performance, Goldman Sachs
false
Proven History of Prudent Capital ManagementGoldman Sachs Investor Day
Multiple Chart
Goldman Sachs
View slide
A bar graph contrasts the percentage of early-stage versus late-stage funding rounds in the technology sector over time, supported by textual analysis.
Investment Analysis
Technology & Software
This slide contemplates the investment pattern shifts in the technology sector over the years, highlighting a move towards more significant later-stage funding rounds. It places this trend within the context of historical cycles, suggesting a consistent pattern of evolution in the sector's investment stages. The graphical representation combined with the analytical text provides a clear and concise overview of how funding preferences have developed, corresponding with industry maturity and investor confidence.
funding trends, later-stage investment, technology sector, market cycles, venture capital
false
While there has been a shift towards later-stage funding, this seems to be consistent with the longer-term cycleAssessing the Impact of Big Tech on Venture Investment
Single Chart
Oliver Wyman
View slide
Slide with three column charts and related imagery reflecting strategies for different customer segments like Youth and Families, Low-to-Moderate Income, and Affluent.
Customer and Market Segmentation
Financial Services
Targeted at showing tailored approaches for diverse customer segments, focusing on specific banking products and services offered.
segmentation, value proposition, banking, customers, services, youth, income, affluent, strategy, products
false
We are tailoring value propositions to meet the distinct needs of customers across segmentsConsumer & Community Banking
Multiple Chart
JP Morgan
View slide
Comparative bar charts displaying GDP growth forecasts against baseline for 2020 and 2021, offering a global perspective with specific focus on major economies.
Financial Performance
Financial Services
Offers insights into the projected global economic downturn in 2020 and recovery prospects for 2021, based on GDP growth forecasts from various sources.
GDP growth, economic forecasts, 2020 downturn, 2021 recovery, global economy, financial analysis, investment planning
false
Economic forecasts deteriorating globally for 2020 while remaining stable for 2021COVID-19 BCG Perspectives Publication #5 with a focus on Revamping Organizations for the New Reality
Multiple Chart
BCG
View slide
The slide contains a column chart showing total PE/VC exits over months and a stacked column chart splitting exits across asset classes. It uses a line chart to show the number of exits, creating a dense and informative visual that highlights trends over time.
Market Analysis and Trends
Financial Services
This slide illustrates the monthly trends in PE/VC exits, showing total exit values and the number of exits across various asset classes. It helps in analyzing exit trends over time, essential for understanding market behavior and planning exit strategies.
PE/VC, exits, trends, asset classes, number of exits
false
PE/VC monthly headline trends: exitsWhy do uncertain times need a certainty of purpose? April 2023
Multiple Chart
EY
View slide
Slide includes two column representations. The design is comprehensive with a systematic arrangement of sections, facilitating a clear understanding of complex processes.
Strategic Planning
Environmental Services & Sustainability
Discusses strategies to enhance the viability and scale of projects within the carbon trading sector, emphasizing regulatory improvements and market accessibility. It also highlights key actions for accelerating growth and development in the sector.
scalability, carbon trading, regulations, market access, strategic actions
false
Ability to scale is capped by project viability, and implementation of Article 6 frameworks; full potential can be quickly unlocked with better access and policiesSoutheast Asia’s Green Economy 2022 Report
Header Horizontal
Bain
View slide
Line graph comparing consumer sentiment over time in five countries regarding the ongoing impact of COVID-19.
Market Analysis and Trends
Consumer Goods
Tracks changes in consumer sentiment during the COVID-19 pandemic across different regions, useful for market analysis in consumer goods industries.
COVID-19, consumer sentiment, market analysis, trends, regions
false
Consumers starting to display more optimistic outlook than two weeks agoCOVID-19 BCG Perspectives Publication #5 with a focus on Revamping Organizations for the New Reality
Single Chart
BCG
View slide
The slide displays a split circular diagram divided into four segments, each with icons representing different tax amendments for 2018. The design uses bold colors like orange and red to denote different areas like Charitable activities and Foreign income taxation.
Regulatory and Compliance
Government & Public Sector
This slide presents proposed tax amendments for Namibia in 2018, detailing changes in taxation for dividends, trusts, foreign income, and charitable activities, aimed at discussing potential revenue impacts and legislative changes in a budget review.
tax, amendments, revenue, Namibia, 2018, dividend, trust, foreign, income, charitable
false
Resident Dividend Tax = 10%Re-Imagine the Possible 2018/2019
Framework
PwC/Strategy&
View slide
This slide presents a line chart showing the growth in the number of financing rounds of Swiss startups from 2012 to 2020, along with multiple bullet points detailing innovations and academic contributions to the startup environment.
Industry Overview
Professional Services
The slide focuses on the financial evolution of Swiss startups, showcasing a consistent increase in financing rounds over the years. It also discusses local innovation hubs and academic influences driving the startup landscape.
Swiss startups, financing rounds, innovation, academic influence, growth
false
Investment by sector & canton 2020The Swiss FoodTech Ecosystem 2021
Mixed Chart
Accenture
View slide
This slide displays two column charts comparing the types of podcast ads by announcer-read/pre-produced versus host-read and other ads between 2019 and 2020, showing growth in announcer-read ads.
Market Analysis and Trends
Media & Entertainment
Examines the preference shift in podcast advertising towards announcer-read/pre-produced ads, suggesting a trend towards greater control in ad messaging.
podcast ads, announcer-read, pre-produced, supplied ads, messaging control, 2019-2020
false
Announcer-read/pre-produced and supplied ads offered buyers more messaging controlU.S. Podcast Advertising Revenue Study
Single Chart
PwC/Strategy&
View slide
Features a bar graph with different industries represented by colored bars, indicating the percentage breakdown of survey respondents.
Market Analysis and Trends
Media & Entertainment
Provides an industry breakdown of survey participants, which can be used for analyzing market distribution and consumer segments.
Industry Breakdown, Survey Respondents, Market Distribution, Consumer Segments, Percentage Breakdown
false
Sample composition - breakout by industryConsumers at 250
Single Chart
Kearney
View slide
The slide features a column chart showing adjusted revenue progression in USD mn from 3Q16 to 2019, with segmented revenue sources and costs.
Financial Performance
Financial Services
This slide outlines expected improvements in revenue loss by 2019, driven by de-risking and legacy funding reduction.
revenue progression, adjusted revenue, de-risking, legacy funding, financial performance
false
Revenue progressionCredit Suisse Investor Day 2016
Single Chart
Credit Suisse
View slide
Presents column charts comparing business goals in digital transformation efforts among companies.
Technology and Digital Transformation
Technology & Software
Analyzes the shift in focus from cost-cutting to customer-centric goals in digital transformation strategies.
digital marketing, business transformation, customer-centric, innovation, digital
false
Around 90% of Companies Now List Customer-Facing Goals Among Their Top Business Objectives for Digital TransformationThe Evolving State of Digital Transformation
Mixed Chart
BCG
View slide
Comprised of three sectioned column charts detailing investment expenses in different areas. The design is structured with color coding for ease of comparison and interpretation.
Investment Analysis
Financial Services
JPMorgan Chase's slide presents a multi-year investment strategy across business sectors, technology, and marketing. It demonstrates the firm's commitment to growth and adaptation in response to evolving market needs.
Investment Strategy, Long-term Success, Business Growth, Technology, JPMorgan Chase
false
We continue to invest in positioning the Firm for long term successInverstors Day 2023
Multiple Chart
JP Morgan
View slide
Scatter plots showing the spread in authorization and paid amount for residential and day habilitation levels.
Market Analysis and Trends
Government & Public Sector
Analyzes the spread in payments for residential and day habilitation services, highlighting the impact of individual budget allocations and budget modifications on provider revenue needs.
rate methodology, authorization, paid amount, residential habilitation, day habilitation, budget allocations, provider revenue, NH's DD population
false
DD | 1915(c) Waiver Redesign: Rate Methodology | Analysis (1 of 2)NH DHHS Operations Assessment
Multiple Chart
Alvarez & Marsal
View slide
Features a woman with a laptop and a red, techy backdrop. The slide details strategies for organizations to tackle digital transformation challenges.
Technology and Digital Transformation
Professional Services
Presents actions for businesses to ensure digital transformation success, emphasizing talent strategy, learning systems, and operational model alignment.
digital transformation, talent strategy, learning systems, operational model, agility
false
To address the above organizational challenge and ensure delivery of digital transformation successes, businesses need to consider the following actions:Southeast Asia's digital consumers: A new stage of evolution
Boxed
Bain
View slide
This slide is a timeline with visuals representing the company's strategy to achieve net-zero climate impact by 2030. It includes a bar chart showing the baseline and target reductions in greenhouse gas emissions. The visuals and text are well-organized and provide clear targets and strategies, using a palette of blue, white, and gray.
Corporate Finance and Valuation
Environmental Services & Sustainability
Outlines the company's commitment and strategic plan for reducing its climate impact, with targets set for 2025 and 2030. It's used to communicate the environmental goals and milestones to stakeholders, demonstrating the company's sustainability efforts and progress.
Climate Impact, Net-zero Strategy, Greenhouse Gas Reduction, Sustainability Goals, Environmental Commitment
false
Net-zero climate impact roadmapAccelerating Sustainable and Inclusive Growth
Mixed Chart
McKinsey
View slide
The slide includes column charts comparing the levelized cost of mobility per passenger for ICE buses, fuel cell buses, and BEV buses in 2030 under different scenarios.
Market Analysis and Trends
Energy & Utilities
The slide discusses the potential competitiveness of fuel cell electric buses compared to battery electric and internal combustion engine buses, highlighting cost projections and trends.
LCOM, FCEV buses, BEV, ICE, competitiveness
false
Declining LCOH and acquisition cost reduction triggered by mass production could make FCEV buses competitive with BEV and ICEHydrogen applications and business models
Mixed Chart
Kearney
View slide
Pie chart showing the share of blockchain startups by country and a column chart projecting blockchain business value for different use cases from 2021 to 2030.
Technology and Digital Transformation
Technology & Software
The slide highlights the diverse applications of blockchain technology beyond cryptocurrencies, showcasing its use in various sectors. It includes data on the distribution of blockchain startups globally and projects the significant increase in business value derived from blockchain by 2030.
Blockchain, Startups, Business Value, Use Cases
false
As another core digital technology, blockchain continues to change and impact processes by its unique ownership defining characteristicMegatrend 5 - Technology & Innovation
Multiple Chart
Roland Berger
View slide
Features pie charts and column charts detailing harassment and microaggressions in the workplace, with annotations explaining the data points. The design ensures easy comparison of statistics between Gen Z and Millennials.
Market Analysis and Trends
Professional Services
Details the prevalence of non-inclusive behaviors in workplaces affecting Gen Z and Millennials, with data on types of harassment experienced and reporting rates.
harassment, workplace, Gen Z, Millennials, non-inclusive behavior, reporting rates
false
Non-inclusive behaviors arestill widespreadMental health today A deep dive based on the 2023 Gen Z and Millennial survey
Multiple Chart
Deloitte
View slide
Contains a large pie chart detailing the frequency of Generative AI usage among users, accompanied by a bar graph showing specific usage rates from daily to less frequent.
Market Analysis and Trends
Technology & Software
Discusses the infrequent use of Generative AI tools by those who have tried them, pointing to potential usability or interest barriers.
Generative AI, usage frequency, user engagement, technology utilization, survey data
false
Most people who have used Generative AI are infrequent usersDigital Consumer Trends 2023
Mixed Chart
Deloitte
View slide
Displays column charts comparing the importance of analytical versus creative skills among marketing leaders.
Operational Efficiency
Professional Services
Analyzes trends in the prioritization of analytical skills over creative expertise in marketing, driven by data-intense market demands.
marketing, analytics, creative, skills, leadership, technology, efficiency
false
FIGURE 1 Chief marketing officers often identify analytical expertise as a more important skill than creative expertise Chief marketing officers who identified analytical and creative expertise as top skills2022 Global Marketing Trends
Mixed Chart
Deloitte
View slide
An advanced layout that includes a series of bar graphs comparing the company's CRE concentration to its peers. Each bar graph is dedicated to a different aspect of CRE concentration, such as "Other CRE," "Multifamily," and "Office CRE." The slide is information-dense, using different shades of blue and gray to differentiate between the company and its peers.
Competitive Landscape
Financial Services
The slide compares the company’s commercial real estate (CRE) concentration to that of its peers, highlighting a strategic position of having the lowest CRE concentration. It serves to underline the company's prudent risk management practices in loan portfolio distribution.
CRE Concentration, Competitive Analysis, Risk Management, Real Estate, Loan Portfolio, Peer Comparison, Strategy, Market Position
false
Lowest CRE concentration relative to peersMorgan Stanley US Financials, Payments, & CRE Conference
Multiple Chart
Morgan Stanley
View slide
Features a bar chart ranking the top outcomes automotive companies target through digital transformation, like anomaly detection and improved supply chain efficiencies.
Risk Assessment and Management
Transportation & Logistics
Highlights specific outcomes automotive companies aim to achieve by scaling digital proofs of concept, emphasizing improvements in operations and management efficiencies.
automotive, digital transformation, anomaly detection, supply chain, operational efficiency
false
ANOMALY DETECTION AND PURCHASE ORDER MANAGEMENT ARE KEY OUTCOMES…AUTOMOTIVE –OES
Single Chart
Accenture
View slide
Slide with a column chart showing RWA outlook to 2026, including annotations on NCL reduction, model updates, and Basel III finalization.
Risk Assessment and Management
Financial Services
The slide projects a decrease in RWA by approximately 35 billion due to optimization and NCL unwind, with detailed breakdowns and timelines.
RWA outlook, NCL reduction, Basel III, model updates, UBS risk management
false
RWA expected to decrease by ~35bn due to optimization and NCL unwindFourth quarter 2023 Fixed Income investor presentation
Mixed Chart
UBS
View slide
This slide features four images, each representing a different development project, with corresponding cost estimates and timelines from 2022 to 2035. The images have an 'artist impression' label, indicating they are conceptual representations. There is also a footnote about the manager's monitoring of development under contract compliance with regulations.
Strategic Planning
Real Estate & Construction
Depicts a timeline of major construction projects within a real estate portfolio, showing investment in development projects currently underway or in planning stages.
Development Pipeline, Real Estate Projects, Construction Investment, Projected Costs, Timeline, Regulatory Compliance
false
Projected +€250 million developments pipelineMorgan Stanley Conference Investor presentation
Image
Morgan Stanley
View slide
The slide features a combination of column charts showing top concerns for Gen Zs and Millennials, with text explanations on the left. It uses a clear layout to present statistical data on societal concerns.
Risk Assessment and Management
Financial Services
This slide discusses the primary societal concerns for Gen Zs and Millennials, highlighting the top worries including cost of living, unemployment, and climate change, with statistical comparisons between the two groups.
Societal concerns, cost of living, unemployment, climate change
false
Cost of living, unemployment, and climate change lead the list of societal concerns2023 Gen Z and Millennial Survey
Multiple Chart
Deloitte
View slide
Matrix chart showing the dynamics of occupations due to automation, with job losses and gains across various sectors like transport, healthcare, and construction.
Market Analysis and Trends
Technology & Software
This slide analyzes the structural changes in the labor market due to automation, robotics, and AI. It presents a matrix of job dynamics, highlighting which sectors are likely to experience job losses or gains, and emphasizes the transformative impact of technology on employment.
Labor Market, Automation, Robotics, Job Dynamics
false
The labor market faces structural change: Jobs that can easily be handled by automation, robotics and AI will experience declines While others benefitMegatrend 5 - Technology & Innovation
Table
Roland Berger
View slide
Contains bulleted lists, icons, small text, two columns
Industry Overview
Technology & Software
Explains benefits of CAI in customer service
CAI, customer service, ML models, CSAT
false
Transforming Customer Experience with Conversational AITrends & AI in the Contact Center
Header Vertical
Deloitte
View slide
The slide depicts a timeline of alerting, understanding, reacting, and recovery from disruptions in operations, supported by a line graph showing time intervals for different companies.
Technology and Digital Transformation
Industrial & Manufacturing
Explains the timeline and strategies for companies to become resilient against disruptions, detailing the stages from being alerted to fully recovering and the technologies involved.
disruption response, recovery strategies, operational resilience, timeline analysis, technology role, Accenture Research
false
Action 01 Invest in visibility, predictability and continuity-focused techResiliency in the making
Mixed Chart
Accenture
View slide
The slide contains a simple title section and a central list with circular icons connected by a vertical line, representing areas of improvement. There's a blue and teal color scheme with additional icons, and the design is clean with a balanced use of space.
Market Analysis and Trends
Retail & E-commerce
This slide reviews areas for enhancement within digital platforms, pinpointing the need for more promotions, lower fees, and better customer engagement. By identifying these top areas, the slide provides actionable insights for platform improvement and growth, catering to merchant feedback and emphasizing cost-effectiveness and user experience enhancements as pivotal.
digital platforms, improvement, promotions, transaction fees, user engagement, merchant feedback
false
Digital platforms have unlocked unprecedented scale, but there’s still room for improvement around discounts and feese-Conomy SEA 2021 Roaring 20s: The SEA Digital Decade
Vertical Flow
Bain
View slide
This slide features a colorful organizational chart with six primary segments, labeled 'Services', 'Markets', 'Banking', 'Global Wealth Management', 'US Personal Banking', and 'Legacy Franchises'. These are further broken down into sub-categories, each denoted by a different color.
Organizational Structure and Change
Financial Services
The slide outlines Citigroup's new operational segments, displaying a clear hierarchy of services and markets. This is likely used to convey the company's restructured approach to financial reporting, emphasizing the segmentation within both international and North American markets.
Financial, Reporting, Structure, Segmentation, Hierarchy, Citigroup, International, North America, Banking, Wealth Management
false
New Financial Reporting Structure As Of End Of 4Q23Earnings Results Presentation
Framework
Citigroup
View slide
A straightforward column chart displaying the total deal value in the Healthtech sector over time, with a summary of key points in text to the side. The chart is highlighted with selective coloring to draw attention to the increasing trend.
Investment Analysis
Healthcare & Pharmaceuticals
The slide showcases Healthtech's increasing deal values over the years, with a record peak in H1 2021. It emphasizes the sector's resilience and potential for future growth, suggesting a strong market presence and investor interest.
Healthtech, Deal Value, Growth, Investment, SEA
false
Healthtech outperforms landmark year, with further upside aheade-Conomy SEA 2021 Roaring 20s: The SEA Digital Decade
Mixed Chart
Bain
View slide
Uses a vertical flow diagram to depict the integration and enhancements in client solutions, with emphasis on digital transformation and payment solutions.
Technology and Digital Transformation
Financial Services
Describes JPMorgan’s initiatives to adapt and expand its client solutions, focusing on digital platforms like InstaMed and payment optimization, aimed at enhancing client engagement and satisfaction.
Client Solutions, Digital Transformation, Payments, Innovation, Engagement, Satisfaction
false
Investing to enhance our offerings and adapt to emerging and unmet client needsCommercial Banking 2022
Header Horizontal
JP Morgan
View slide
Includes a column chart for ASEAN-6 y/y CPI (2023-2025F), a line chart for unemployment and real earnings growth rate (2016-2025F), and a bar chart for total trade.
Market Analysis and Trends
Financial Services
Analyzes disinflation trends in ASEAN, economic risks, and central bank policies. Discusses inflation, earnings growth, and trade outlook.
Disinflation, ASEAN, CPI, Trade, Earnings
false
Disinflationary forces are likely to remain in place through 2024, notwithstanding El Niño and geopolitical risks, allowing central banks to gradually ease policyGlobal economic outlook: finding balance in 2024
Multiple Chart
EY
View slide
A column chart compares avoided CO2 emissions and abatement costs versus coal turbines for various grid utilizations (wind, solar, grid wind, grid solar) by 2030.
Market Analysis and Trends
Energy & Utilities
The slide evaluates the CO2 emissions reduction potential and costs of converting coal turbines to P2P systems coupled with renewable energy sources.
CO2 emissions, abatement cost, coal, turbines, P2P, renewable, grid, wind, solar
false
Avoided CO2 and abatement cost vs. coal turbinesHydrogen applications and business models
Multiple Chart
Kearney
View slide
Contains line graphs representing the value-at-risk and stressed value-at-risk metrics over multiple quarters, with comparative data.
Risk Assessment and Management
Financial Services
Analyzes the bank's financial risk metrics, specifically value-at-risk and stressed value-at-risk, to gauge risk management effectiveness over time.
risk, VaR, sVaR, banking, metrics, management, analysis, financial
false
Value-at-Risk / stressed Value-at-Risk (VaR / sVaR) In € m, unless stated otherwiseQ2 2023 results
Multiple Chart
Deutsche Bank
View slide
Pyramid graphs, text overlays and column chart
Market Analysis and Trends
Retail & E-commerce
Predicts expansion of luxury market consumer base.
luxury, customer base, 2025, Asia
false
THE LUXURY CUSTOMER BASE WILL CONTINUE TO BE ENLARGED FROM THE BOTTOM DRIVING FUTURE GROWTH OF THE ENTRY-PRICE SEGMENTBAIN-ALTAGAMMA 2019 WORLDWIDE LUXURY MARKET MONITOR
Multiple Chart
Bain
View slide
This slide consists of four column charts contrasting average attendances for final order finalisation in FCoA and FCC, split into non-trial and trial attendances, annotated with percentage differences. The design is clear with red and yellow colors.
Regulatory and Compliance
Government & Public Sector
The slide analyzes court attendances per final order finalisation, revealing a stark contrast between trial and non-trial cases, and between FCoA and FCC, suggesting a double attendance requirement for FCoA litigants proceeding to trial.
court attendances, trial, non-trial, FCoA, FCC, final order finalisation
false
Family law finalisationsReview of efficiency of the operation of the federal courts
Mixed Chart
PwC/Strategy&
View slide
Features pie charts and bullet points detailing real estate investment distributions by type and region. Clean and structured layout with annotations.
Investment Analysis
Real Estate & Construction
Discusses the real estate portfolio's distribution and risk, useful for investment analysis and decision-making in real estate.
real estate, investment, risk analysis, portfolio distribution, CRE
false
Commercial Real Estate (CRE) 1 / 2Client & Creditor Overview
Multiple Chart
Deutsche Bank
View slide
Column chart displays the investment deal values in Indonesia's internet sector over time, including the number of deals.
Investment Analysis
Technology & Software
The slide highlights investment trends in Indonesia's internet sector, with data on deal values and the number of deals from 2016 to H1 2020.
Investment, Internet sector, Indonesia, Deal value, Trends, 2016, 2020, Number of deals
false
Indonesia Investment in Internet sectore-Conomy SEA 2020 At full velocity: Resilient and racing ahead
Single Chart
Bain
View slide
A complex slide with pie charts and bar graphs comparing the percentages of different types of shoppers and their preferences, also lists the barriers and benefits of online shopping in the fashion industry.
Market Analysis and Trends
Retail & E-commerce
This detailed slide dissects the barriers faced by non-buyers and occasional shoppers in the fashion e-commerce domain, juxtaposing them with the preferences of frequent shoppers. It serves to analyze factors affecting consumer decisions in online fashion purchasing.
Fashion e-commerce, shopping barriers, consumer preferences
false
Fashion: Lack of touch and feel and immediacy deters usersDigital consumer spending in India: A $100 Bn opportunity
Mixed Chart
BCG
View slide
Bar chart displaying the impact of COVID-19 on savings goals. The chart compares the percentage of respondents who stopped or continued saving for each goal. A summary at the top provides context.
Risk Assessment and Management
Financial Services
The slide details how the COVID-19 pandemic affected Canadian investors' savings goals, showing the proportion who stopped saving for goals like travel, education, and retirement. It highlights demographic and income differences in the impact of the pandemic on savings behavior.
COVID-19, Savings, Goals, Canadian, Pandemic, Impact
false
Savings Goals Stopped Due to the COVID 19 PandemicINVESTING AND THE COVID-19 PANDEMIC
Mixed Chart
IPSOS
View slide
A line chart displays U.S. Treasury yield curves for different periods, accompanied by a table with yield and performance data for various securities.
Investment Analysis
Financial Services
Slide features U.S. Treasury yield curves over time, providing insights into market expectations of future interest rates and economic health. The data is essential for financial market analysis and investment decisions.
U.S. Treasury, Yield Curves, Interest Rates, Market Analysis, Investment, Economy
false
U.S. Treasury YieldsMonthly Market Monitor November 2023
Mixed Chart
Morgan Stanley
View slide
Sequential illustration of blockchain transaction process using a horizontal flow diagram with icons representing each step from transaction initiation to final addition to the blockchain.
Technology and Digital Transformation
Technology & Software
Describes the detailed steps of a blockchain transaction, from initiation to validation, and permanent addition to the digital ledger, emphasizing transparency and security. Designed for educational purposes on blockchain technology mechanics.
blockchain, transactions, digital ledger, security, validation
false
Blockchain technology can serve as the backbone for digital transactions involving exchange in currencies, data, or assetsBlockchain and Digital Assets
Linear Flow
McKinsey
View slide
The slide has a dark backdrop with a split layout showing a large blue bar graph on the left and a segmented bar on the right. It employs contrasting colors to highlight different categories of data, with the main focus on customer rewards for data access.
Customer and Market Segmentation
Retail & E-commerce
It showcases strategies for consumer incentivization for data access, highlighting the predominance of traditional rewards. It is useful for discussing customer engagement tactics and market segmentation strategies in retail and consumer goods industries.
Incentives, Data Access, Consumer Engagement, Rewards, Market Segmentation, Retail, Consumer Goods
false
While 92% of respondents incentive consumers for data access, they rely on traditional rewardsConsumers at 250
Multiple Chart
Kearney
1
...
Next
Load More
Hold On!
We are searching in our database
If nothing, comes up, please try different filters!
Create a FREE account to continue browsing
Receive Instant Access to 8,000+ of the internet's best slides
First Name
Last Name
Email
Password
I agree to all
Terms & Privacy Policy
Thank you! Your submission has been received!
Oops! Something went wrong while submitting the form.
Have an account?
Sign in
Column Chart
Heatmap
Chevron
Org Chart
Infographic
Callouts
Timeline
List
Graphic
Picture
Process Flow
Diagram
Paragraph
Map
Table
Framework
Subtitle
Takeaway Box
Icon
Other Chart
Radar Chart
Waterfall Chart
Mekko Chart
Pie Chart
Scatter Plot
Line Chart
Bar chart
Bullet points