My Account
My Slides
Leave Feedback
Login
Logout
Get Started
Browse all Slides
Browse Slides Pro
Create a FREE Account
Instant access to 1,000+ real slides from top companies like McKinsey, BCG, Goldman Sachs, Google and many more!
First Name
Last Name
Email
Password
I agree to all
Terms & Privacy Policy
Thank you! Your submission has been received!
Oops! Something went wrong while submitting the form.
Have an account?
Sign in
Instant access to the internet's best slides
Get access to 40+ advanced filters and more
Advanced Search and Filters
Access to
8,000+ slides
Access to Category Pages
Save/Bookmark Slides
PowerPoint Template Library (Coming Soon)
Choose your plan
MONTHLY
$12/month
Billed every month, cancel anytime.
YEARLY
$9/month
Billed $108 annually, cancel anytime.
Checkout for $12/month
Checkout for $108/yr
Secured by Stripe | AES-256 bit encryption
Welcome,
Welcome
Upgrade to SlideStart
Pro
Instant access to 8,000+ slides
Show Featured Only
Checkbox 8
Companies
Mckinsey
Bain
BCG
EY
Deloitte
Accenture
PwC/Strategy&
JP Morgan
Goldman Sachs
Morgan Stanley
Citigroup
Deutsche Bank
Barclays
LEK
Kearney
Oliver Wyman
Booz Allen Hamilton
Gartner
IPSOS
Nielsen
Slide type
Header Horizontal
Framework
Vertical Flow
Single Chart
Single Chart
Text Only
Mixed Chart
Header Vertical
Graphic
Pillar
Multiple Chart
Agenda
Title
Table
Linear Flow
Upgrade to SlideStart
Pro
Instant access to 40+ advanced filters
Industry
Upgrade to SlideStart
Pro
Instant access to 40+ advanced filters
Technology
Healthcare
Financial Services
Consumer Goods
Energy & Utilities
Manufacturing
Retail
E-commerce
Logistics
Telecommunications
Real Estate
Professional Services
Education
Media
Entertainment
Hospitatlity
Tourism
Agriculture
Food Production
Government & Public Sector
Environmental
Sustainability
Use Case
Upgrade to SlideStart
Pro
Instant access to 40+ advanced filters
Sales and Business Development
Mergers and Acquisitions
Corporate Finance and Valuation
Performance Metrics and KPIs
Client Case Studies
Competitive Landscape
Product and Service Analysis
Customer and Market Segmentation
Organizational Structure
Human Resources and Talent Management
Industry Overview
Regulatory and Compliance
Risk Assessment and Management
Agriculture & Food Production
Hospitality and Tourism
Government
Environmental
Sustainability
Clear all
Thank you! Your submission has been received!
Oops! Something went wrong while submitting the form.
Show Featured Only
Checkbox 8
Companies
Mckinsey
Bain
BCG
EY
Deloitte
Accenture
PwC/Strategy&
JP Morgan
Goldman Sachs
Morgan Stanley
Citigroup
Deutsche Bank
Barclays
LEK
Kearney
Oliver Wyman
Booz Allen Hamilton
Gartner
IPSOS
Nielsen
Slide type
Text Only
Linear Flow
Vertical Flow
Single Chart
Header Horizontal
Mixed Chart
Header Vertical
Pillar
Multiple Chart
Graphic
Agenda
Title
Table
Framework
Industry
Technology
Healthcare
Financial Services
Consumer Goods
Energy & Utilities
Manufacturing
Retail
E-commerce
Logistics
Telecommunications
Real Estate
Professional Services
Education
Media
Entertainment
Hospitatlity
Tourism
Agriculture
Food Production
Government & Public Sector
Environmental
Sustainability
Use Case
Sales and Business Development
Mergers and Acquisitions
Corporate Finance and Valuation
Performance Metrics and KPIs
Client Case Studies
Competitive Landscape
Product and Service Analysis
Customer and Market Segmentation
Organizational Structure
Human Resources and Talent Management
Industry Overview
Regulatory and Compliance
Risk Assessment and Management
Agriculture & Food Production
Hospitality and Tourism
Government
Environmental
Sustainability
Clear all
Thank you! Your submission has been received!
Oops! Something went wrong while submitting the form.
Tag
View slide
Column chart showing VC deals and investments in the Indian EV sector.
Investment Analysis
Transportation & Logistics
Highlights the growth and distribution of venture capital investments in India’s EV ecosystem.
EV, venture capital, investments, India, market growth
false
The EV ecosystem is witnessing investments into various ‘value blocks’; new players are also going the VC route to raise capitale-mobility in India Market paradigms and ways to play
Mixed Chart
PwC/Strategy&
View slide
Column chart showing semiconductor investment projects and a pie chart of low-carbon mobility projects by country.
Market Analysis and Trends
Technology & Software
Highlights investments in semiconductors and low-carbon mobility in Europe, focusing on leading countries.
semiconductors, low-carbon, mobility, investment, Europe
false
Semiconductors and low-carbon mobility investment saw four countries benefitting, namely France, Spain, Germany and the UKHow can Europe turn on the taps of foreign investment?
Multiple Chart
EY
View slide
A column chart comparing revenue growth of local versus multinational companies from 2012 to 2021.
Competitive Landscape
Professional Services
Discusses the rising market share of local companies in various industries and their competitive strategies against multinationals.
Local competition, market share, industry growth, competitive strategies
false
Intensifying competition from domestic playersRe-focus your talent lens: Abundance awaits
Mixed Chart
Accenture
View slide
The slide presents a column chart of CET1 capital and charts on risk-weighted assets and leverage ratio denominator.
Operational Efficiency
Financial Services
It illustrates significant reductions in financial resource consumption, showcasing CET1 capital and risk-weighted assets metrics.
financial resources, CET1 capital, risk-weighted assets, leverage, reductions
false
Significant progress in reducing financial resource consumptionFirst quarter 2024 Financial results
Multiple Chart
UBS
View slide
Two large bar charts comparing revenue and EBIT variations of luxury brands from 2014 to 2017, emphasizing the cost of growth.
Financial Performance
Consumer Goods
Highlights the increasing cost of growth for luxury brands over recent years, using revenue and profit metrics to discuss financial sustainability.
Growth, Cost, Luxury Brands
false
GROWTH IS BECOMING MORE EXPENSIVE THAN IN PAST 20 YEARSALTAGAMMA 2017 WORLDWIDE LUXURY MARKET MONITOR
Multiple Chart
Bain
View slide
This slide uses a grid layout to present comparative data on cultural attitudes in business across different regions, including Europe, the USA, China, India, and Japan. Each region's response percentages to various statements about organizational culture are displayed in a tabulated format.
Organizational Structure and Change
Professional Services
Compares the role of organizational culture in business success across different global regions, highlighting differing attitudes towards culture's importance in business operations and strategy.
organizational culture, global comparison, business attitudes
false
We have a distinctive culture which sets us apart from our competitorsGlobal Culture Survey 2021
Table
PwC/Strategy&
View slide
Features a dark blue and light blue chart displaying the growth in passive AUM. It contains a comparison of passive equity and fixed income AUM with a percentage scale on the right. The slide number is 10.
Investment Analysis
Financial Services
Highlights the growth of passive asset management and compares it with active funds globally, offering insights into investment trends and asset management preferences.
passive AUM, active funds, investment trends, asset management
false
Market Structure Evolution: Catalysts and Secular TrendsGoldman Sachs Investor Day
Single Chart
Goldman Sachs
View slide
This slide has a text-heavy format with five sections, each including a header, percentage, description, and associated icon, with a footnote at the bottom.
Market Analysis and Trends
Technology & Software
Details the systemic changes driving the growth of ecommerce in SEA, focusing on demographics, internet infrastructure, GDP growth, payment ecosystems, and retail infrastructure, indicating substantial opportunities for market expansion.
Systemic changes, ecommerce growth, SEA, demographics, internet infrastructure
false
5 key systemic changes are expected to occur, leading to the exponential growth of eCommercee-Conomy SEA Unlocking the $200 billion digital opportunity in Southeast Asia
Header Vertical
Bain
View slide
Table showing correlation values between asset classes over 5 and 10 years.
Risk Assessment and Management
Financial Services
Provides asset class correlation data for portfolio risk management and investment strategy.
Asset Classes, Correlation, Risk Management, Portfolio, Table, Investment Strategy, Data, Morgan Stanley, Market Monitor
false
Major Asset Classes Correlation TableMonthly Market Monitor January 2024
Table
Morgan Stanley
View slide
Column chart presenting revenues, color-coded for different sectors, and easy-to-read layout.
Financial Performance
Financial Services
Details the net revenues of global banking and markets, showcasing the increased wallet share and returns over years.
Revenues, banking, growth
false
Global Banking & Markets: Increased wallet share and financing driving growth and attractive returnsFull Year and Fourth Quarter 2023 Earnings Results Presentation
Single Chart
Goldman Sachs
View slide
Features a timeline with overlapping circles and a balanced mix of colors to denote different phases from submission to decision, accompanied by minimal textual content.
Operational Efficiency
Professional Services
Details the annual review process for corporate reporting awards, highlighting critical timelines, staff involvement, and decision phases, ideal for understanding organizational workflows.
corporate reporting, review process, timelines, awards, decision making
false
Process and Review PwC ReviewRisk Management as a catalyst for growth
Linear Flow
PwC/Strategy&
View slide
Combination of text, percentage circles, and visual comparisons highlighting differences in optimism about company culture between employees and employers post-pandemic.
Human Resources and Talent Management
Professional Services
This slide examines the impact of the pandemic on company culture, showing increased employee optimism versus declining employer optimism, and significant staff turnover.
Company culture, pandemic impact, employee optimism, employer pessimism, staff turnover
false
As employers are experiencing significant staff turnover, they are feeling less optimistic about how the pandemic has impacted company cultureEY Work Reimagined 2022 Survey
Multiple Chart
EY
View slide
Features three charts: a column chart for y/y real GDP (2021-2025F), a line chart for interest rates (2005-2025F), and a line chart for y/y CPI (2005-2025F).
Market Analysis and Trends
Financial Services
Discusses economic growth prospects in the MENA region, focusing on GDP, interest rates, and inflation trends.
MENA, GDP, Inflation, Interest Rates, 2024
false
Growth in the MENA region is expected to pick up in 2024, following a dip this year, with disinflation underwayGlobal economic outlook: finding balance in 2024
Multiple Chart
EY
View slide
The slide employs a clean layout with a large bar chart that communicates the internet economy's growth in Singapore, along with annotations for future projections.
Financial Performance
Technology & Software
Summarizes the reach of the internet economy in Singapore, considering the challenges faced due to lockdowns, and forecasts growth, highlighting digital transformation and economic resilience.
Internet economy, Economic resilience, Lockdown challenges, Growth projection
false
Singapore Internet economy reaches $15B despite significant challenges due to lockdownse-Conomy SEA 2021 Roaring 20s: The SEA Digital Decade
Single Chart
Bain
View slide
Features a large circular diagram in red and white, divided into four segments, each containing text descriptions.
Strategic Planning
Professional Services
Describes the ADP team's methodology in reviewing applications, focusing on four aspects: project management, evaluation process, evaluator training, and criteria application.
methodology, review, applications, evaluation, process
false
A METHODOLOGY DESIGNED TO ENSURE EFFICIENT AND COMPREHENSIVE REVIEW OF APPLICATIONS HAS BEEN EMPLOYED FOR THIS EXERCISETEF APPLICATION EVALUATION 2019
Framework
Accenture
View slide
Four blocks highlighting industry drivers of profitability in distribution: Inventory turns, Technical expertise, Fragmentation, Regulatory environment, Pricing dynamics, each with descriptive bullet points.
Market Analysis and Trends
Financial Services
The slide outlines the key profitability drivers in distribution industries, focusing on inventory, technical knowledge, market fragmentation, regulations, and pricing trends.
profitability, inventory turns, technical expertise, fragmentation, regulations, pricing dynamics, distribution
false
Distribution industry dynamicsEY-Parthenon Perspectives: Investing in distribution
Pillar
EY
View slide
Circular diagram split into four quadrants with icons, focused on strategic business values from SDGs.
Strategic Planning
Government & Public Sector
Highlights four strategic directions from SDGs for business value: growth, risk, return on investment, and organizational performance.
SDGs, strategic directions, business value, growth, risk management
false
The SDGs can drive business value from 4 strategic directions as demonstrated by the McKinsey Sustainability CompassSDG Guide for Business Leaders
Framework
McKinsey
View slide
Slide compares remote work policies before and during COVID-19 through a column chart and bar graph detailing city-specific work-from-home statistics.
Organizational Structure and Change
Professional Services
Reviews the transition to remote work across various cities, indicating a significant increase in work-from-home adoption due to COVID-19, with comparative insights on employee distribution.
Remote Work, COVID-19, Work From Home, Cities, Transition
false
Most companies transitioned to remote work successfullyCovid 19: Briefing Materials
Multiple Chart
McKinsey
View slide
This slide displays a bar chart with the major limiting factors to providing antenatal care in primary healthcare centers, such as poor power supply and equipment issues. Each factor is distinctly colored for emphasis.
Risk Assessment and Management
Healthcare & Pharmaceuticals
Identifies critical barriers to healthcare service provision in primary centers, focusing on power supply issues, which is crucial for risk management and service improvement in healthcare.
healthcare barriers, power supply, risk management, PHC limitations, service improvement
false
Inadequate power supply identified as a primary reason for PHC's being unable to meet pregnant women ANC demandsSocio-economic case for deepening solar PV deployment in Nigeria
Single Chart
BCG
View slide
Column chart with shades of gray showing the percentage of occupations that could be fully automated or partially automated, listing specific job roles as examples at various automation levels.
Operational Efficiency
Industrial & Manufacturing
Shows the automation potential across different occupations, illustrating how many roles could see a significant portion of their tasks automated and identifying specific occupations like travel agents and web developers.
Occupations, Automation, Job Roles, Potential, Tasks
false
A small percentage of occupations can be fully automated by adapting current technologies, but almost all occupations have some activities that could be automatedA FUTURE THAT WORKS: AI, AUTOMATION, EMPLOYMENT, AND PRODUCTIVITY
Single Chart
McKinsey
View slide
A slide with a balanced mix of text and graphs, featuring a column chart with color differentiation to display market data. It is well-organized, facilitating a quick grasp of complex market performance data.
Financial Performance
Financial Services
The slide provides an analysis of fixed income markets performance with key highlights and market review. It serves to convey critical market trends and data, likely to inform investment decisions or economic forecasts.
Performance, Review, Markets, Data
false
2023 Ends With A Huge Rally For Fixed Income MarketsCredit Market Monitor
Multiple Chart
Morgan Stanley
View slide
The slide presents three columns of information, each titled and color-coded (green, yellow, pink). Each section contains lists and a checkmark icon for key points.
Market Analysis and Trends
Healthcare & Pharmaceuticals
Discusses three possible future scenarios for pandemic recovery, detailing differences in vaccine efficacy, rollout speeds, and public health responses under each scenario.
pandemic, vaccines, scenarios, rollout, public health
false
Three potential pandemic scenarios going forwardCOVID-19 BCG Perspectives State of the World
Table
BCG
View slide
The slide features multiple column charts comparing sustainability influence across generations.
Market Analysis and Trends
Environmental Services & Sustainability
Examines how sustainability influences purchasing behaviors across different generations globally.
sustainability, generations, influence, global, purchasing behavior
false
…greatest influence on younger generations, and substantial variation across nationalities2019 True-Luxury Global Consumer I nsight
Multiple Chart
BCG
View slide
The slide is split into two main sections, left featuring a list of elements in a global operating model, right showing the benefits with logos of partnerships. Blue and red are predominant colors.
Strategic Planning
Financial Services
Describes the dual structure of a business model delivering globally and managing locally, alongside benefits of global leverage, highlighting partnerships and value propositions.
Business Model, Global, Local, Partnerships, Leverage, Scale, Marketing, Client Service, Citigold
false
Our Business Model Creates Opportunities for Global Leverage & ScaleGlobal Consumer Banking
Header Horizontal
Citigroup
View slide
Dark blue background with a large vertical column chart detailing the global demand for Li-ion battery cells from 2015 to 2040, split into three sectors: mobility, energy storage systems, and consumer electronics.
Market Analysis and Trends
Energy & Utilities
The slide analyzes the growing demand for Li-ion batteries, emphasizing the impact of electric vehicles on this increase. It highlights key insights about market growth expectations and sector contributions.
Li-ion, electric vehicles, market growth, energy storage, consumer electronics
false
Li-ion battery cell demand growth driven overwhelmingly by the transition to EVs in the mobility sectorBattery materials demand and supply perspective
Mixed Chart
McKinsey
View slide
This slide features multiple vertical column charts comparing traditional and social/casual gaming revenue growth in Mainland China, the US, and globally from 2020 to 2025. The slide layout is dense with data and includes red and grey bars representing different gaming types within each geographical focus.
Market Analysis and Trends
Media & Entertainment
The slide analyzes video gaming revenue trends from 2020 to 2025, highlighting the growth in different gaming types (traditional vs. social/casual) across Mainland China, the US, and globally. It predicts significant revenue growth in the gaming industry, emphasizing the dominant market positions of China and the US.
video games, revenue growth, traditional gaming, social gaming, market analysis
false
Mainland China and US dominate the market, represents the global growth trend. Video games revenue will grow at a similar rate from 2021 to 2025 and reach US$41.1bn and US$1.2bn in 2025Global & Entertainment Media Outlook 2021-2025: Hong Kong summary
Multiple Chart
PwC/Strategy&
View slide
The slide uses data tables, column charts, and maps to present the EMEA IPO market overview, including equity indices, stock exchange performance, and major IPOs by country and sector.
Market Analysis and Trends
Financial Services
The slide gives an overview of the IPO market in Europe, Middle East, India, and Africa (EMEA) for 2022, detailing stock exchange performance, sector data, and significant IPOs, highlighting the region's strength despite market volatility.
EMEA, IPO, stock exchange, sector, 2022
false
Europe, Middle East, India and Africa: despite market volatility, the region strengthened its position as the second largest IPO market with 27% of all IPOsHow can you prepare to seize the right moment?
Multiple Chart
EY
View slide
The slide features a column chart comparing net interest income under different interest rate scenarios and a line chart of historical interest rates.
Risk Assessment and Management
Financial Services
The slide explains the impact of interest rate changes on net interest income over a three-year period, using illustrative examples.
interest rates, sensitivity, financial, performance, net interest income, risk management
false
Interest rate sensitivityUBS Investor Update Personal & Corporate Banking
Multiple Chart
UBS
View slide
Features a combination of icons and text outlining diversity and operational goals, with a clear emphasis on sustainability and inclusion within the firm's strategy.
Organizational Structure and Change
Financial Services
Describes the company's goals for improving operational efficiency and diversity, including specific targets for hiring, energy efficiency, and waste reduction, reinforcing the company's commitment to sustainable operations and an inclusive work environment.
Diversity, Operations, Sustainability, Inclusion, Energy Efficiency, Waste Reduction
false
Our Approach: People and OperationsSustainability: Our Issuance Framework
Table
Goldman Sachs
View slide
Features a projection column chart from 2022 to 2025 with strategic growth measures listed beside it. The slide uses a simple, clean design with blue and white tones.
Investment Analysis
Financial Services
Projects future revenue targets for Deutsche Bank, detailing strategic initiatives across various divisions to drive growth.
Revenue, projections, Deutsche Bank, strategy, growth, 2025, financial targets, divisions
false
Revenues planned to reach ~€ 30bn by 2025 10 Note: RM – relationship manager; for footnotes refer to slides 29 and 30 In € bnClient & Creditor Overview July 2023
Mixed Chart
Deutsche Bank
View slide
This slide uses a timeline layout with three phases represented as boxes progressing from left to right. The first phase, "Stabilizing, restructuring and planning (2023)," is in a light beige box. The second phase, "Restructuring, integrating and optimizing (2024 - 2026)," is in a medium beige box. The third phase, "Capturing sustainable growth and long-term value creation," is in a dark grey box. Below each box, there is a short description and a small arrow icon between the phases.
Strategic Planning
Financial Services
The slide outlines a phased plan to achieve long-term growth and value creation. Each phase has specific goals: achieving profitability in 2023, restructuring and optimizing from 2024 to 2026, and sustaining growth and delivering returns beyond 2026. The slide can be used to present a strategic plan to stakeholders.
growth, planning, restructuring, profitability, strategy
false
Executing to capture long-term growth and value creationThird quarter 2023 Fixed Income investor presentation
Linear Flow
UBS
View slide
Bar and line graph hybrid illustrating the number of deals and deal value from 2017 to H1 2021. The design includes different shades of blue for distinction, with a clear indication of the upward trend and investment sources noted below.
Investment Analysis
Financial Services
Showcasing the explosive growth in deal value in Vietnam for 2021, the slide credits foreign and domestic investment, alongside government incentives, as key drivers for this increase.
Deal Value, Vietnam, Investment, Foreign, Domestic, Government, Incentives, Growth
false
Vietnam 2021 deal value has skyrocketed, mainly fueled by foreign and domestic investment and government incentivese-Conomy SEA 2021 Roaring 20s: The SEA Digital Decade
Single Chart
Bain
View slide
Contains diagrams and text explaining self-sovereign and passwordless identity verification methods.
Technology and Digital Transformation
Technology & Software
Discusses innovative identity verification technologies and their roles in enhancing digital security and user autonomy.
self-sovereign identity, passwordless identity, biometrics, digital security, innovation
false
What are the most noteworthy technologies? 2McKinsey Technology Trends Outlook 2022 Trust architectures and digital identity
Header Horizontal
McKinsey
View slide
The slide features a horizontal bar chart showing the change in agreement with the statement on global brands from 2021 to 2022 in various countries.
Market Analysis and Trends
Technology & Software
The slide highlights an increase in the preference for global brands over the past year across different markets.
Global brands, market preference, survey, public opinion, brand analysis
false
Over the past year, there has been a marked return to global brandsA NEW WORLD DISORDER?
Mixed Chart
IPSOS
View slide
Contains a column chart showing percentages for three years under categories such as 'significantly more attention' to 'significantly less attention' regarding employee focus on financial benefits, with an emphasis on the increase since 2022.
Performance Metrics and KPIs
Financial Services
Analyzes the trends of employee attention to financial benefits over the years, with a focus on the increased attention in the recent year, useful for gauging employee priorities.
Financial Benefits, Employee Attention, Trend Analysis, Year-over-Year, Bar Graph
false
Benefits in the SpotlightState of the Workplace III
Single Chart
Goldman Sachs
View slide
The slide uses a split design with a gray-blue color scheme. It contains icons, flowchart elements, and numerical data highlighting key risk management areas.
Risk Assessment and Management
Financial Services
Emphasizes the critical nature of risk and control management in finance, detailing operational security, legal, and compliance structures.
risk management, control, compliance, security, finance, operational resilience, KYC, AML
false
Fortress risk and control management are non-negotiableFirm Overview 2022
Framework
JP Morgan
View slide
This slide is dense with column charts showing yearly financial results like adjusted revenues, net income, and overhead ratios, annotated with percentage changes and ROE indicators. Color-coded for clarity.
Financial Performance
Financial Services
The slide provides an overview of JP Morgan Chase's financial performance over several years, highlighting the record year in 2018. It is likely intended to communicate the company's robust financial health and trends in revenue and net income to stakeholders.
Financial Results, Revenue, Net Income, Overhead Ratio, Record Year, Trend Analysis, ROE, Banking, Financial Services, JP Morgan Chase, Performance Review
false
We delivered strong results and had a record year in 2018Corporate & Investment Bank 2019
Single Chart
JP Morgan
View slide
Graphically rich slide with column charts depicting capital usage and developments in regulatory capital efficiency, alongside explanatory texts and arrows for emphasis.
Strategic Planning
Financial Services
Details the bank's strategic adjustments in capital management aimed at enhancing long-term shareholder value and financial stability through sustainable investments and efficiency improvements.
capital management, long-term value, financial stability, shareholder value, regulatory efficiency
false
Shifting gears to drive long-term valueClient & Creditor Overview
Mixed Chart
Deutsche Bank
View slide
Features dual columns with headers, column charts displaying quarterly revenues, and bullet points summarizing highlights. Design is clean with a blue and grey color scheme, promoting readability of complex data.
Risk Assessment and Management
Financial Services
This slide emphasizes stable earnings through client focus in global markets, presented with FICC and equities quarterly revenues. It's likely used for illustrating risk management effectiveness and market positioning.
global markets, FICC, equities, quarterly revenues, market share, risk management, earnings stability, revenue volatility, financial presentation, investment strategy
false
Client Focus in Global Markets – Higher Share, Lower Risk, More Stable Earnings FICC Quarterly RevenuesGoldman Sachs Presentation to Bank of America Merrill Lynch Future of Financials Conference
Multiple Chart
Goldman Sachs
View slide
Displays a dual-axis column chart tracking client numbers and a bar chart reflecting a finance portfolio. The slide uses contrasting colors to distinguish different segments and time periods. Annotations and titles are neatly organized for legibility.
Market Analysis and Trends
Financial Services
This slide depicts the growth in client base for Commodities and Global Markets and details the Specialised and Asset Finance portfolio, useful for trend analysis and customer base evaluation in financial services.
client growth, commodities, finance, portfolio, trend analysis, financial services, asset finance, market analysis
false
Commodities and Global Markets Growing client baseGoldman Sachs 16thAnnual Australia and New Zealand Investment Forum
Multiple Chart
Goldman Sachs
View slide
Slide with a column chart comparing podcast ad revenue shares by content genre from 2020 to 2021, highlighting top genres like News, Comedy, and Society & Culture.
Market Analysis and Trends
Media & Entertainment
Reviews the popularity and revenue generation of different podcast genres, noting significant growth in ad revenue for sports post-COVID.
Podcast, Genres, Revenue, Trends, Sports
false
News, Comedy and Society & Culture continue to be the top 3 podcast genresU.S. Podcast Advertising Revenue Study
Single Chart
PwC/Strategy&
View slide
This slide includes a pie chart and a checklist. The pie chart illustrates the composition of total deposits, and the checklist outlines the characteristics of the deposits. The slide is clear and informative with a straightforward presentation of data.
Operational Efficiency
Financial Services
It breaks down the firm's deposit base, showing diversification and insurance coverage. With details on deposit types and insurance, it could be used for presentations on financial stability and deposit strategies.
Deposits, Diversification, FDIC Insured, Funding Liabilities, Deposit Composition
false
Stable and Diversified DepositsFixed Income Investor Presentation
Mixed Chart
Goldman Sachs
View slide
The slide shows a complex layout with multiple circular diagrams and infographics on business diversification and global presence.
Market Analysis and Trends
Financial Services
Designed to demonstrate the company's diversification across regions, staff distribution, and business mix over time. Suited for presenting to investors or during annual meetings.
Diversification, Global Presence, Annuity, Business Mix, Staff Distribution
false
Diversification by regionMorgan Stanley Virtual Hong Kong Summit
Multiple Chart
Morgan Stanley
View slide
This slide features a series of column charts and pathway graphics detailing the strategy to align RoTE with the group target by 2026. The colors used are shades of blue and grey, signifying different aspects like 'loan loss rate stabilization' and 'late fees'. The design is clear with each section distinctly marked for focus.
Strategic Planning
Financial Services
Outlines Barclays' strategic actions towards achieving a RoTE in line with the group target by 2026, highlighting areas such as scale and operational efficiency, and balance sheet optimization.
RoTE, strategic plan, operational efficiency, balance sheet, 2026
false
Path to delivering RoTE in line with Group target by 2026FY 2023 Results Announcement
Single Chart
Barclays
View slide
A split-layout design with two content blocks for text. It uses a blue and grey color scheme with bulleted lists to present information. The layout is simple and focuses on textual information.
Risk Assessment and Management
Financial Services
Discusses the short-term factors affecting different sectors of the company, useful for risk management and forecasting. It provides an analysis of the impact of market conditions on various business areas.
Short-Term Outlook, Annuities, Market Conditions, Risk Management, Banking
false
Factors impacting short-term outlookGoldman Sachs 16thAnnual Australia and New Zealand Investment Forum
Table
Goldman Sachs
View slide
Graphs and charts illustrating payment fee revenues and sales volume growth, juxtaposed with sector-specific data. The color scheme is blue, green, and gray.
Operational Efficiency
Financial Services
Examines the resurgence in payment processing sectors, underlining the economic recovery's impact on sales volumes. It's for evaluating operational performance in the payment services domain.
Payment Fees, Revenue, Growth, Sales
false
The payments recovery continuesGoldman Sachs U.S. Financial Services Conference 2021
Multiple Chart
Goldman Sachs
View slide
The slide features text on the left and a column chart on the right showing the rate of tech adoption before and during the pandemic.
Technology and Digital Transformation
Technology & Software
This slide discusses how the pandemic accelerated digital transformation, comparing the adoption rates of various technologies between two survey years.
digital transformation, pandemic, tech adoption, technology trends, survey data
false
The COVID-19 pandemic has accelerated the rate of tech adoptionMake the leap, take the lead: Tech strategies for innovation and growth
Mixed Chart
Accenture
View slide
Column charts and text comparison of market capitalization changes in different regions, highlighting Europe's growth against other regions. Each region's performance is detailed with supporting data.
Market Analysis and Trends
Financial Services
Focuses on regional economic performance, particularly Europe's market dynamics, useful for understanding shifts in global market capitalization.
market capitalization, regional analysis, economic growth
false
Europe outperforms the regions with four new entrants into the Top 100.Global Top 100 companies - by market capitalisation
Mixed Chart
PwC/Strategy&
View slide
A column chart showing changes in total ad-supported television reach for different user categories between January 2021 and January 2022.
Market Analysis and Trends
Media & Entertainment
The slide shows a decline in the potential weekly reach of ad-supported TV, with significant growth in SVOD only users, highlighting a shift in viewing patterns.
ad-supported TV, reach, SVOD, users, decline
false
Ad-Supported TV’s potential weekly reach fell 11% YoYSpring 2022 National Client Meeting
Mixed Chart
Nielsen
View slide
The slide displays tables and bullet points outlining financial expenses and highlights, including a graph showing efficiency ratio trends.
Operational Efficiency
Financial Services
Outlines the company's financial expenses, focusing on compensation, transaction fees, and other operating costs. It also discusses the impact of litigation on the overall financial performance and operational efficiency, as well as the company's tax rate.
Expenses, Financial Performance, Operational Efficiency, Litigation, Tax Rate
false
Expenses Financial ResultsFull Year and Fourth Quarter 2020 Earnings Results Presentation
Mixed Chart
Goldman Sachs
View slide
This slide uses a column chart to show the GDP uplift from 2012 to 2030 due to the NBN network, with annotations and color coding to differentiate between years and projections.
Financial Performance
Telecommunications
The slide presents the economic impact of the NBN network in Australia, highlighting the GDP contribution and projected future benefits, useful for discussing telecommunications' economic impact.
NBN, GDP, Australia, economic impact, telecommunications, projection, financial analysis
false
Our model finds that investment in the nbn network has delivered significant GDP benefits to the Australian economyThe economic and social impact of investment in the nbn network Key Insights Report
Mixed Chart
Accenture
View slide
The slide is divided into two main sections, each with a heading and bulleted points, complemented by iconography. The left side emphasizes customer experience while the right focuses on business and developer tools. The design is straightforward with a good balance of text and imagery.
Operational Efficiency
Financial Services
This slide discusses the implementation of secure and convenient payment options to enhance customer experience and business operations. It's used to promote efficient in-app payment solutions and developer-friendly tools for creating secure payment environments.
payment methods, cart abandonment, in-app experience, business value, developer tools, security solutions, transaction flow, automation
false
Deliver simple, fast and secure payments for your customers and reduce cart abandonmentKEEP MOVING FORWARD
Boxed
JP Morgan
View slide
The slide contains a flowchart with three phases outlined, text descriptions, and several bullet points. It is moderately complex with a clear visual path to follow.
Strategic Planning
Financial Services
This slide depicts the company’s future strategy in three phases, highlighting the current phase and the objectives for the coming years. It is used for explaining strategic investment plans and expected outcomes.
strategy, phases, execution, investment, planning, outcomes
false
Reminder That Our Path Forward Comes In Three Phases & 2023 Falls In Phase 1Earnings Results Presentation Fourth Quarter and Full Year 2022
Linear Flow
Citigroup
View slide
An illustration of a stick figure writing on a blackboard, with a prominent title and a subtitle in bold purple text on a white background.
Industry Overview
Education & Training
The title slide introduces the theme of the presentation, hinting at a focus on transformative changes in education due to intelligent technologies.
Education, Learning, Intelligent Technologies, Skills Acquisition, Future of Work, Title Slide, Presentation, Technology Impact, Training
false
IT’S LEARNING. JUST NOT AS WE KNOW IT.Bridging the Skills Gap in the Future Workforce
Title
Accenture
View slide
Presents a horizontal value chain diagram illustrating the stages from input companies to consumers, incorporating icons for each stage. The design is linear and straightforward.
Customer and Market Segmentation
Agriculture & Food Production
Describes the food industry value chain in Belgium, aiming to assess sustainability practices. It mentions a survey covering various stakeholders from farming to retail, focusing on sustainable business practices.
value chain, food industry, sustainability, Belgium
false
The Future of Food survey covered the entire food-industry value chain in Belgium. Through a survey at 58 companies, it aimed at assessing the maturity of the country’s food ecosystem and at creating awareness around more sustainable business practicesThe Future of Food Challenges & opportunities
Diagram
Deloitte
View slide
A title slide with dramatic ocean imagery in the background and bold, white text overlaying it, presenting the report's theme.
Industry Overview
Financial Services
Serves as the introductory slide for a report on global private equity, setting the tone for the data and analysis that will follow.
Private Equity, Global Report, Financial Services, Introduction, Market Overview, Dramatic Imagery, Title Slide
false
2023 Global Private Equity Report2023 Global Private Equity Report
Title
Bain
View slide
Icons and labels representing tourism enablers
Strategic Planning
Hospitality & Tourism
Identifies key factors necessary for enhancing high-end tourism, including luxury accommodations, high-end brands, and safety.
tourism, strategy, enablers, luxury, safety
false
A series of enablers and attractors are needed to reap the benefits of “hard” and “soft” spilloversHigh-end Tourism - a strong driver for Europe
Table
Bain
View slide
Bar chart displaying the percentage of "Yes" responses by sector on conducting TNA.
Human Resources and Talent Management
Education & Training
Examines the prevalence of Training Needs Analysis for identifying developmental needs in organizations.
TNA, training, needs, development, sectors
false
Training Needs Analysis (TNA) to identify training and development requirementsHR Pulse Survey Presentation of results
Multiple Chart
PwC/Strategy&
View slide
Contains a bar chart and a column chart, with blue-green color scheme. Text is used to provide context and explanations.
Regulatory and Compliance
Environmental Services & Sustainability
Highlights the importance of climate change in corporate strategy and investments, focusing on the top pressing issues and changes in sustainability investments.
Climate change, sustainability, corporate strategy, investments
false
Climate remains a top priority despite many pressing issuesDeloitte 2023 CxO Sustainability Report
Multiple Chart
Deloitte
View slide
A column chart shows the distribution of fleet age against 'eco' status, with a small chart on orders reflecting regulatory impact.
Regulatory and Compliance
Transportation & Logistics
Analyzes the impact of environmental regulations on fleet operations, focusing on compliance costs and operational adjustments in shipping.
environmental regulations, fleet management, compliance, shipping industry, operational adjustments
false
Fleet-wide impact of environmental regulationsDeutsche Bank’s 2023 Shipping Summit
Mixed Chart
Deutsche Bank
View slide
Displays two column charts comparing year-over-year growth in podcast advertising revenues. Uses a colorful design with orange, teal, and yellow to represent different data points and trends clearly. Focuses on self-reported and market estimate comparisons.
Market Analysis and Trends
Media & Entertainment
Examines the growth trends in podcast advertising revenue from 2016 to 2018, with specific emphasis on self-reported versus market estimated revenues. It provides insights into the accelerating market acceptance and the viability of podcasting as an advertising medium.
podcast, advertising, revenue, growth, 2016, 2018, comparison, media
false
Year-over-year growth from 2016 to 2018 was significant for both self-reported revenues and the total market estimate.IAB FY 2018 Podcast Ad Revenue Study
Multiple Chart
PwC/Strategy&
View slide
Slide includes a split bar chart for the revenue mix in the first and second half of 2010-2020, highlighting the increase in the latter half of 2020.
Market Analysis and Trends
Media & Entertainment
Evaluates the distribution of advertising revenues across different halves of the year, indicating a significant contribution from the second half of 2020 to annual growth.
advertising, revenue, half-year, growth, 2020, media, technology, analysis
false
Overall, H1 revenues were similar to last year but a busy H2 led to growthInternet Advertising Revenue Report 2020 full year results
Single Chart
PwC/Strategy&
View slide
Includes a bar chart comparing current and future human-machine working hours, and a pie chart showing reskilling needs of employees.
Operational Efficiency
Financial Services
Highlights the need for reskilling employees in the insurance industry due to shifts in labor between humans and machines, emphasizing digitization and automation impacts.
Reskilling needs, Human-machine working hours, Insurance industry, Digitization, Automation
false
According to World Economic Forum, 54% of employees are expected to need reskilling due to an anticipated shift in the division of labour between humans and machinesGlobal Employee Survey - Key findings and implications for ICMIF
Multiple Chart
EY
View slide
Includes a column chart for sustainable finance volumes, lists, and bullet points highlighting key activities and achievements.
Operational Efficiency
Environmental Services & Sustainability
Highlights Deutsche Bank's Q1 2023 sustainability efforts, focusing on increased finance volumes, new policies, and significant achievements in promoting sustainability in banking practices.
sustainability, finance volumes, policies, Q1 2023, banking
false
Sustainability Q1 2023 highlightsQ1 2023 results
Mixed Chart
Deutsche Bank
View slide
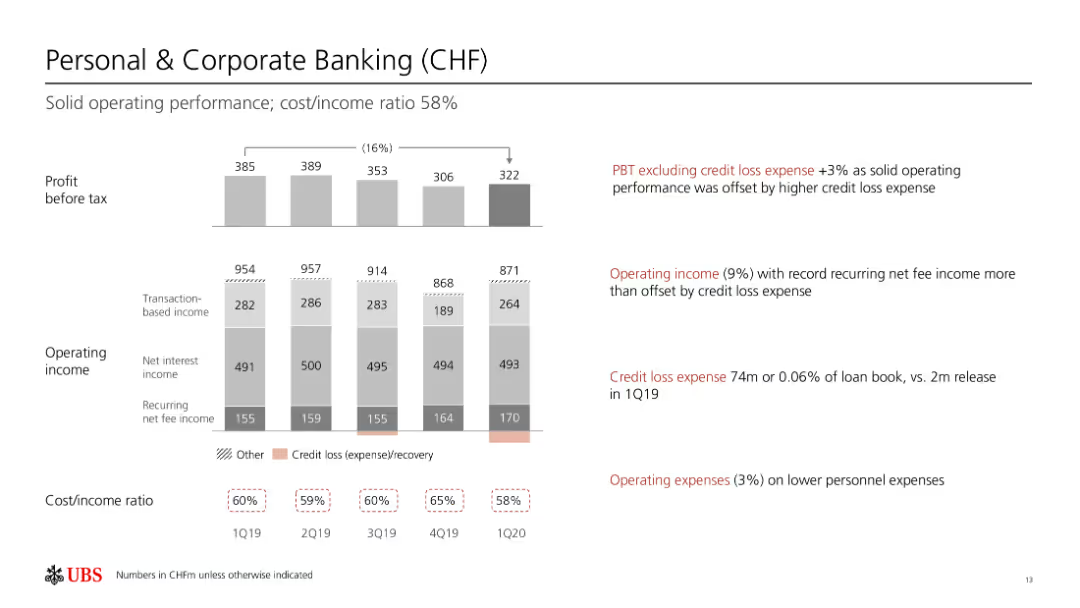
Column chart shows profit before tax, operating income, and cost/income ratios over several quarters.
Financial Performance
Financial Services
Reviews solid operating performance in personal and corporate banking, with a focus on credit loss expenses.
personal banking, corporate banking, financial performance, operating income, credit loss
false
Personal & Corporate Banking (CHF)First quarter 2020 results
Multiple Chart
UBS
View slide
Line chart showing the global risks landscape for technological risks, plotting impact versus likelihood.
Technology and Digital Transformation
Technology & Software
The slide presents a global risk assessment for technological advancements, highlighting the perceived risks and their impact versus likelihood. It focuses on the different risk perceptions between generations, particularly regarding tech advances, digital power concentration, and digital inequality.
Technological Risk, Risk Perception, Innovations
false
The relationship of humans with machines is fraught with technological risk Risk perception regarding innovations in the younger generation are higherMegatrend 5 - Technology & Innovation
Mixed Chart
Roland Berger
View slide
Column chart showing GMV growth of the Farfetch platform from 2015 to 2018 with CAGR.
Financial Performance
Retail & E-commerce
Depicts the rapid growth of the Farfetch platform in comparison to the online luxury market, emphasizing a 55% CAGR.
Farfetch, GMV, luxury market, growth, CAGR
false
Farfetch Platform Growing 2x as Fast as the Online Luxury MarketDeutsche Bank Media, Internet & Telecom Conference
Single Chart
Deutsche Bank
View slide
Slide includes a bar graph for top remittance receiving countries and a column chart for international migrant stock by region. Text descriptions and icons for population, migration, and education sectors are present.
Market Analysis and Trends
Government & Public Sector
This slide presents statistical data on international labor migration and remittances, highlighting economic impacts and demographic shifts. It aims to inform on the scale and financial implications of labor mobility globally.
migration, remittances, labor, economics, international, finance, data, demographics, global economy
false
International labor migrants constitute the bulk of other international migrants – Remittances highlight important aspects of a two-way flowRoland Berger Trend Compendium 2030: Megatrend 1 People & Society
Multiple Chart
Roland Berger
View slide
Slide shows line graphs contrasting the current and potential trajectories of nickel supply (Class 1 and 2) against demand scenarios on a dark background.
Strategic Planning
Industrial & Manufacturing
Outlines strategies to address the tight supply of nickel by detailing supply chain dynamics, projected demands, and the influence of market conditions from 2012 to 2031.
nickel, supply chain, market dynamics, class 1, class 2
false
We expect a short-term Class 1 thightness, compensated by either significant supply pipeline growth via NPI conversion or substitution of nickel usageBattery materials demand and supply perspective
Multiple Chart
McKinsey
View slide
A bar chart showing the percentage of companies planning to expand or establish operations in Europe, with an explanatory text box providing additional insights.
Strategic Planning
Financial Services
The slide discusses the priority of Europe for companies, indicating plans to establish or expand operations, and highlights the sectors with the highest expansion intentions.
investment, Europe, company plans, expansion
false
For now, Europe remains a priority for companiesHow can Europe turn on the taps of foreign investment?
Mixed Chart
EY
View slide
Slide presents a dark theme with a graph and an information box. A bold bar graph depicts survey results with percentages in contrasting colors, accompanied by a summarizing statement. It has a clear visual hierarchy with the graph as the focal point and an inset box for additional data.
Regulatory and Compliance
Retail & E-commerce
This slide contains a bar graph summarizing survey responses regarding organizational approaches to selling customer data. It is pertinent for presentations analyzing consumer data protection practices and corporate ethics in data management, particularly under regulatory and compliance contexts.
Data Sale, Customer Permission, Survey, Corporate Ethics, Data Protection, Privacy, Regulation, Compliance
false
Most respondents say they will not sell any data or will sell data only with explicit customer permissionConsumers at 250
Single Chart
Kearney
View slide
This slide presents three data points with icons: mobile app logins, users of a payment service, and percentage of check deposits via a digital platform. Each data point is accompanied by an increase percentage and compared to previous years. The slide layout is balanced, with clear delineation between each metric and the usage statistics shown in large bold numbers for emphasis.
Operational Efficiency
Financial Services
It highlights key performance metrics in digital services offered by Chase, such as mobile banking logins, peer-to-peer payments, and digital check deposits. The slide is intended to convey the effectiveness of digital investments and customer adoption rates for digital banking services.
mobile banking, digital platforms, user growth, customer adoption
false
Our investments in digital platforms and functionality have made it easier for customers to self-serveConsumer & Community Banking 2019
Table
JP Morgan
View slide
Displays a hierarchical pyramid diagram illustrating the House of Purchasing and Supply ManagementTM, with detailed categorizations.
Strategic Planning
Professional Services
Assesses internal effectiveness of client's procurement function through the AEP framework, covering various performance metrics.
procurement, assessment, excellence, AEP, internal effectiveness, pyramid diagram, House of Purchasing, performance metrics
false
House of Purchasing and Supply ManagementTMExcellence in Procurement
Framework
Kearney
View slide
The slide has a multicolor action plan list on the left side and a red-highlighted text box on the right emphasizing a key achievement. A gray background distinguishes the bottom section, which details specific program progress.
Operational Efficiency
Industrial & Manufacturing
Presenting the recovery plan for aerostructures, the slide outlines various actions taken and their progress. It emphasizes improvements and milestones, including collaborations and deliveries. It's used for performance reviews and showcasing operational progress in the aerospace sector.
Aerostructures, Recovery Plan, Progress, Operational Efficiency, Milestone
false
Aerostructures recovery plan is on the right wayGoldman Sachs Investor Meeting
Table
Goldman Sachs
View slide
The slide presents a column chart showing Europe HICP y/y inflation (2023-24F) for various countries. The data is displayed clearly, highlighting differences in inflation rates across EU Member States with supporting textual explanations.
Market Analysis and Trends
Financial Services
This slide forecasts diminishing cross-country inflation differentials in the EU for 2024, with most member states seeing inflation in the 1%-3% range. It provides a detailed comparison of inflation rates, discussing the factors contributing to these trends.
inflation, EU, HICP, cross-country, forecast
false
Cross country inflation differentials will diminish in 2024, with most EU Member States seeing inflation in the 1% 3% rangeGlobal economic outlook: finding balance in 2024
Mixed Chart
EY
View slide
The slide features a column chart displaying the 2022 DCR spend categories, ranging from <$200K to $750K+, with a quote discussing the high licensing costs and barriers to entry.
Technology and Digital Transformation
Technology & Software
The slide discusses the high costs associated with adopting data clean rooms (DCRs), highlighting the financial barriers for smaller companies and the significant investments required.
DCR costs, barrier to entry, financial, privacy
false
DCR costs create a high barrier to entry a challenge for smaller i ndustry p layersState of Data 2023
Mixed Chart
IPSOS
View slide
Slide includes three column charts showing the financial models for school coverage, titled by different government and commercial involvement scenarios. Colors used: blue, green, and red.
Market Analysis and Trends
Education & Training
The slide analyzes three funding models for schools in Java, Bali, and Sumatra, comparing costs, reductions, and gaps in funding, highlighting government involvement's necessity.
financial models, school funding, government involvement, Java, Bali, Sumatra, cost analysis, revenue sharing, subsidy, budget gap
false
P&L of an avg. school1 in Java, Bali & Sumatra | No model sufficient by itself to cover costs, though clear differences in potential ariseIndonesia case study
Multiple Chart
BCG
View slide
The slide presents a column chart on the right side listing reasons for not purchasing crypto assets, with corresponding percentage bars on the left side. The layout is moderately complex.
Risk Assessment and Management
Financial Services
This slide lists various reasons people avoid buying crypto assets, such as lack of understanding, fear of scams, and perceived risk. It aims to highlight the main concerns preventing crypto adoption.
crypto, risk, avoidance, concerns, understanding
false
Reason(s) For Not Purchasing Any Crypto AssetsCRYPTO ASSET SURVEY
Multiple Chart
IPSOS
View slide
Includes text descriptions with accompanying icons related to survey insights on hospital priorities in SEA.
Market Analysis and Trends
Healthcare & Pharmaceuticals
Provides an overview of an annual survey conducted by L.E.K. to understand hospital priorities in the SEA region, highlighting key decision areas.
SEA region, hospital priorities, survey, healthcare, MedTech
false
Every year, L.E.K. surveys several hundred hospitals across the SEA region to understand their priorities and to support MedTech and pharma companies as they make key decisions2023 APAC Hospital Insights Survey Findings for Healthcare Providers
Diagram
LEK
View slide
A complex slide with a balance between text and structured lists, comparing traditional assets under supervision (AUS) and alternative asset strategies.
Market Analysis and Trends
Financial Services
It analyzes a financial institution's asset management depth, contrasting traditional asset supervision with alternative investment strategies, to inform about breadth of offerings and strategic asset allocation.
asset management, strategy, investment, traditional, alternatives
false
Breadth and Depth Across Various DimensionsAsset & Wealth Management
Table
Goldman Sachs
View slide
The slide presents two column charts, the first illustrating the growth in revenue and expenses for CIB Treasury Services, and the second showing operating and non-operating deposits growth across client segments and regions.
Financial Performance
Financial Services
Geared towards financial strategists and investors, it highlights the robust growth of CIB Treasury Services, with a focus on revenue increases, expense management, and deposit growth, essential for evaluating business health and operational strategy.
CIB, treasury services, revenue growth, expense management, deposits, operational strategy, financial health
false
CIB Treasury Services business has grown significantly since 2016 through a combination of rising rates and organic growthCorporate & Investment Bank 2019
Multiple Chart
JP Morgan
View slide
Slide with three pie charts showing 2024 revenue guidance by segment, 2023 gross margin mix, and 2023 revenue by geography.
Financial Performance
Professional Services
This slide breaks down Gartner's financial performance, presenting revenue guidance, gross margin mix, and revenue distribution by geography.
Gartner, financial performance, revenue guidance, gross margin, geography
false
Gartner by the NumbersGartner Introduction
Multiple Chart
Gartner
View slide
Pie charts and text outlining asset class split, investment strategies, and medium-term priorities.
Strategic Planning
Financial Services
It discusses AM's strategic positioning and priorities, including asset class diversification and growth market strategies.
asset classes, investment strategies, AM, growth markets, diversification
false
AM – Improved positioning across key asset classes and growth marketsFourth quarter 2023 Fixed Income investor presentation
Multiple Chart
UBS
View slide
The slide summarizes strategic focus areas through four segments with icons and brief descriptions: delivering products, software development capabilities, data power, and customer protection. It employs a clear layout with each segment distinctly color-coded for emphasis.
Strategic Planning
Financial Services
Summarizes the bank's strengths in delivering products, enhancing software development, leveraging data, and protecting customers with a focus on technology.
Strategic Planning, Product Differentiation, Financial Services, Technology, Data Utilization, Cybersecurity, Customer Protection
false
We are well positioned to differentiate ourselves with technologyGlobal Technology
Pillar
JP Morgan
View slide
This slide uses a combination of column charts, tables, and text boxes. It includes financial data and visual representations of IPO trends.
Market Analysis and Trends
Financial Services
The slide shows the decline in IPOs and proceeds in the US and Canada, highlighting key stock exchanges, sectors, and notable IPOs.
IPOs, US NASDAQ, NYSE, stock exchanges, sectors
false
US and Canada saw notable slowdown; no IPOs in Brazil and MexicoHow can you find the clarity to steer your growth?
Multiple Chart
EY
View slide
The slide contains line charts comparing changes in the Consumer Price Index by CO2 accounting methods for EU27+UK and China, both production-based and consumption-based. It includes text explanations above the charts and color-coded lines for domestic and import data.
Regulatory and Compliance
Energy & Utilities
Discusses the impact of adopting a consumption-based accounting method on price indices for domestic and imported goods, suggesting a smoother change for domestic products compared to the production-based approach.
CO2 accounting, price index, domestic, import, consumption-based
false
Adopting the consumption-based accounting method — where CO2 is considered a commodity embedded in goods — could help drive this transformation.The green transition
Multiple Chart
EY
View slide
Slide contains column chart with projected earnings growth, expense savings, and balance sheet optimization, set against blue and yellow highlights.
Financial Performance
Financial Services
Outlines the strategic path to achieving earnings growth and target returns, emphasizing efficiency, revenue growth, and balance sheet management.
Earnings Growth, Target Returns, Revenue, Expenses, Balance Sheet, Efficiency
false
We Are On Path to Deliver Meaningful Earnings Growth & Achieve Target ReturnsGlobal Consumer Banking
Single Chart
Citigroup
View slide
The slide features three pie charts illustrating the survey results of over 25 local and foreign investors categorized by origin (foreign/local), fund size, and role (investment officer/manager, founder/CEO, partner/director).
Market Analysis and Trends
Financial Services
This slide captures investor outlook and priorities by surveying more than 25 investors, providing insights into their categories, fund sizes, and roles within the investment landscape.
investor survey, outlook, priorities, local, foreign, fund size, investment role
false
To capture investor outlook and priorities, we interviewed more than 25 local and foreign investorsIndonesia Venture Capital Outlook 2017
Multiple Chart
Kearney
View slide
The slide presents a composite of bar charts and a list, comparing data between the years 2023 and 2024 in terms of business leaders' expectations for revenue, profits, and headcount. It also shows business planning priorities in a vertical list layout. The graphical elements are well organized, using color differentiation for each year.
Strategic Planning
Financial Services
This analytical slide illustrates the optimistic projections for 2024 by business leaders, with a focus on revenue, profits, headcount, and strategic planning. It provides valuable insights for companies preparing for the year ahead and serves as a tool for strategic business planning, indicating areas of expected growth and potential changes in operational focus.
Business Outlook, Revenue Growth, Profit Expectations, Strategic Planning, Operational Focus
false
Leaders expecting a positive 2024The Innovation Economy Outlook
Multiple Chart
JP Morgan
View slide
Contains multiple vertical bar charts comparing quarterly internet advertising revenues for 2019 and 2020. Colors differentiate the quarters, with annotations for percentage changes.
Market Analysis and Trends
Media & Entertainment
Discusses the significant quarterly fluctuations in internet advertising revenues during 2020 and the strong recovery in the second half despite initial pandemic impacts.
advertising, revenue, quarterly, internet, recovery, COVID-19, fluctuation, media, technology
false
COVID’s impact is evident in Q2 but recovery is impressive in the second halfInternet Advertising Revenue Report 2020 full year results
Single Chart
PwC/Strategy&
1
...
Next
Load More
Hold On!
We are searching in our database
If nothing, comes up, please try different filters!
Create a FREE account to continue browsing
Receive Instant Access to 8,000+ of the internet's best slides
First Name
Last Name
Email
Password
I agree to all
Terms & Privacy Policy
Thank you! Your submission has been received!
Oops! Something went wrong while submitting the form.
Have an account?
Sign in
Column Chart
Heatmap
Chevron
Org Chart
Infographic
Callouts
Timeline
List
Graphic
Picture
Process Flow
Diagram
Paragraph
Map
Table
Framework
Subtitle
Takeaway Box
Icon
Other Chart
Radar Chart
Waterfall Chart
Mekko Chart
Pie Chart
Scatter Plot
Line Chart
Bar chart
Bullet points