My Account
My Slides
Leave Feedback
Login
Logout
Get Started
Browse all Slides
Browse Slides Pro
Create a FREE Account
Instant access to 1,000+ real slides from top companies like McKinsey, BCG, Goldman Sachs, Google and many more!
First Name
Last Name
Email
Password
I agree to all
Terms & Privacy Policy
Thank you! Your submission has been received!
Oops! Something went wrong while submitting the form.
Have an account?
Sign in
Instant access to the internet's best slides
Get access to 40+ advanced filters and more
Advanced Search and Filters
Access to
8,000+ slides
Access to Category Pages
Save/Bookmark Slides
PowerPoint Template Library (Coming Soon)
Choose your plan
MONTHLY
$12/month
Billed every month, cancel anytime.
YEARLY
$9/month
Billed $108 annually, cancel anytime.
Checkout for $12/month
Checkout for $108/yr
Secured by Stripe | AES-256 bit encryption
Welcome,
Welcome
Upgrade to SlideStart
Pro
Instant access to 8,000+ slides
Show Featured Only
Checkbox 8
Companies
Mckinsey
Bain
BCG
EY
Deloitte
Accenture
PwC/Strategy&
JP Morgan
Goldman Sachs
Morgan Stanley
Citigroup
Deutsche Bank
Barclays
LEK
Kearney
Oliver Wyman
Booz Allen Hamilton
Gartner
IPSOS
Nielsen
Slide type
Header Horizontal
Framework
Vertical Flow
Single Chart
Single Chart
Text Only
Mixed Chart
Header Vertical
Graphic
Pillar
Multiple Chart
Agenda
Title
Table
Linear Flow
Upgrade to SlideStart
Pro
Instant access to 40+ advanced filters
Industry
Upgrade to SlideStart
Pro
Instant access to 40+ advanced filters
Technology
Healthcare
Financial Services
Consumer Goods
Energy & Utilities
Manufacturing
Retail
E-commerce
Logistics
Telecommunications
Real Estate
Professional Services
Education
Media
Entertainment
Hospitatlity
Tourism
Agriculture
Food Production
Government & Public Sector
Environmental
Sustainability
Use Case
Upgrade to SlideStart
Pro
Instant access to 40+ advanced filters
Sales and Business Development
Mergers and Acquisitions
Corporate Finance and Valuation
Performance Metrics and KPIs
Client Case Studies
Competitive Landscape
Product and Service Analysis
Customer and Market Segmentation
Organizational Structure
Human Resources and Talent Management
Industry Overview
Regulatory and Compliance
Risk Assessment and Management
Agriculture & Food Production
Hospitality and Tourism
Government
Environmental
Sustainability
Clear all
Thank you! Your submission has been received!
Oops! Something went wrong while submitting the form.
Show Featured Only
Checkbox 8
Companies
Mckinsey
Bain
BCG
EY
Deloitte
Accenture
PwC/Strategy&
JP Morgan
Goldman Sachs
Morgan Stanley
Citigroup
Deutsche Bank
Barclays
LEK
Kearney
Oliver Wyman
Booz Allen Hamilton
Gartner
IPSOS
Nielsen
Slide type
Text Only
Linear Flow
Vertical Flow
Single Chart
Header Horizontal
Mixed Chart
Header Vertical
Pillar
Multiple Chart
Graphic
Agenda
Title
Table
Framework
Industry
Technology
Healthcare
Financial Services
Consumer Goods
Energy & Utilities
Manufacturing
Retail
E-commerce
Logistics
Telecommunications
Real Estate
Professional Services
Education
Media
Entertainment
Hospitatlity
Tourism
Agriculture
Food Production
Government & Public Sector
Environmental
Sustainability
Use Case
Sales and Business Development
Mergers and Acquisitions
Corporate Finance and Valuation
Performance Metrics and KPIs
Client Case Studies
Competitive Landscape
Product and Service Analysis
Customer and Market Segmentation
Organizational Structure
Human Resources and Talent Management
Industry Overview
Regulatory and Compliance
Risk Assessment and Management
Agriculture & Food Production
Hospitality and Tourism
Government
Environmental
Sustainability
Clear all
Thank you! Your submission has been received!
Oops! Something went wrong while submitting the form.
Tag
View slide
Column charts, geographic distribution charts.
Market Analysis and Trends
Retail & E-commerce
Analyzes trends in the secondhand luxury goods market.
secondhand, luxury, market, growth, US
false
LUXURY SECONDHAND MARKET ON THE RISE, INCREASINGLY BECOMING PART OF THE ECOSYSTEMBAIN-ALTAGAMMA 2019 WORLDWIDE LUXURY MARKET MONITOR
Mixed Chart
Bain
View slide
The slide includes a horizontal bar chart showing agreement and disagreement percentages on various financial attitudes, with detailed text descriptions. White background, minimalistic design.
Market Analysis and Trends
Financial Services
This slide highlights shifts in Canadian investors' financial priorities due to the pandemic, including a focus on saving, debt repayment, and extended work years for retirement savings.
financial attitudes, saving, debt repayment, retirement, COVID-19
false
Changing Financial AttitudesINVESTING AND THE COVID-19 PANDEMIC
Mixed Chart
IPSOS
View slide
The slide contains two column charts displaying trends in payments revenue and average deposit balances. Textual content with bullet points offers additional context on the side.
Financial Performance
Financial Services
This slide demonstrates the growth in payments revenue and deposit balances, emphasizing the company's strength in market share gains and liquidity management. It showcases numerical data reflecting the trend over several years, with a focus on continued momentum and market dynamics.
Payments revenue, deposit balances, market growth, liquidity
false
Robust growth in payments and liquidityInverstors Day 2023
Multiple Chart
JP Morgan
View slide
Contains a column chart that compares SACU receipts over three fiscal years, with each year represented by a column colored in orange.
Regulatory and Compliance
Government & Public Sector
Analyzes the SACU receipts from previous, current, and projected fiscal years, providing insights into economic trends and regional financial contributions. This information is crucial for assessing economic health and regional cooperation within the Southern African Customs Union.
SACU, Receipts, Budget, Forecasting, Economic analysis
false
2023/24 Annual Budget Speech: SACU ReceiptsDissecting the 2023/24 Annual Budget Speech
Single Chart
PwC/Strategy&
View slide
Includes pie charts and bar graphs detailing deposit sources and allocations by business unit within Citibank. Highly detailed with key financial figures.
Financial Performance
Financial Services
Provides a comprehensive view of Citibank's deposit diversification and stability, highlighting key business units and regional contributions. Useful for understanding liquidity management and investment safety.
deposit sources, financial stability, Citibank, business units, liquidity management
false
3Q23 Deposit Diversification and StabilityThird Quarter 2023 Earnings Results Presentation
Multiple Chart
Citigroup
View slide
List format with icons, descriptive text, and benefits. Blue and white color scheme.
Product and Service Analysis
Healthcare & Pharmaceuticals
Details recent technological advances in bioengineering and their practical applications.
Bioengineering, Technology, Advancements, Healthcare
false
What are the most noteworthy technologies?McKinsey Technology Trends Outlook 2022 Future of bioengineering
Header Vertical
McKinsey
View slide
Slide features multiple pie charts and icons, highlighting executives' views on climate change and its urgency. Colors are green and black.
Regulatory and Compliance
Environmental Services & Sustainability
Details executives' perceptions of climate change's severity and the optimism for effective response, highlighting increased awareness and urgency.
climate change, executives, perceptions, urgency, optimism, regulatory, compliance, environmental sustainability
false
Most executives believe the world is at a tipping point for responding to climate change, yet optimism is risingDeloitte 2022 CxO Sustainability Report
Multiple Chart
Deloitte
View slide
This slide includes multiple triangular diagrams illustrating the impact of technology, process, data, and talent on operational maturity. The visuals are effectively used to compare the influence of each factor.
Strategic Planning
Professional Services
Highlights how different operational levers affect the maturity and efficiency of business operations. Essential for strategic decision-making and resource allocation in organizational development.
Operational Efficiency, Maturity Levels, Strategy
false
Figure 2. The peak multiplier impact of applying each of the four levers to achieve future-ready operations maturityThe Value Multiplier: Intelligent Operations Maturity
Mixed Chart
Accenture
View slide
The slide contains four doughnut charts illustrating attitudes towards ESG risks and opportunities among investors. Accompanied by bullet points, each chart is encircled by a yellow ring indicating percentage agreement. The slide's background is white with minimal design elements to emphasize the data.
Market Analysis and Trends
Financial Services
This slide evaluates the economic impacts and challenges related to ESG (Environmental, Social, and Governance) factors in investment decisions. It highlights that a significant percentage of investors consider ESG risks important and expect companies to integrate ESG targets into executive pay, despite potential impacts on short-term profitability.
ESG, Investors, Risks, Opportunities, Executive Pay, Profitability, Doughnut Chart
false
The economic realities and challengesBoardroom Agenda
Multiple Chart
PwC/Strategy&
View slide
Slide with comparative data in bar graph format, emphasizing regional differences in executive confidence and outlook for 2023, using green, red, and gray color scheme.
Market Analysis and Trends
Professional Services
Compares the optimism and confidence among C-suite leaders globally, highlighting regional variations and strategic concerns for 2023.
C-suite, optimism, strategy, 2023, global
false
C suite leaders go into 2023 generally optimistic, but less confident about their company's ability to outperformThe CEO Outlook Caution, Optimism, and Navigating the Road Ahead
Multiple Chart
BCG
View slide
Column charts for revenues, detailed text boxes with key financials
Financial Performance
Financial Services
Results and highlights for personal banking and wealth management sectors
Personal Banking, Wealth Management, Revenue, Column Chart, Financials
false
Personal Banking and Wealth Management ResultsEarnings Results Presentation
Mixed Chart
Citigroup
View slide
Slide with multiple horizontal bar charts in teal, illustrating the relative importance of various stakeholders in the food ecosystem.
Customer and Market Segmentation
Agriculture & Food Production
Evaluates how companies perceive the importance of various stakeholders in advancing the food ecosystem agenda, useful for strategic decisions in food sustainability practices.
Food Ecosystem, Stakeholders, Importance, Strategic Decisions, Sustainability
false
Relative importance of food ecosystem playersThe Future of Food Challenges & opportunities
Mixed Chart
Deloitte
View slide
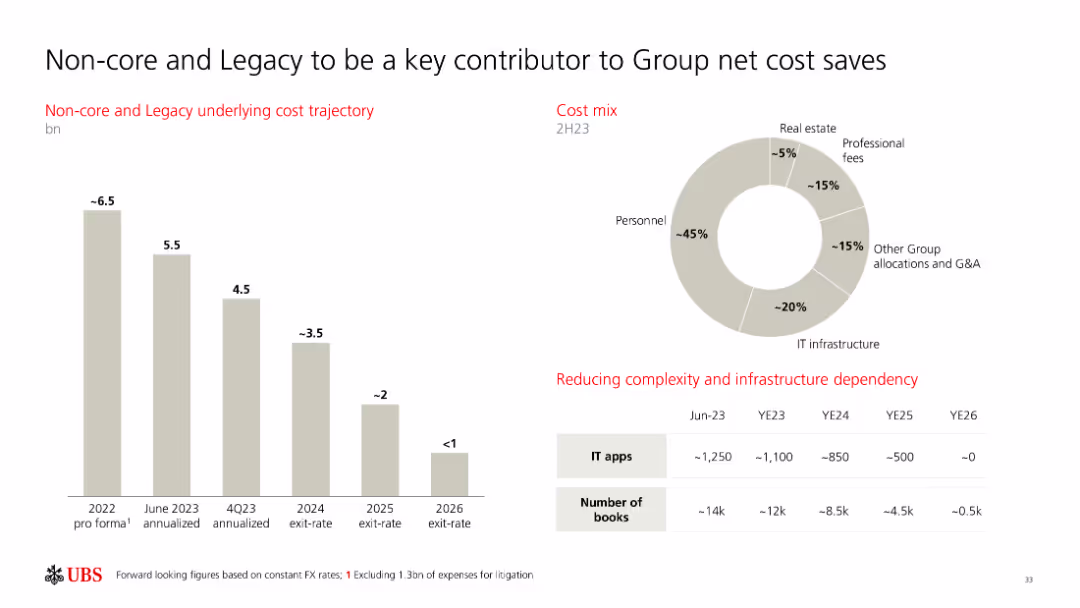
The slide includes a column chart for cost trajectory and a pie chart for cost mix, along with a table showing the reduction in complexity and infrastructure dependency.
Operational Efficiency
Financial Services
This slide outlines the contributions of non-core and legacy segments to the group’s net cost savings, highlighting cost trajectory and mix, and infrastructure reduction.
cost savings, non-core, legacy, cost mix, infrastructure
false
Non-core and Legacy to be a key contributor to Group net cost savesFourth quarter 2023 Results and investor update
Multiple Chart
UBS
View slide
Contains bar and column charts comparing incentives for various clean technologies like hydrogen and carbon capture.
Regulatory and Compliance
Energy & Utilities
Reviews governmental incentives for scaling clean technologies, crucial for policy analysis and energy sector planning.
clean technology, incentives, hydrogen, carbon capture, energy policy, regulatory, energy sector
false
Clean tech | Significant incentives to help scale clean hydrogen, CCUS, and DACUS Inflation Reduction Act: Climate & Energy Featuresand Potential Implications
Multiple Chart
BCG
View slide
This slide features column charts comparing resilience levels across different industries such as Utilities, Consumer Products, etc., marked with lines indicating quartiles.
Market Analysis and Trends
Financial Services
The slide presents Bain Resilience Index benchmarks for various industries, illustrating the variance in resilience among Nordic non-financial companies.
Resilience, Nordic companies, Industry comparison, Benchmarking, Utilities, Consumer Products, Technology, Healthcare
false
We see significant variance in resilience levels amongst Nordic companiesIntroduction to Bain & Company
Single Chart
Bain
View slide
A diagram depicting various business areas supported by CTOO, including Wealth Management, Investment Bank, Swiss Bank, and Asset Management, with metrics for each area.
Technology and Digital Transformation
Technology & Software
This slide illustrates the support provided by Technology and Operations (CTOO) across different business areas, showcasing key metrics and the scale of foundational infrastructure.
technology, operations, business, support, metrics
false
Technology and Operations (CTOO) supports our business todayInvestor Deep Dive 2022
Diagram
Credit Suisse
View slide
The slide shows a benchmarking set of AEP scores across various categories with bar charts indicating leader and other averages.
Performance Metrics and KPIs
Professional Services
It benchmarks AEP scores for team excellence, organizational alignment, buy/pay channels, performance management, and more, indicating quartile rankings.
AEP scores, benchmarking, team excellence, performance management, digital technology, organizational alignment
false
How do we identify Procurement Leaders in our research?Excellence in Procurement
Multiple Chart
Kearney
View slide
Column charts illustrating foreign investment projects in various sectors across the top three European economies.
Market Analysis and Trends
Financial Services
This slide highlights the strategic sector leadership of France, UK, and Germany in foreign investment projects.
strategic sectors, economies, investment, Europe, R&D
false
The three largest economies lead in the strategic sectorsHow can Europe turn on the taps of foreign investment?
Multiple Chart
EY
View slide
Features a large central image with three text sections on the sides, focusing on challenges and discussions around digital trust.
Technology and Digital Transformation
Telecommunications
Details the debates regarding stakeholder expectations, data and privacy regulation, and risk area identification.
digital trust, stakeholder expectations, privacy regulation, risk identification
false
What are some topics of debate related to the trend?McKinsey Technology Trends Outlook 2022 Trust architectures and digital identity
Header Vertical
McKinsey
View slide
Features flow charts and lists that compare traditional vs. holistic approaches to cost management.
Strategic Planning
Professional Services
Advocates for integrating cost management tools beyond conventional programs to improve decision making.
cost reduction, holistic, integration, decision making
false
Bridging cost reduction programs and cost managementStrategic Cost Transformation Grab’n Go session
Boxed
Deloitte
View slide
This introductory slide features a circular diagram with four segments around a central label 'Clients', designed with shades of blue and black. Brief texts accompany icons symbolizing trust, client-centricity, and global reach.
Organizational Structure and Change
Financial Services
Introduces the company's focus on client relationships and outlines the core areas of service. It sets the stage for discussions on company values, structure, or strategic direction.
Client Relations, Core Services, Company Values
false
Our Client Franchise is the Foundation of Our Firm One Goldman SachsState of the Franchise
Framework
Goldman Sachs
View slide
Contains multiple screenshots showcasing mobile payment options across different regions (U.S., Asia, Mexico) with a side layout of mobile interfaces and column charts depicting growth in installment sales. The slide is well-organized into distinct sections for clarity.
Operational Efficiency
Financial Services
Focuses on the implementation of point-based payments via mobile, displaying significant cost savings and efficiency improvements in card services. It shows the impact of digital integration on spending habits and lending practices, demonstrating the operational efficiency gained.
mobile payments, cost savings, operational efficiency, digital transformation, lending
false
Cards: Innovating to Grow Both Spend and LendGlobal Consumer Banking
Mixed Chart
Citigroup
View slide
An organizational chart with categories like 'Retail sales-people' and 'Food and beverage service workers', alongside icons representing different workplace activities.
Strategic Planning
Technology & Software
Maps out the automation potential in various job roles, focusing on activities that can be automated and the capabilities required for each, such as social and cognitive skills.
Workforce, Automation, Job Roles, Capabilities, Skills
false
Our approach focuses on activities and capabilities of currently demonstrated technologiesA FUTURE THAT WORKS: AI, AUTOMATION, EMPLOYMENT, AND PRODUCTIVITY
Table
McKinsey
View slide
Two-column text-heavy layout with Circular diagram split into four quadrants illustrating skill distribution within GBS roles.
Organizational Structure and Change
Professional Services
Discusses key skills for GBS effectiveness and strategic value, highlighting areas like leadership and action orientation.
GBS, skills, strategy, leadership, action-oriented
false
GBS operations: Aligning with the bigger pictureGlobal Business Services Performance improvement
Diagram
Deloitte
View slide
This slide presents a comparative analysis with two distinct sections. The left side displays a blue column chart depicting 'ADJUSTED OPERATING PROFIT' in euros for five quarters. Beside it, a pie chart illustrates the 'Q1 adjusted operating profit margin.' The right side shows a column chart breaking down profits by business segment. Images of a modern office space are shown in the upper and lower right corners, offering a visual context for the financial data.
Financial Performance
Financial Services
Compares profitability across different business segments, highlighting improvements and variations, relevant for financial segment analysis or presentations to investors.
profitability, financial segments, adjusted operating profit, profit margin, quarter comparison, financial data, segment analysis, real estate, construction, financial services
false
Profitability improved, variation between segmentsGoldman Sachs Symposium presentation
Multiple Chart
Goldman Sachs
View slide
Features a combination of pie charts and column charts outlining income sources and comparing market positions with other top banks.
Competitive Landscape
Financial Services
Provides an insight into Barclays' market position in investment banking globally, highlighting areas like fee income and market share.
banking, market position, fee income, investment, competitiveness
false
Investment Banking todayFY 2023 Results Announcement
Multiple Chart
Barclays
View slide
This slide shows a bar chart with percentages indicating public opinion on how early childhood affects various aspects of later life, such as mental health and relationships.
Market Analysis and Trends
Education & Training
It underscores that many believe early childhood significantly impacts mental health and well-being, as well as relationships and happiness.
Early childhood, mental health, impact, bar chart, public opinion, Ipsos, education, development, survey
false
There is high recognition of how early childhood affects mental health in later lifeUnderstanding public attitudes to early childhood
Single Chart
IPSOS
View slide
Diagram illustrating how complex AI/ML models can be made interpretable through certain techniques.
Technology and Digital Transformation
Technology & Software
Explains techniques for making AI/ML models interpretable, aiding in understanding and trust of AI systems.
AI/ML, interpretability, models, techniques
false
Unpacking the ‘black box’AI/ML use in Risk Management and Compliance PwC Actuarial, Risk & Quants
Diagram
PwC/Strategy&
View slide
This slide features a large pie chart detailing loan composition with categories such as German Mortgages, Leveraged Debt Capital Markets, and others, accompanied by a legend differentiating sectors like Corporate Bank and Private Bank.
Market Analysis and Trends
Financial Services
Displays a breakdown of a bank's loan portfolio by type and bank division, emphasizing the prominence of mortgages in their portfolio and providing strategic insights into the bank’s lending focus.
loans, banking, portfolio, mortgages, finance
false
Loan book composition Q4 2023, IFRS loans: € 479bn1Q4 / FY 2023 Fixed Income Investor Conference Call
Mixed Chart
Deutsche Bank
View slide
A structured layout with categorized initiatives for various industries, highlighting specific digital trends and strategies.
Industry Overview
Technology & Software
Summarizes key digital initiatives across industries like healthcare, logistics, and telecommunications, aiming to guide strategic planning and innovation efforts.
Strategic Initiatives, Digital Transformation, Industry Overview, Future Trends, Multi-Industry
false
SUMMARY OF OVER 130 INITIATIVES IMPACTING 12 INDUSTRIES OVER THE NEXT DECADE (1 OF 2)Digital Transformation Initiative In collaboration with Accenture
Table
Accenture
View slide
This slide has a column chart comparing doctors and hospital beds per '000 population across various countries. The background is white with blue and red bars, country flags, and a minimal text description.
Market Analysis and Trends
Healthcare & Pharmaceuticals
The slide presents healthcare statistics by country, focusing on the availability of doctors and hospital beds per '000 population. It is designed to highlight disparities in healthcare resources in the Asia-Pacific region.
Healthcare, Statistics, Access, Doctors, Hospital Beds, Asia-Pacific, Disparities, Resources, Comparison, Countries
false
Access to healthcare is a chronic challenge around the regione-Conomy SEA 2020 At full velocity: Resilient and racing ahead
Single Chart
Bain
View slide
The slide uses a matrix layout with color-coded cells indicating performance in various retail categories.
Market Analysis and Trends
Retail & E-commerce
Provides a detailed breakdown of retail sales by category, showing the different recovery rates post-COVID-19.
retail categories, sales breakdown, COVID-19 recovery
false
De-averaged view | Retail store sales in China recovering across categories; apparel sales continue to be lowCOVID-19 BCG Perspectives Series Global Restart: Key Dynamics
Table
BCG
View slide
A column chart showing the percentage of people who trust business leaders to tell the truth across various countries, with global averages highlighted.
Market Analysis and Trends
Government & Public Sector
The slide presents data on trust in business leaders globally, showing higher trust in emerging markets compared to developed ones.
business leaders, trust, emerging markets, developed markets, column chart, percentages
false
Trust in business leaders is much higher in emerging marketsA NEW WORLD DISORDER?
Multiple Chart
IPSOS
View slide
Column and dot graphs showing the density of highly skilled workers and total labor force in various countries.
Strategic Planning
Professional Services
Analyzes the labor market potential by assessing the density of skilled workers and their distribution across multiple countries.
Labor market, skilled workers, workforce density, strategic planning
false
Figure 2: Rethinking labor market potentialRe-focus your talent lens: Abundance awaits
Single Chart
Accenture
View slide
Pie chart slide comparing the percentage of TV time spent streaming in February 2021 and February 2022, with distinct color segments for different streaming services.
Market Analysis and Trends
Media & Entertainment
Compares the growth in TV streaming time over a year, showing an increase in streaming's share and the distribution across various services.
TV streaming, growth, comparison, streaming services, time spent
false
TV time spent with streaming is growing February 2021Spring 2022 National Client Meeting
Multiple Chart
Nielsen
View slide
This slide presents multiple bar charts showing the year-over-year change in vehicle sales per country.
Strategic Planning
Transportation & Logistics
Highlights trends in passenger vehicle sales post-COVID-19, with data showing significant recovery or growth spikes in various regions.
vehicle sales, trends, COVID-19, recovery
false
Monthly passenger vehicle sales show promising upward trendsWhat the Evolution of Travel Means for Business
Multiple Chart
BCG
View slide
The slide features a column chart showing the number of mega IPOs and their proceeds from Q1 2020 to YTD 2023, with a focus on energy sector IPOs.
Market Analysis and Trends
Financial Services
This slide analyzes the trend of mega IPOs, particularly in the energy sector, noting a significant decline in deal value and an expectation for future increases as market sentiment improves.
IPO, mega deals, valuation, sentiment, energy
false
Mega IPOs are waiting until better valuation and sentiment returnHow do you prepare now for the moment your IPO is ready to take flight?
Single Chart
EY
View slide
The slide features bar charts showing US consumer behavior in terms of price sensitivity (sticker shock) and substitutability (trading down) from March 2022 to February 2023. Commentary on the right explains observed trends.
Market Analysis and Trends
Consumer Goods
The slide analyzes US consumer behavior under inflationary pressures, showing reduced price sensitivity and trading down trends since early 2023. It suggests that consumers are still cautious about prices despite slight easing of headline inflation.
US consumer behavior, price sensitivity, inflation, trends, trading down
false
US consumers report reductions in their price sensitivity and pressure to trade down since the beginning of 2023, but both metrics remain elevated amidst persistent inflationMarch Macro Brief Financial fissures emerge
Multiple Chart
Accenture
View slide
Contains a column chart showing the Return on Equity (ROE) in 2017 and 2018 with contributing factors like revenue, rates, and expenses indicated by arrows and percentages along the bars.
Financial Performance
Financial Services
This slide is meant for financial professionals, focusing on the factors contributing to the increase in Return on Equity (ROE) from 2017 to 2018, which is crucial for assessing company performance and making investment decisions.
ROE, financial analysis, 2017, 2018, revenue, rates, expenses, investment decision
false
ROE increased from 14.5% in 2017 to 15.9% in 2018Corporate & Investment Bank 2019
Single Chart
JP Morgan
View slide
Displays a multi-part column chart, detailing second-hand market behaviors between Chinese and US consumers in green and yellow tones.
Market Analysis and Trends
Retail & E-commerce
Compares second-hand luxury market behaviors between Chinese and US consumers, highlighting differences in selling and buying trends.
market behavior, Chinese consumers, US consumers, second-hand luxury, buying and selling trends
false
Chinese True-Luxury consumers biased to selling 2nd-hand luxury, while US biased to purchasing2019 True-Luxury Global Consumer I nsight
Single Chart
BCG
View slide
Column charts with detailed annotations showing different capital ratios and leverage ratios for 3Q22. The slide has a clean design with focus on key financial metrics.
Financial Performance
Financial Services
This slide presents various capital and leverage ratios, including CET1 capital ratio guidance and TLAC buffer requirements for 3Q22.
capital, leverage, CET1, TLAC, buffer
false
Capital and leverage ratios Total loss-absorbing capacity (TLAC)Third quarter 2022 Financial results
Multiple Chart
UBS
View slide
With a blue theme, this slide has two main columns comparing common issues with best practices in hiring, accompanied by related icons and labeled sections.
Human Resources and Talent Management
Technology & Software
It advocates for a seamless hiring process to ensure a positive candidate experience, targeting HR teams and recruitment strategies.
hiring process, candidate experience, HR, recruitment, best practices, common issues
false
Ensure clear communication and a smooth hiring process to maintain an overall positive candidate experienceASEAN Growth and Scale Talent Playbook
Header Horizontal
Kearney
View slide
A pie chart showing the percentage distribution between tax revenue and non-tax revenue for the fiscal year 2019/20. The chart is colored in shades of gray, with a clear distinction between the two categories.
Financial Performance
Government & Public Sector
This slide presents a clear visual representation of the revenue sources for a government, highlighting the overwhelming dependence on tax revenue compared to non-tax sources. It provides a foundational understanding for discussions on fiscal policy and revenue management strategies.
tax revenue, non-tax revenue, fiscal policy, government finance, budget
false
Tax Revenue vs. Non-Tax RevenueBudget on a plate 2019/2020
Single Chart
PwC/Strategy&
View slide
Slide includes stacked column charts displaying credit losses and stages of loans across different banking sectors.
Risk Assessment and Management
Financial Services
Analyzes credit loss provisions and the status of stage 3 loans in Q1 2023 across various banking divisions, illustrating risk management and credit performance within the bank.
credit losses, loans, risk management, Q1 2023
false
Provision for credit losses and stage 3 loansQ1 2023 results
Multiple Chart
Deutsche Bank
View slide
This slide presents a column chart with estimated completions of consumer apartment projects under construction, divided by quarters and marked with 'ACT' for actual and 'EST' for estimate. A sidebar contains additional notes on revenue from apartments under construction.
Market Analysis and Trends
Real Estate & Construction
The slide shows trends in housing completions, indicating declines and a forecasted peak, likely used for analyzing market dynamics or for investment planning.
Construction, Market Trends, Forecast, Housing, Revenue, Apartments, Peak, Decline, Q4, Estimations
false
Number of completions declining, completions expected to peak again in Q4Goldman Sachs Symposium presentation
Multiple Chart
Goldman Sachs
View slide
This simple layout slide displays a three-point agenda, each with a title and sub-points, set against a backdrop of a molecular structure graphic.
Strategic Planning
Financial Services
The agenda outlines the main topics for the presentation, including an executive summary, financial and business details, and additional backup information.
Agenda, Executive Summary, Details, Backup
false
AgendaLANXESS – Morgan Stanley Cannon Ball Run Field trip
Agenda
Morgan Stanley
View slide
Uses a purple and blue gradient color scheme with a line graph displaying revenue growth. Graph markers indicate key financial milestones.
Market Analysis and Trends
Healthcare & Pharmaceuticals
Illustrates the revenue growth trajectory of Experian Health, aiming for a target beyond US$1 billion. Suitable for strategic presentations to investors or internal stakeholders focusing on growth in the healthcare sector.
revenue growth, healthcare market, Experian Health, financial targets
false
Experian HealthBarclays Global Credit Bureau Forum
Single Chart
Barclays
View slide
This slide includes a column chart and textual data illustrating the strategy for on-balance sheet alternative investments.
Strategic Planning
Financial Services
Designed for strategic planning discussions, showcasing the firm’s approach to optimizing alternative investments on the balance sheet and their intended financial trajectory, with projections and capital allocation.
alternative investments, balance sheet, strategy, capital allocation
false
Optimizing On-Balance Sheet Alternative InvestmentsAsset & Wealth Management
Single Chart
Goldman Sachs
View slide
Slide with textual content and icons, comparing objectives, strengths, and opportunities in two-column format. Uses iconography for visual emphasis on certain points.
Strategic Planning
Financial Services
Communicates strategies and objectives of a financial institution, illustrating the foundation of strengths and addressing opportunities.
strategies, objectives, banking, growth, opportunities, strengths, financial planning, market share, customer experience, innovation
false
We are pursuing strategies to be the bank for all, extend our presence, and grow wallet shareConsumer & Community Banking
Table
JP Morgan
View slide
Two column charts showcase the growth of CB payments fee revenue and average CB deposit balances over five years, complemented by circular icons with key insights.
Operational Efficiency
Financial Services
Discusses the impact of JPMC's integrated and digital payment solutions on fostering client relationships and deposit growth, reflecting strong momentum and digital capability enhancement.
payments solutions, deposit growth, JPMC, digital transformation, client relationships, fee revenue, market trends
false
Comprehensive payments solutions drive deep relationships and core operating depositsCommercial Banking 2022
Multiple Chart
JP Morgan
View slide
Various pie and column charts with financial data, text blocks outlining investment strategies, and key metrics in deposit growth. A logo is present.
Financial Performance
Financial Services
The slide covers the bank's deposit growth strategy, emphasizing investments in branches, products, and data-driven insights. Used for financial updates and demonstrating growth in the banking sector.
deposit growth, investment strategy, banking, financial data, consumer accounts, treasury
false
We have grown our high quality deposit franchise through multi year investmentsMorgan Stanley US Financials, Payments, & CRE Conference
Multiple Chart
Morgan Stanley
View slide
A column chart comparing the provision for credit losses ratio between Credit Suisse and peers from 2010 to 2021.
Risk Assessment and Management
Financial Services
The slide discusses the weaknesses in risk management revealed by the Archegos incident, highlighting the deviations from historical performance and peer comparison in terms of provision for credit losses.
risk management, credit losses, peers, historical performance, Archegos
false
Archegoshighlighted weaknesses in risk management where outcome substantially deviated from historical performanceInvestor Deep Dive 2022
Single Chart
Credit Suisse
View slide
The slide features two pie charts and a column chart showing the growth of digital consumers in the Philippines.
Market Analysis and Trends
Technology & Software
Captures the Philippines' notable increase in digital consumers who are likely to continue using internet services post-COVID-19.
Digital consumers, Philippines, Growth, Internet services, COVID-19, Usage trends, Continuity
false
Philippines Exponential growth of digital consumers (who will stay)e-Conomy SEA 2020 At full velocity: Resilient and racing ahead
Multiple Chart
Bain
View slide
A slide with a dark background displaying a column chart of the trailing twelve months' efficiency ratio and a box detailing efficiency drivers.
Operational Efficiency
Financial Services
The slide focuses on operational efficiency, showing the efficiency ratio trend over time and identifying key drivers of efficiency improvement.
efficiency ratio, operational efficiency, cost efficiencies, revenue growth, deal-related expenses, KPIs, scaling
false
Delivering Efficiency As We ScalePlatform Solutions
Mixed Chart
Goldman Sachs
View slide
Shows growth trends in corporate decarbonization commitments alongside charts on the forecasted supply of key resources.
Strategic Planning
Environmental Services & Sustainability
Discusses the importance of early adoption in sustainability practices, correlating corporate commitments with resource scarcity forecasts. Useful for strategic and sustainability planning.
sustainability, corporate commitments, resource scarcity, strategic planning, decarbonization, early adoption
false
Capture early mover advantage | 'Sustainability scarcity' is likely, given expected rapid scale-upUS Inflation Reduction Act: Climate & Energy Featuresand Potential Implications
Mixed Chart
BCG
View slide
Pie charts and column charts depict type distribution of US CRE in a stress test and historical data on modified loans.
Investment Analysis
Real Estate & Construction
Continues from previous slide, further analyzing US CRE risk management, highlighting stress-tested portfolios and loan modification trends.
CRE, risk management, stress test, US, loan modifications, investment, real estate
false
Commercial Real Estate (CRE) 2 / 2Client & Creditor Overview May 31, 2023
Multiple Chart
Deutsche Bank
View slide
Line graph showing trends in technology investments over time, accompanied by a column chart comparing technology and business capabilities.
Technology and Digital Transformation
Technology & Software
Analyzes the impact of strong technology and business capabilities on long-term profitable growth, highlighting the importance of strategic investments.
technology investments, profitable growth, business capabilities, long-term, strategic investments, trends, line graph, bar chart
false
Companies achieving long-term profitable growth display a commitment toward developing a digital core, with a consistently higher share of investments in new technologies,Reinventing for resilience
Multiple Chart
Accenture
View slide
Slide with bar graphs displaying digital payment market shares and a section describing penetration strategies of different payment platforms.
Competitive Landscape
Financial Services
This slide presents the competitive landscape of digital payment platforms in 2019, showing market shares and penetration strategies. It's useful for analyzing market dominance and strategic linkages in the payment sector, highlighting how major players are leveraging partnerships to enhance their market position.
Market Share, Digital Payments, Penetration Strategy, Competition, Strategic Alliances
false
The digital payment market is dominated by large players with strong connections to the wider ecosystem – leaving little room for newer players.Unlocking the next wave of digital growth: beyond metropolitan Indonesia
Mixed Chart
Kearney
View slide
This slide features bar charts and a line chart detailing reasons for customer contact and priorities, with textual explanations in boxes. The design is clean and informative, using shades of blue and green to differentiate data points.
Customer and Market Segmentation
Professional Services
Discusses the primary reasons customers contact service centers and their care priorities, based on a survey. Key insights support businesses in refining customer service strategies to better meet customer needs and preferences, especially in diverse regions.
customer contact, service priorities, survey analysis, customer care, segmentation
false
Why are customers contacting us and what do they actually care about?Customer Service Excellence 2022
Multiple Chart
Deloitte
View slide
A bar chart showing the percentage of time spent on five major finance processes: Close & Reconcile, Consolidate & Report, Accounts Payable, Receivable, Planning & Budgeting, highlighting inefficiencies.
Operational Efficiency
Financial Services
Highlights the processes where the finance team spends the most time, suggesting prioritization of these for digital transformation to improve efficiency and productivity.
finance processes, time management, digital transformation, efficiency, productivity, planning, budgeting, accounts payable
false
Key Success Factor 01: Focus on the Most Time consuming Areas FirstDigital Finance Seeing is Believing
Mixed Chart
Deloitte
View slide
A column chart compares the ownership of various investment products between 2022 and 2023 among Canadians.
Market Analysis and Trends
Financial Services
It lists the most common investment products held by Canadians and compares the ownership rates between 2022 and 2023.
Investment, Products, Ownership, Canadians, 2023, 2022, Column Chart, Financial, Trends
false
Investment Products Owned The most common investment products held by Canadians were mutual funds (33%) and employee-based pension plans (33%),CRYPTO ASSET SURVEY 2023
Mixed Chart
IPSOS
View slide
Contains lists and icons to depict workforce trends on the left and their implications on the right, with emphasis on career length, generational shifts, and skill relevancy.
Technology and Digital Transformation
Professional Services
Explores future workforce trends, including the predominance of millennials and changing skill requirements, and the subsequent implications for organizations.
workforce trends, millennials, skill requirements, organizational implications, future planning
false
The Future of WorkforceFuture of Work - How work is enabled?
Framework
Deloitte
View slide
A column chart showcasing growth in podcast advertising revenue from 2015 to 2017 with a projection for 2017. The growth percentages are highlighted above each bar.
Market Analysis and Trends
Media & Entertainment
This slide analyzes the growth trends in podcast advertising revenue, showing significant increases year over year with future projections. Useful for discussions on media market trends and revenue strategies.
podcast, advertising, revenue growth, media
false
Podcast advertising revenue grew at a double-digit rate from 2015 to 2016, and the growth is forecast to build in 2017.IAB Podcast Ad Revenue Study: An Analysis of the Largest Players in the Podcasting Industry
Single Chart
PwC/Strategy&
View slide
This slide features a column chart and a numeric list detailing the impact of logistics on e-commerce deals. The colors used differentiate the segments clearly, with annotations providing insights on investment trends.
Market Analysis and Trends
Transportation & Logistics
Analyzes how logistics investments have become a major driver in e-commerce deal values, with a notable surge in H1 2021. It also touches on the growing trend of non-marketplace investment opportunities within the e-commerce realm.
E-commerce, Logistics, Investment Trends, SEA
false
Rocketing deal values in e-commerce mainly driven by logisticse-Conomy SEA 2021 Roaring 20s: The SEA Digital Decade
Mixed Chart
Bain
View slide
Simple design focusing on a pie chart with a small legend describing regional differences in processes. The color green is used to denote different responses, facilitating an easy visual distinction between categories.
Regulatory and Compliance
Healthcare & Pharmaceuticals
Discusses the consistency of processes and technology for healthcare professional engagement across different regions. It highlights varying levels of adoption and challenges in standardizing practices globally, aiming to underline the importance of unified operational strategies.
healthcare processes, regional differences, operational consistency, survey analysis
false
Survey question: Do you have consistent processes and technology for HCP Engagement across all regions?HCP ENGAGEMENT END-TO-END CONTINUUM
Single Chart
Deloitte
View slide
The slide shows a balanced layout with text on the left and related hexagonal icons on the right. It details investment approaches like "Equity," "Debt," and "Tax Credit Equity," with impacts such as "Sustainable Transport" and "Communities."
Investment Analysis
Government & Public Sector
This slide is about Goldman Sachs' Urban Investment Group and its commitment to creating commercial opportunities within communities. It is useful for presentations related to urban development, community engagement, and investment impacts on education and sustainable transport.
urban investment, Goldman Sachs, community, sustainability, finance
false
Urban Investment GroupGoldman Sachs Investor Day
Table
Goldman Sachs
View slide
This slide includes two line charts comparing Snowy 2.0 operation in Base Case and Option 3C across multiple scenarios, showing various capacity factors.
Market Analysis and Trends
Energy & Utilities
Analyzes the operational outcomes for Snowy 2.0 under different scenarios, comparing early and late increases in operations based on coal retirement assumptions.
Snowy 2.0, operation, Base Case, Option 3C, scenarios, capacity factors, coal retirement, comparison
false
Option 3C outcomes - Snowy 2.0 operationReinforcing the New South Wales Southern Shared Network (HumeLink) PADR – EY Market Modelling
Multiple Chart
EY
View slide
The slide features two side-by-side graphs: one for Henry Hub and the other for UK NBP gas prices. Each graph shows the price estimates from banks, brokers, and consultants. The background image depicts a gas facility. Text explains trends.
Market Analysis and Trends
Energy & Utilities
This slide forecasts gas prices for Henry Hub and UK NBP, comparing bank, broker, and consultant estimates. It discusses the price trends and provides average price forecasts for 2026, highlighting the wide range of estimates due to market dynamics.
Henry Hub, UK NBP, gas prices, forecasts, bank/broker, consultants
false
Gas price outlook For Henry Hub, banks and brokers (on average) forecast a wider range of oil prices throughout the forecast period. ConsultantEY Price Point: global oil and gas market outlook Q1 | January 2022
Multiple Chart
EY
View slide
Includes a complex layout with a column chart, text annotations, icons indicating outlook, and a detailed breakdown of governmental commitments and recommended actions.
Regulatory and Compliance
Energy & Utilities
Examines Vietnam's climate goals and strategies, discussing emissions profiles, government commitments, and suggested actions for clearer energy policies.
Vietnam, renewable energy, government, emissions, climate policy
false
Vietnam’s higher NDC target is modest in scale; greater clarity on coal phase-out and renewables phase-in plan needed to define how goals will be deliveredSoutheast Asia’s Green Economy 2022 Report
Mixed Chart
Bain
View slide
Features images of EV charging and regulatory icons, with quotes from major automotive CEOs about shifts towards electrification.
Strategic Planning
Transportation & Logistics
Discusses the accelerating factors and strategic responses of automotive industries toward electrification, including regulatory impacts and market dynamics.
electrification, automotive industry, regulations, battery costs, OEM strategies, market dynamics
false
Rest of decade set up for a more rapid shift to fully electrified powertrains than many forecasted 12 months earlierWhat if all vehicles were electric?
Pillar
BCG
View slide
The slide has a title at the top, text in the middle, and a column chart at the bottom showing trust levels in neighborhoods.
Risk Assessment and Management
Government & Public Sector
Presents data on neighborhood trust levels, with 81% of respondents agreeing they trust people in their neighborhood. The data compares trust levels from May and December 2020.
Neighborhood, Trust, Survey, Community, Data
false
Most trust the people in their neighbourhood (identical to May)The Impact of COVID-19 on wellbeing in Scotland: Ipsos MORI report
Single Chart
IPSOS
View slide
Graphs and charts showing shift from offline to online luxury purchasing over years
Market Analysis and Trends
Retail & E-commerce
Illustrates how luxury purchases have transitioned from physical stores to online platforms
Luxury, Market Shift, Online Purchase, Timeline
false
… driving shift of luxury from offline to onlineChina Luxury Digital Playbook
Mixed Chart
BCG
View slide
Features a column chart showing responses about the future role of crypto assets, divided into several ratings.
Market Analysis and Trends
Financial Services
The slide discusses Canadians' opinions on the future role of crypto assets, showing a split view but with a significant portion believing in their importance. It also highlights the correlation between demographics and their views on crypto.
Crypto assets, future, financial ecosystem
false
Crypto Assets FutureRole in the Financial EcosystemCRYPTO ASSET SURVEY
Mixed Chart
IPSOS
View slide
This slide presents a bar chart comparing local authorities by the number of high-growth companies, paired with a table showing total investment received.
Market Analysis and Trends
Government & Public Sector
Focuses on the distribution of high-growth companies and investment across UK local authorities, highlighting areas with significant economic activity like Edinburgh and Manchester.
local authorities, high-growth companies, economic development, investment received, regional comparison, economic hubs, UK cities, business clustering
false
Local authorities by number of high-growth companies (2021)Unlocking growth: Creating tech ecosystems to stimulate local economies
Multiple Chart
Barclays
View slide
A donut chart showing 81% of companies measure employee satisfaction.
Strategic Planning
Professional Services
Highlights the importance of measuring employee satisfaction in HR management, used for assessing HR practices.
HR, employee satisfaction, measurement, practices, assessment
false
Measurement of employee satisfactionHR Pulse Survey Presentation of results
Single Chart
PwC/Strategy&
View slide
Contains three column and icons representing different strategic areas like "Ecosystem co-innovation", "Transition support", and "Regional collaboration". It includes quotes and a brief analysis of SEA's current status in green initiatives.
Strategic Planning
Environmental Services & Sustainability
Discusses strategies for expanding the green economy in SEA through collaboration and innovation across various sectors, emphasizing the need for transition support and regional cooperation to address environmental challenges.
green economy, SEA, innovation, collaboration, sustainability
false
Ultimately, scaling SEA’s green economy will need collective action…Southeast Asia’s Green Economy 2021 Report: Opportunities on the Road to Net Zero
Pillar
Bain
View slide
This slide has a dual-topic layout with text summaries. It discusses the need for business portfolio adjustments and activism risk management, with a straightforward design for clear communication.
Strategic Planning
Professional Services
Discusses the importance for companies to adapt their business portfolios and address activism risks, useful in strategic business planning sessions.
Portfolio Management, Activism Risk, Business Strategy, Acquisitions, Divestitures, Market Adaptation, Risk Mitigation, Business Fundamentals, Strategic Decisions, Investor Advice
false
Investors want companies to reshape their business portfolios and tackle activism risksBCG Investor Perspective Series: Pulse Check #21
Text Only
BCG
View slide
Contains a stacked column chart displaying the average loans by client segment over five years, with text annotations on 2020 growth factors and 1Q22 loan performance.
Financial Performance
Financial Services
Reviews JPMC's loan portfolio diversification, noting a balanced growth in commercial and real estate lending, alongside competitive market challenges and strong performance indicators.
loan portfolio, diversification, JPMC, commercial lending, real estate, market competition, performance indicators
false
Diversified loan portfolioCommercial Banking 2022
Mixed Chart
JP Morgan
View slide
Slide with line and area charts depicting trends in combined ratios and return on capital.
Financial Performance
Financial Services
Reviews Lloyd's financial performance in 2018, discussing the challenges such as soft market conditions and major loss events that influenced their financial metrics.
Financial, Performance, Challenges, 2018, Lloyd's
false
2018 performance Lloyd’s has had another challenging performance yearLloyd’s and Bermuda
Multiple Chart
PwC/Strategy&
View slide
Slide includes a line graph and bar charts showing the growth of free member enrollments alongside demographic data about the Brazilian population.
Performance Metrics and KPIs
Financial Services
Showcases Serasa's expansion in Brazil, highlighting significant increases in membership enrollments and its impact on financial inclusivity in the Brazilian market.
Serasa, Brazil, membership growth, financial inclusivity, demographic data
false
Rapidly scaling membershipsBarclays Global Credit Bureau Forum
Multiple Chart
Barclays
View slide
Features a hexagonal, honeycomb-like graphic with icons and bullet points describing eight significant trends in the high-tech industry.
Strategic Planning
Technology & Software
The slide illustrates key industry trends impacting the high-tech sector, such as AI integration and 5G solutions, indicating a shift in industry paradigms.
high-tech, trends, AI, 5G, industry paradigm, cloud computing, smart devices
false
Eight trends are triggering a new Industry Paradigm for High TechTransforming the Industry that transformed the World: High Tech industry narrative
Diagram
Accenture
View slide
Displays a smiling woman at a desk, with a large '4' and text, set against abstract teal circles on a white background.
Technology and Digital Transformation
Professional Services
The slide emphasizes the importance of work flexibility for women and how it influences their career decisions.
flexibility, career choices, women in workforce, workplace adaptation, work-life balance, professional development
false
Women are rarely the primary earners in a shared household, and many feel the need to prioritize their partner’s career over their ownWomen @ Work 2023: 3 Factors outside of the workplace also take a toll
Single Chart
Deloitte
View slide
Two large blue panels with text and circular images depicting key areas of growth. Smaller images and bullet points elaborate on core strategies for enhancing digital capabilities.
Strategic Planning
Financial Services
Highlights strategic initiatives for business growth, focusing on digital enhancement and distribution optimization. These are aimed at maintaining a strong market position and driving future success.
Digital Capabilities, Partnerships, Growth
false
Building upon a position of strengthGoldman Sachs U.S. Financial Services Conference 2021
Table
Goldman Sachs
View slide
Continues the list of industries with circular icons, exploring further impacts of connectivity trends.
Technology and Digital Transformation
Telecommunications
Extends the discussion of disruptive potential across various industries due to connectivity technologies.
Connectivity, Industry Impact, Telecommunications, Aviation, Construction, IT
false
What disruptions could the trend enable?McKinsey Technology Trends Outlook 2022 Advanced Connectivity
Header Vertical
McKinsey
View slide
The slide includes an area chart showing the top 10 CCUS patents filed by OECD country producers from 1996-2018, with each country represented by a distinct color. Annotations provide context and highlight significant trends.
Financial Performance
Energy & Utilities
This slide details the number of patents filed for CCUS technologies by various OECD countries, showing the United States leading in patent filings. It highlights the competitive landscape in CCUS R&D and the leading contributors over time.
CCUS patents, United States, OECD, R&D, innovation
false
Top 10 CCUS patents OECD country producerCarbon Capture Utilization and Storage
Single Chart
Kearney
View slide
A bar chart compares the needs of smaller vs. larger companies in areas like AI, HR, and sales to meet business priorities.
Operational Efficiency
Professional Services
Highlights different strategic needs for productivity improvements across various business sectors, focusing on technology and HR.
productivity, technology, HR, sales, strategies
false
Respondents from smaller organizations say productivity improvements are most needed in procurement, product development and sales/marketing to achieve business priorities.Private company outlook: Productivity
Single Chart
Deloitte
View slide
The slide presents a comparative table of various players in the market research industry, showing turnover and focus areas.
Competitive Landscape
Professional Services
The slide compares Ipsos with other market research companies, highlighting turnover figures and areas of specialization.
Comparative, Market Research, Turnover, Specialization, Ipsos
false
WE ARE THE ONLY GLOBAL AND INDEPENDENT MULTISPECIALIST PLAYERINTRODUCTION TO IPSOS
Multiple Chart
IPSOS
View slide
This slide includes multiple column charts showing expenditure allocations by department, such as Education and Health. Each department is represented by columns for estimated and projected budgets, color-coded for clarity.
Operational Efficiency
Government & Public Sector
This slide provides a clear visual representation of how budget allocations are distributed across different government departments in Namibia, useful for discussions on government spending priorities and efficiency.
budget allocation, departmental spending, fiscal management
false
2021/22 Annual Budget Speech: Departmental ExpenditureDissecting the 2021/22 Annual Budget Speech
Single Chart
PwC/Strategy&
View slide
Slide includes a column chart with green color highlights. It's structured into sections with clear headers and bullet points for easy reading.
Operational Efficiency
Education & Training
Details the role of community hubs in vocational pathways and employment, highlighting their support in gaining skills and providing training opportunities. It assesses the economic and social benefits provided by these hubs, emphasizing their importance in community development.
vocational training, community development, employment support, skills acquisition
false
Executive Summary | Vocational pathwaysCommunity Hubs Australia
Mixed Chart
Deloitte
View slide
This slide presents Australia's capabilities across various sectors of the battery value chain using column charts and color gradients.
Market Analysis and Trends
Energy & Utilities
Discusses how Australia can utilize cost and differentiation strategies to be competitive in the global battery market.
cost advantage, differentiation, Australia, battery industry
false
Australia has the greatest ability to compete on cost upstream, and has key sources of differentiation to compete across the value chainCharging Ahead Australia’s battery powered future
Mixed Chart
Accenture
1
...
Next
Load More
Hold On!
We are searching in our database
If nothing, comes up, please try different filters!
Create a FREE account to continue browsing
Receive Instant Access to 8,000+ of the internet's best slides
First Name
Last Name
Email
Password
I agree to all
Terms & Privacy Policy
Thank you! Your submission has been received!
Oops! Something went wrong while submitting the form.
Have an account?
Sign in
Column Chart
Heatmap
Chevron
Org Chart
Infographic
Callouts
Timeline
List
Graphic
Picture
Process Flow
Diagram
Paragraph
Map
Table
Framework
Subtitle
Takeaway Box
Icon
Other Chart
Radar Chart
Waterfall Chart
Mekko Chart
Pie Chart
Scatter Plot
Line Chart
Bar chart
Bullet points