My Account
My Slides
Leave Feedback
Login
Logout
Get Started
Browse all Slides
Browse Slides Pro
Create a FREE Account
Instant access to 1,000+ real slides from top companies like McKinsey, BCG, Goldman Sachs, Google and many more!
First Name
Last Name
Email
Password
I agree to all
Terms & Privacy Policy
Thank you! Your submission has been received!
Oops! Something went wrong while submitting the form.
Have an account?
Sign in
Instant access to the internet's best slides
Get access to 40+ advanced filters and more
Advanced Search and Filters
Access to
8,000+ slides
Access to Category Pages
Save/Bookmark Slides
PowerPoint Template Library (Coming Soon)
Choose your plan
MONTHLY
$12/month
Billed every month, cancel anytime.
YEARLY
$9/month
Billed $108 annually, cancel anytime.
Checkout for $12/month
Checkout for $108/yr
Secured by Stripe | AES-256 bit encryption
Welcome,
Welcome
Upgrade to SlideStart
Pro
Instant access to 8,000+ slides
Show Featured Only
Checkbox 8
Companies
Mckinsey
Bain
BCG
EY
Deloitte
Accenture
PwC/Strategy&
JP Morgan
Goldman Sachs
Morgan Stanley
Citigroup
Deutsche Bank
Barclays
LEK
Kearney
Oliver Wyman
Booz Allen Hamilton
Gartner
IPSOS
Nielsen
Slide type
Header Horizontal
Framework
Vertical Flow
Single Chart
Single Chart
Text Only
Mixed Chart
Header Vertical
Graphic
Pillar
Multiple Chart
Agenda
Title
Table
Linear Flow
Upgrade to SlideStart
Pro
Instant access to 40+ advanced filters
Industry
Upgrade to SlideStart
Pro
Instant access to 40+ advanced filters
Technology
Healthcare
Financial Services
Consumer Goods
Energy & Utilities
Manufacturing
Retail
E-commerce
Logistics
Telecommunications
Real Estate
Professional Services
Education
Media
Entertainment
Hospitatlity
Tourism
Agriculture
Food Production
Government & Public Sector
Environmental
Sustainability
Use Case
Upgrade to SlideStart
Pro
Instant access to 40+ advanced filters
Sales and Business Development
Mergers and Acquisitions
Corporate Finance and Valuation
Performance Metrics and KPIs
Client Case Studies
Competitive Landscape
Product and Service Analysis
Customer and Market Segmentation
Organizational Structure
Human Resources and Talent Management
Industry Overview
Regulatory and Compliance
Risk Assessment and Management
Agriculture & Food Production
Hospitality and Tourism
Government
Environmental
Sustainability
Clear all
Thank you! Your submission has been received!
Oops! Something went wrong while submitting the form.
Show Featured Only
Checkbox 8
Companies
Mckinsey
Bain
BCG
EY
Deloitte
Accenture
PwC/Strategy&
JP Morgan
Goldman Sachs
Morgan Stanley
Citigroup
Deutsche Bank
Barclays
LEK
Kearney
Oliver Wyman
Booz Allen Hamilton
Gartner
IPSOS
Nielsen
Slide type
Text Only
Linear Flow
Vertical Flow
Single Chart
Header Horizontal
Mixed Chart
Header Vertical
Pillar
Multiple Chart
Graphic
Agenda
Title
Table
Framework
Industry
Technology
Healthcare
Financial Services
Consumer Goods
Energy & Utilities
Manufacturing
Retail
E-commerce
Logistics
Telecommunications
Real Estate
Professional Services
Education
Media
Entertainment
Hospitatlity
Tourism
Agriculture
Food Production
Government & Public Sector
Environmental
Sustainability
Use Case
Sales and Business Development
Mergers and Acquisitions
Corporate Finance and Valuation
Performance Metrics and KPIs
Client Case Studies
Competitive Landscape
Product and Service Analysis
Customer and Market Segmentation
Organizational Structure
Human Resources and Talent Management
Industry Overview
Regulatory and Compliance
Risk Assessment and Management
Agriculture & Food Production
Hospitality and Tourism
Government
Environmental
Sustainability
Clear all
Thank you! Your submission has been received!
Oops! Something went wrong while submitting the form.
Tag
View slide
The slide features three vertical column charts comparing survey responses from 2013 and 2022 in India, Sweden, and the US.
Market Analysis and Trends
Technology & Software
The slide analyzes changes in public opinion on data privacy concerns and online privacy attitudes across different countries.
Data privacy, online privacy, public opinion, survey, trends
false
And the direction of change varies tooA NEW WORLD DISORDER?
Multiple Chart
IPSOS
View slide
Consists of pie charts and small text sections describing credit allocation and exposure in consumer and corporate segments.
Risk Assessment and Management
Financial Services
Provides an overview of credit distribution and risk across consumer and corporate sectors, highlighting key credit metrics like EOP loans and reserves ratio. Essential for understanding risk management and financial stability.
Credit, Consumer, Corporate, Risk Management, Overview
false
Consumer and Corporate Credit OverviewThird Quarter 2023 Earnings Results Presentation
Multiple Chart
Citigroup
View slide
The slide combines graphical representations of JPMC's market share in various banking sectors with icons of Fortune's top 5 companies, creating a strong visual impact with its segmented circular graphic and bold text captions.
Industry Overview
Financial Services
Showcasing JPMC's industry dominance and comparing it to the most admired companies globally, the slide is utilized for market positioning and corporate presentations.
market position, JPMC, banking sectors, Fortune 500, admired companies, industry dominance, corporate presentation.
false
Unparalleled strength of JPMorgan ChaseInverstors Day 2023
Framework
JP Morgan
View slide
Column chart of profit distribution, infographic elements
Financial Performance
Financial Services
Santander's growth in customer focus and diversification
Growth, Diversification, Customer Focus, Banking, Profit
false
We have delivered strong growth based on Scale, Customer Focus and DiversificationEuropean Financials Conference Morgan Stanley
Mixed Chart
Morgan Stanley
View slide
The slide uses a dark background with a yellow text box for the quote. Below, there is a question and four circular charts with percentages reflecting future expectations.
Market Analysis and Trends
Healthcare & Pharmaceuticals
The slide provides insights into Canadian consumers' beliefs about the future of technology in healthcare, including AI, virtual presence, and digital monitoring.
Future of healthcare, technology, AI, virtual presence, Canada
false
‘I see a big future for technology in health care over the next decade.’ Consumers: CanadaHealth care consumer views on value
Mixed Chart
EY
View slide
A title slide with a large, bold title, a person working from home indicating connectivity, and a clean design with ample negative space for a focused message.
Industry Overview
Telecommunications
The introductory slide to a report highlighting the nbn™ network's impact on everyday connectivity and its broader value to Australian users.
nbn, Connectivity, Telecommunications, Value, Introduction
false
The nbn effect: How the nbn network adds value to our livesAccenture Consumer Value Report 2021
Title
Accenture
View slide
The slide contrasts the success rates and expected financial outcomes of different reinvention approaches, with deep purple tones for higher success and lighter for less. It includes bar charts and descriptive text, providing a clear visual differentiation between groups.
Strategic Planning
Professional Services
Analyzes the relationship between the adoption of Total Enterprise Reinvention and the accelerated financial success, using comparative data to showcase the potential outcomes for reinventors versus transformers and optimizers.
Total Enterprise Reinvention, Financial Success, Comparative Analysis, Business Case, Incremental Revenue, Balance Sheet, Cost Reduction, Outcome Expectations
false
Embracing Total Enterprise Reinvention releases value at a compressed rateTotal Enterprise Reinvention
Multiple Chart
Accenture
View slide
Featuring a straightforward layout with a bar chart, this slide examines the financial impact of delayed technology adoption on business agility and growth. It shows the percentage of revenue change against the backdrop of technology investment in different years, providing a stark comparison of business performance with and without adequate tech support.
Technology and Digital Transformation
Technology & Software
This slide illustrates the detrimental financial effects of postponing technological advancements within organizations. It compares revenue growth and tech debt levels, providing a clear argument for why timely technological updates are essential for maintaining competitiveness and fostering growth in today's digital economy.
technology transformation, delayed investment, financial impact, tech debt, competitiveness, column chart
false
The cost of delayed technology transformationFrom survive to thrive Achieving tech transformation for communication service providers’ future
Mixed Chart
Accenture
View slide
Features a pie chart with associated column charts detailing changes in broadband subscriptions. Color-coded for clarity and visually simple to enhance understanding.
Operational Efficiency
Telecommunications
Details the modifications in broadband packages by UK households over the past year, showing preferences for better packages and cost reductions. Useful for telecom businesses to understand consumer behavior changes.
broadband, consumer behavior, subscriptions, changes, UK
false
Almost half of all respondents changed their home broadband package in the last year. The most common reason (17%) was a 'better package'; 14% moved to a lower cost package; 7% cut services.Digital Consumer Trends 2023
Multiple Chart
Deloitte
View slide
Combines text with icons representing various strategic actions for integrating AI into businesses.
Strategic Planning
Technology & Software
Provides strategic guidance on incorporating AI into business models and operational practices to drive growth and innovation.
AI Integration, Business Strategy, Operational Model, Innovation, Growth Driving, Strategic Guidance, Business Transformation
false
To take advantage of AI, leaders must embed it into their business strategy and transformation, and prepare their operational modelsArtificial Intelligence: Ready to Ride the Wave?
Table
BCG
View slide
Visuals include a flowchart of the whistleblowing process and a pie chart with data on types of cases reported. There is emphasis on the roles and numbers related to the whistleblowing cases.
Risk Assessment and Management
Financial Services
Overview of the whistleblowing process at Barclays, highlighting the pathway for raising concerns and the breakdown of cases in 2023. This aids in assessing internal risk management and corporate governance practices.
whistleblowing, risk management, governance
false
We continue to foster a culture where our colleagues feel safe to speak upFY23 ESG Investor Presentation
Multiple Chart
Barclays
View slide
Slide includes bar charts comparing potential production costs for refining and producing active materials in different cities, focusing on cost advantages in Australia.
Financial Performance
Financial Services
Compares production costs for refining and active materials in various global locations, highlighting Perth and Brisbane as potential low-cost producers if mining and refining are integrated.
refining costs, production costs, global comparison, Australia
false
Australian cities (Perth and Brisbane) could be the lowest-cost producers of LHM and LFP if Australian mining and refining are integratedCharging Ahead Australia’s battery powered future
Multiple Chart
Accenture
View slide
The slide features a professional setting with individuals in a discussion. The text highlights the need for collaboration and the development of future risk leaders within businesses. It emphasizes the importance of aligning risk management strategies with business goals to foster organizational growth and resilience.
Strategic Planning
Professional Services
This slide discusses the strategic approach to nurturing future leaders in risk management, focusing on integrating risk considerations into broader business strategies and decision-making processes. It advocates for a proactive and integrated approach to risk management as essential for sustainable business growth and competitive advantage in a volatile business environment.
future leaders, risk management, strategic planning, collaboration, business growth, professional, discussion
false
STEP 2 Create risk leaders of the futureHyper-disruption demands constant reinvention
Mixed Chart
Accenture
View slide
This slide lists four key points with corresponding icons, emphasizing shifts in global battery policy.
Market Analysis and Trends
Government & Public Sector
Summarizes global shifts in battery industries and their implications for Australian policy, highlighting strategic responses.
policy shifts, battery industry, Australia, global trends
false
Recent geopolitical shifts in global battery industries have four key implications for Australian battery policyCharging Ahead Australia’s battery powered future
Pillar
Accenture
View slide
World map highlighting monetary policy changes with color-coded countries and key rate changes indicated by symbols. Simple, with a clear visual message.
Market Analysis and Trends
Financial Services
Analyzes global monetary policy transitions, indicating recent interest rate hikes or cuts and the implications for international markets and investment strategies.
Monetary Policy, Interest Rates, Global Economy, Rate Hikes, Central Banks, Market Strategy
false
World is transitioning to tighter monetary policy, led by emerging marketsCiti Global Wealth Investments OUTLOOK 2022
Graphic
Citigroup
View slide
The slide features a world map highlighting Ipsos' global offices and operations.
Market Analysis and Trends
Professional Services
The slide showcases Ipsos' global reach with offices in 90 countries and operations in over 130 countries.
global coverage, local understanding, Ipsos, offices, operations, countries
false
GLOBAL COVERAGE, LOCAL UNDERSTANDINGOur Path to Ipsos 2025: A Strategic Update
Graphic
IPSOS
View slide
A line chart tracks the growth of U.S. data center construction starts from January 2014 to April 2019. The chart features a rising blue line on a green gradient background.
Industry Overview
Technology & Software
This slide shows the increasing investment in U.S. data center construction over several years, highlighting growth trends in the technology sector.
data center, construction, technology, investment, growth
false
U.S. data center construction starts are strongDeutsche Bank Global Industrials & Materials
Single Chart
Deutsche Bank
View slide
This slide presents a column chart plotting the revenue growth of video games in Hong Kong from 2016 to 2025 alongside a pie chart displaying the global revenue shares from the US, Mainland China, and Japan in 2020. The bar chart uses alternating colors to depict yearly changes, and the pie chart uses different shades to represent each region's contribution to the market.
Market Analysis and Trends
Media & Entertainment
Examines the growth trajectory of the video games market in Hong Kong, forecasting strong revenue increases by 2025. The slide compares Hong Kong's market to global revenue distributions, highlighting significant contributions from major regions such as the US, Mainland China, and Japan. It provides insights into market dynamics and potential investment or marketing strategies within the gaming industry.
video games, market growth, Hong Kong, global, revenue, bar chart, pie chart
false
Hong Kong Video games on strong growth trajectory, eight fastest growing segment. Revenues to hit US$1.2bn by 2025 at 4.1% CAGRGlobal & Entertainment Media Outlook 2021-2025: Hong Kong summary
Multiple Chart
PwC/Strategy&
View slide
Multiple line charts comparing GDP growth scenarios and their impacts on the transportation and logistics sector.
Market Analysis and Trends
Transportation & Logistics
Discusses potential future impacts of various economic scenarios on the T&L industry.
Transportation, Logistics, GDP, Growth, Impact, Economic, Scenarios, Industry Analysis
false
GDP growth Impact on the T & L industryTransport & Logistics Barometer
Multiple Chart
PwC/Strategy&
View slide
This slide features a line chart showing trends in climate concern over time across different countries. The lines are color-coded to distinguish between countries, with clear markers indicating significant changes.
Market Analysis and Trends
Environmental Services & Sustainability
The slide tracks the increasing concern about climate change from 2013 to 2021 in various countries, highlighting significant growth in awareness and urgency over the years. This can be used to analyze public sentiment trends, inform climate policy, and prioritize environmental actions.
climate concern, trend analysis, public sentiment, environmental awareness, global trends
false
CLIMATE CONCERN REMAINS KEYGLOBAL TRENDS 2021 Aftershocks and continuity
Single Chart
IPSOS
View slide
Contains a central diagram with five strategic actions around it, each action is represented with an icon and a brief description.
Operational Efficiency
Technology & Software
Details the five fundamental actions high-tech companies should take to effectively adopt as-a-service models, from ecosystem expansion to redesigning the operating model.
high-tech, as-a-service, strategy, ecosystem, operating model, business
true
To effectively adopt as-a-service, High Tech companies should take five fundamental actionsTransforming the Industry that transformed the World: 01 Shift to as-a-serice
Diagram
Accenture
View slide
This slide presents graphical representations of RWA density and the impact of IRB on Barclays' strategy. It uses color contrasts to highlight different years and projected outcomes, with a clear, organized layout that facilitates comprehension of complex regulatory impacts.
Regulatory and Compliance
Financial Services
Outlines Barclays' strategic responses to regulatory requirements, focusing on how the bank plans to manage and mitigate the impact of increased risk-weighted assets due to IRB regulations.
regulatory impact, IRB, risk management, strategic response
false
More balanced: plan to absorb and reduce IRB impactsFY 2023 Results Announcement
Mixed Chart
Barclays
View slide
Features a text block on the left and a horizontal bar chart on the right comparing the deployment of blockchain in advertising strategies between those prioritizing regulatory environments and others.
Regulatory and Compliance
Financial Services
The slide discusses the adoption of blockchain technology in advertising to address regulatory environments, with a horizontal bar chart illustrating the difference in deployment rates between companies prioritizing regulation and others.
Blockchain, advertising, regulatory, deployment, comparison
false
FIGURE 2: Brands that are addressing increased regulation are adopting blockchain at significantly higher rates than their peers2023 Global Marketing Trends
Mixed Chart
Deloitte
View slide
Four line graphs show U.S. mortgage delinquency rates, subprime mortgage originations, and financial obligation ratios, indicating trends in consumer credit health.
Operational Efficiency
Financial Services
Reviews the financial health of consumers by analyzing mortgage delinquency rates and debt ratios, relevant for operational efficiency in financial services.
consumer, credit, mortgage, delinquency, subprime, obligations, ratios, health, financial services
false
Consumer Balance Sheets Look in Fine HealthCredit Market Monitor
Multiple Chart
Morgan Stanley
View slide
A bar graph with a horizontal layout shows the percentage of investors' change in risk preference due to increased inflation. It includes a sidebar with notable changes in investing practices. The visual elements are detailed, utilizing contrasting colors to highlight changes over time.
Market Analysis and Trends
Financial Services
Illustrates a shift in investors' risk preferences in response to inflation, highlighting an increase in risk aversion and changes in investment practices. Can be used to discuss investment strategies and market behavior.
Investor Behavior, Risk Aversion, Inflation Impact, Investment Strategies, Market Trends, Risk Management, Cash Holdings, Asset Classes, Portfolio Management, Value Investing
false
Many investors have become more risk averse, holding more cash, pivoting toward value, and investing in traditionally stable or countercyclical sectorsBCG Investor Perspective Series: Pulse Check #21
Multiple Chart
BCG
View slide
The slide features three separate columns titled "Revenue Growth," "Efficiency Measures," and "Capital Efficiency," each containing bullet points and percentage values. The design includes blue and white color themes with horizontal arrangement and clear section separators.
Financial Performance
Financial Services
This slide presents Deutsche Bank's Q3 2023 progress in revenue growth, efficiency measures, and capital efficiency targets, highlighting specific achievements and future goals.
revenue growth, efficiency, capital, target, banking
false
Continued accelerated execution with material progress on capital efficiencyQ3 2023 results
Table
Deutsche Bank
View slide
This slide features a central column chart surrounded by explanatory text and smaller charts, highlighting the caseload distribution in two courts with a focus on family law. The layout is organized and color-coded for clarity.
Operational Efficiency
Government & Public Sector
It showcases the total number of court cases handled by two courts, emphasizing the distribution and percentage of family law cases, useful for workload analysis and operational insights.
caseload, courts, distribution, family law, analysis
false
The overall caseload of the courtsReview of efficiency of the operation of the federal courts
Single Chart
PwC/Strategy&
View slide
Bar charts depicting the percentage difference between R&D and marketing budgets across different company sizes and industries.
Market Analysis and Trends
Professional Services
Analyzes how companies allocate funds between R&D and marketing, highlighting industry-specific strategies. This slide is key for strategic financial decisions and understanding industry trends in investment priorities.
R&D, marketing, budgets, comparison, industry, strategy, allocation, trends
false
Company and industry differences in focus on R&D versus MarketingThe CMO Survey Marketing in a Post Covid Era
Multiple Chart
Deloitte
View slide
Displays a donut chart and a gauge chart focused on tracking managerial progress. The charts are effectively color-coded to highlight various degrees of agreement on effectiveness of the tracking methods.
Human Resources and Talent Management
Professional Services
Provides insights into the tracking of managerial progress, useful for HR meetings focused on improving monitoring practices and performance reviews.
managerial progress, tracking, HR
false
Managers’ progress is continuously trackedHR Pulse Survey Presentation of results
Multiple Chart
PwC/Strategy&
View slide
The slide includes a Gartner Emerging Technologies Hype Cycle graph, showing various technologies at different stages of maturity and adoption. Key points about the technologies’ current state and future potential are noted on the right side.
Strategic Planning
Technology & Software
The slide uses the Gartner Hype Cycle to illustrate the current and projected adoption stages of various emerging technologies, stressing the timely importance of blockchain development amidst fluctuating market perceptions.
Gartner Hype Cycle, technology adoption, blockchain, market trends, strategic timing
false
This is our time. This year. Next year. This is when the really important work of blockchain will be done, while much of the world isn’t paying attentionGoing Public EY Global Blockchain Summit 2020
Mixed Chart
EY
View slide
Slide with two column charts showing CET1 capital and leverage ratios for 4Q23, along with key metrics for capital and liquidity management.
Financial Performance
Financial Services
The slide emphasizes the strength of UBS's balance sheet, detailing CET1 capital and leverage ratios, and key liquidity metrics.
balance sheet, CET1 capital, leverage ratio, capital management, UBS financial stability
false
Balance sheet for all seasons remains the foundation of our successFourth quarter 2023 Fixed Income investor presentation
Multiple Chart
UBS
View slide
Left side has percentage boxes, right side has a bar chart and text
Operational Efficiency
Transportation & Logistics
Use of generative AI in supply chain management, focusing on knowledge enhancement and predictive models
supply chain, AI, knowledge enhancement, predictive models
false
Supply Chain* leaders are looking to AI to address the corporate brain drain and increasing unpredictabilityGenerative AI Surveys
Mixed Chart
Gartner
View slide
This slide includes a series of vertical column chart depicting 'Bank Group Level 2 Ratios', focusing on different financial metrics such as CET1 ratio, Leverage ratio, LCR, and NSFR.
Regulatory and Compliance
Financial Services
Provides a visual representation of Macquarie's regulatory ratios, crucial for assessing the company's compliance with financial regulations and risk management.
Regulatory Ratios, Financial Metrics, Compliance, Risk Management
false
Strong regulatory ratiosMorgan Stanley Virtual Hong Kong Summit
Multiple Chart
Morgan Stanley
View slide
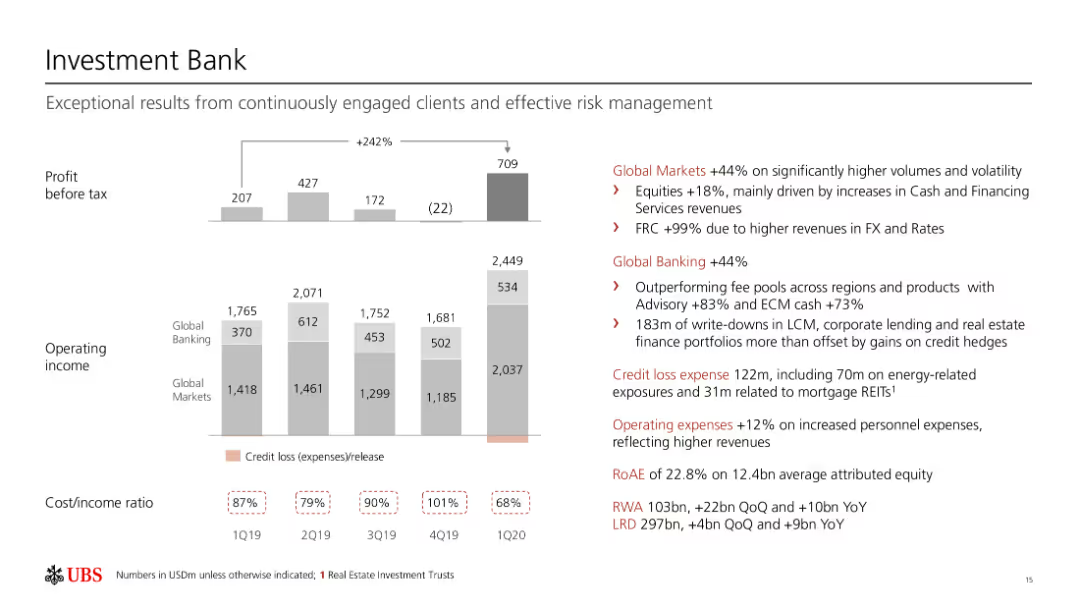
The slide includes multiple column charts and text elements. It is moderately dense, with sections divided by topic, showing financial performance metrics like profit before tax and operating income.
Financial Performance
Financial Services
The slide showcases the financial performance of the Investment Bank, highlighting profit before tax, operating income, and various metrics. It is used to analyze financial performance and results.
Financial, Performance, Banking, Metrics, Profit, Income
false
Investment Bank Exceptional results from continuously engaged clients and effective risk managementFirst quarter 2020 results
Multiple Chart
UBS
View slide
Slide presents a densely packed combination of text and column charts, displaying FTE per state and territory with red and black to differentiate judicial and non-judicial staff. It also includes text explaining the distribution of staff in major states.
Regulatory and Compliance
Government & Public Sector
Analyzes staffing distribution of courts across various states and territories, useful for comparing resource allocation and identifying potential areas needing attention.
courts, staffing, FTE, resource allocation, states
false
Courts resourcing in states and territoriesReview of efficiency of the operation of the federal courts
Multiple Chart
PwC/Strategy&
View slide
A structured slide with four columns listing key business areas and metrics on the left and future investment leverage and propositions on the right.
Operational Efficiency
Financial Services
Discusses strategies to extend leadership in banking and commerce, with insights on market share and investment focus.
business growth, leadership strategy, market share, investments, financial services, commerce expansion
false
We are investing to extend our leadership positions and grow new businessesConsumer & Community Banking
Table
JP Morgan
View slide
Three-column layout with icons representing energy sources and trading. Includes a line graph showing power supply and demand, and a Bitcoin price trend.
Technology and Digital Transformation
Technology & Software
Discusses the role of Bitcoin mining in energy management, acting as a balancing economic battery by leveraging excess energy.
Bitcoin, Blockchain, Energy, Trading, Economic
false
Proof Of Work Bitcoin Mining can operate as a Load-Balancing Economic BatteryBlockchain and Digital Assets
Mixed Chart
McKinsey
View slide
This slide includes a large pie chart illustrating sales distribution among various business segments, enhanced by imagery representing each segment. It details the percentage of sales, main drivers, and notes the impact of the FCG acquisition. The slide includes various icons and a dotted line highlighting cyclicality levels for different segments, accompanied by the Michelin logo.
Product and Service Analysis
Industrial & Manufacturing
It conveys information on sales distribution across different business segments post-FCG acquisition, emphasizing the strengthening of premium positioning across tire businesses. It is potentially used to present growth strategies, market positioning, and the impact of acquisitions to stakeholders or in business development meetings.
polymer, composite, growth, sales, FCG, Michelin, acquisition, market, segmentation, strategy
false
Accelerating growth on polymer composite solutions with FCG acquisition closed in Q3 23 Strengthening premium positioning across tire businessesRoad Show US West Coast Morgan Stanley
Single Chart
Morgan Stanley
View slide
Features two pie charts illustrating sector weights for the S&P 500 and MSCI World indices, along with a tabulated list of index characteristics. The charts and table are colored coherently to enhance readability and emphasize data distribution.
Investment Analysis
Financial Services
Provides a snapshot of the S&P 500 and MSCI World index characteristics and their sector allocation weights, informing asset allocation decisions.
Index characteristics, sector weights, S&P 500, MSCI World, asset allocation, investment portfolio, market analysis
false
Current Characteristics and Sector WeightsMonthly Market Monitor November 2023
Multiple Chart
Morgan Stanley
View slide
Features a bar chart depicting top AI priorities in privacy, explainability, and specific functions.
Strategic Planning
Technology & Software
Outlines the main priorities for AI and ML implementations for the year 2021, focusing on responsible AI tools.
AI priorities, 2021, tools, privacy, explainability
false
AI/ML Priorities for 2021AI/ML use in Risk Management and Compliance PwC Actuarial, Risk & Quants
Single Chart
PwC/Strategy&
View slide
The slide contains two column charts displaying operating expenses and risk-weighted assets over different periods. It uses a minimalistic design with blue and white colors and clear annotations.
Operational Efficiency
Financial Services
The slide explains the efficient utilization of resources with a focus on cost management and RWA efficiency. It shows changes in operating expenses and risk-weighted assets, emphasizing disciplined expense management.
Resource Utilization, Cost Efficiency, RWA, Operating Expenses, Capital Management
false
Efficient utilization of resources – Continued focus on cost and RWA efficiencyCredit Suisse Investor Day 2018 Leveraging capabilities for Wealth Management
Multiple Chart
Credit Suisse
View slide
Slide includes a bar graph for top remittance receiving countries and a column chart for international migrant stock by region. Text descriptions and icons for population, migration, and education sectors are present.
Market Analysis and Trends
Government & Public Sector
This slide presents statistical data on international labor migration and remittances, highlighting economic impacts and demographic shifts. It aims to inform on the scale and financial implications of labor mobility globally.
migration, remittances, labor, economics, international, finance, data, demographics, global economy
false
International labor migrants constitute the bulk of other international migrants – Remittances highlight important aspects of a two-way flowRoland Berger Trend Compendium 2030: Megatrend 1 People & Society
Multiple Chart
Roland Berger
View slide
The slide contains a graph showing normal to disrupted patterns and a juxtaposed image of falling blocks.
Financial Performance
Professional Services
Discusses the challenges companies face during disruptive changes and emphasizes the negative impacts on work quality and productivity.
change, disruption, challenges, impact, quality
false
But it’s getting harder: Constant change brings waves of disruptionEngaging Your Organization to Deliver Results
Single Chart
Bain
View slide
Presents detailed financial results and revenue trends through multiple graphs and comparative metrics.
Financial Performance
Financial Services
Highlights Q1 2023 financial and operational performance of a private bank, with focus on revenue and asset management, essential for financial strategy discussions.
private bank, financial performance, Q1 2023, revenue, asset management
false
Private Bank In € m, unless stated otherwiseQ1 2023 results
Multiple Chart
Deutsche Bank
View slide
A multi-bar column chart shows the percentage of mortgages in forbearance by type, with a time series comparison from 2020 to 2023.
Risk Assessment and Management
Financial Services
Assesses mortgage-backed securities (MBS) risk by highlighting the sharp reduction in forbearance rates since the pandemic, valuable for financial risk managers.
MBS, forbearance, mortgages, pandemic, risk, reduction, securities, financial, management
false
MBS: Forbearance Down Sharply From Pandemic LevelsCredit Market Monitor
Single Chart
Morgan Stanley
View slide
The slide includes a split purple and violet background with two illustrative images and text. On the left are icons representing 'Essential tasks' and 'Enriching activities'.
Technology and Digital Transformation
Technology & Software
It showcases key messages about the nbn network's role in providing essential services and enriching lives, emphasizing its value and necessity.
nbn network, essential services, enriching activities, connectivity, online tasks, value proposition, brand messaging
false
AgendaAccenture Consumer Value Report 2021
Agenda
Accenture
View slide
Horizontal timeline showing four key phases of Morgan Stanley's evolution from 2009 with corresponding milestones and strategies.
Strategic Planning
Financial Services
Chronicles Morgan Stanley's evolution through four strategic phases, from building scale to deepening client relationships.
Evolution, Morgan Stanley, strategic phases, building scale, technology, channel expansion, client relationships
false
Four Key Phases To Our EvolutionDeepening Client Relationships
Linear Flow
Goldman Sachs
View slide
Utilizes a stacked bar chart to compare digital marketing maturity across multiple industries. The design is clear, using shades of green to differentiate maturity levels.
Market Analysis and Trends
Media & Entertainment
Evaluates digital marketing maturity across various industries in Asia Pacific, showcasing a significant range of maturity levels. This slide helps in identifying industry-specific trends and planning targeted marketing strategies.
digital marketing, Asia Pacific, industry comparison, maturity levels, marketing trends, targeted strategies, stacked bar chart, industry-specific analysis
false
There is a significant range of maturity within industries in Asia PacificUnderstanding the path to digital marketing maturity
Single Chart
BCG
View slide
The layout includes a bar graph labeled "FIGURE 5", textual analysis on the left, and quotes pertaining to the role of AI in skill development.
Market Analysis and Trends
Technology & Software
Focusing on China, the slide projects the future of work roles from 2017 to 2028, addressing the dominant employment sectors and the impact of automation on labor distribution.
China, Labor, Automation, Skills, Future
false
FIGURE 5: REDISTRIBUTION OF WORK ROLES IN CHINA, 2017-2028Bridging the Skills Gap in the Future Workforce
Mixed Chart
Accenture
View slide
Two pie charts showing geographic distribution of net sales and breakdown by distribution channel for Essity. Each segment is color-coded and labeled with percentages.
Market Analysis and Trends
Consumer Goods
Analyzes geographic sales distribution and distribution channels for Essity, offering insights into market penetration and sales strategy.
Geographic Sales, Distribution Channels, Market Penetration, Sales Strategy
false
2016 Net Sales By Geography and Distribution ChannelBarclays Consumer Staples Conference
Multiple Chart
Barclays
View slide
Displays a central emblem for Michelin's One Care Program, surrounded by text detailing the program's coverage and objectives.
Human Resources and Talent Management
Industrial & Manufacturing
Michelin's social protection initiatives under the One Care Program are highlighted, with an emphasis on employee coverage for health, family protection, and leave policies.
Social Protection, Michelin, One Care Program, Employee Benefits, Health Program, Maternity Leave, Talent Management, CSR, Family Protection, Coverage Goals
false
Universal social protection: since March 2022, deployment of the Michelin One Care ProgramRoad Show US West Coast Morgan Stanley
Framework
Morgan Stanley
View slide
Features column and line charts comparing emission reduction targets with vibrant colors and a clear title. The layout is complemented by bullet-pointed text and annotations.
Strategic Planning
Environmental Services & Sustainability
Communicates LANXESS's commitment to achieving climate neutrality, detailing their reduction targets and comparing their progress to EU regulations.
ESG, Climate Neutrality, Targets, LANXESS
false
ESG theme as a chance LANXESS goes climate neutral by 2040LANXESS – Morgan Stanley Cannon Ball Run Field trip
Multiple Chart
Morgan Stanley
View slide
Features column charts displaying hypothetical shifts in net interest income due to changes in the yield curve.
Risk Assessment and Management
Financial Services
This analytical slide explores the sensitivity of net interest income to changes in interest rates, presenting data projections up to 2026. It's designed for financial risk managers and analysts to assess the potential impact of interest rate fluctuations on the bank's earnings, aiding in strategic financial planning and risk mitigation efforts.
Interest Rates, Financial Risk, Projections, Banking, Sensitivity Analysis
false
Net interest income sensitivity Hypothetical +/-25bps shift in yield curve, in € mQ3 2023 results
Multiple Chart
Deutsche Bank
View slide
Contains a flowchart summarizing the steps taken to identify and implement eco-design options for ground stations, from brainstorming to evaluation of solutions.
Product and Service Analysis
Environmental Services & Sustainability
Describes the methodology used in reducing environmental impacts of ground stations through eco-design, involving multiple stakeholders and solution assessments.
eco-design, environmental impact, ground stations, mitigation, flowchart, brainstorming, solution assessment, sustainability
false
Solutions for reducing environmental impacts of ground stationsGround Station Life Cycle Assessment
Linear Flow
Deloitte
View slide
A single line chart showing the Global Supply Chain Pressure Index from 2015 to 2023, highlighting significant events and pressures.
Market Analysis and Trends
Transportation & Logistics
The slide discusses the return of global supply chain pressures to pre-pandemic levels and the impact of various global events on these pressures.
supply chain, global pressures, pre-pandemic, transportation, logistics, market trends
false
Global supply chain pressures have now reverted to pre pandemic levelsMarch Macro Brief Financial fissures emerge
Mixed Chart
Accenture
View slide
Bar graph comparing gross and operating margins for durables and nondurables with a clear visual contrast.
Financial Performance
Financial Services
Compares profitability across verticals in the distribution industry, highlighting differences in margins.
Profitability, Distribution, Margins, Durables, Nondurables, Comparison
false
Distribution industry dynamicsEY-Parthenon Perspectives: Investing in distribution
Multiple Chart
EY
View slide
Four separate text boxes with icons, detailing different market aspects, occupy the slide's center. Each box has its title and list of bullet points, presented in a clean and organized manner.
Market Analysis and Trends
Industrial & Manufacturing
This slide gives an outlook on the demand recovery in various markets, highlighting the increase in raw material prices and the impact on the company's divisions like Advanced Intermediates and Consumer Protection.
demand recovery, raw material prices, Advanced Intermediates, Specialty Additives, Consumer Protection, Engineering Materials, market outlook, LANXESS
false
Current outlook: Recovering demand in most end markets, increasing raw material prices and FX burdenLANXESS – Morgan Stanley Cannon Ball Run Field trip
Header Vertical
Morgan Stanley
View slide
Includes a line graph and pie charts, showing the global internet advertising revenue and the shift towards mobile display.
Market Analysis and Trends
Media & Entertainment
Details the trends in internet advertising with a focus on the rise of mobile display ads, driven by advancements in 5G and IoT.
internet advertising, mobile display, global, 5G, IoT
false
Global – The acceleration of 5G and IoT will drive the shift of Internet advertising towards mobile displayGlobal & Entertainment Media Outlook 2021-2025: Hong Kong summary
Multiple Chart
PwC/Strategy&
View slide
The slide features a column chart comparing domestic supply chain costs and freight costs for cement supply. The columns are divided into categories such as port, depot, rail, and road.
Operational Efficiency
Industrial & Manufacturing
The slide provides a breakdown of cement supply chain costs, showing that freight constitutes 55% of costs. It highlights different transportation methods and their respective cost percentages.
cement, supply chain, costs, transportation, freight, rail, road, port, depot
false
Freight accounts for c.55% of cement supply chain costs, with road, coastal shipping and rail accounting for c.60%, c.20% and c.20% eachInternational Comparison of Australia’s Freight and Supply Chain Performance Final Report - Cement
Single Chart
LEK
View slide
Visuals include bar charts detailing investments in built environment and solar/wind energy with corresponding icons and project examples.
Investment Analysis
Environmental Services & Sustainability
Analyzes infrastructure fund investments, emphasizing built environment and renewable energy sectors.
infrastructure, investment, built environment, renewable energy
false
$1B deployed by infra funds since 2020; investment themes similar to corporateSoutheast Asia’s Green Economy 2022 Report
Mixed Chart
Bain
View slide
The slide presents a horizontal bar chart listing various investment products owned by respondents.
Market Analysis and Trends
Financial Services
The slide details the ownership distribution of various investment products such as mutual funds, stocks, and bonds.
Investment, Products, Ownership, Mutual Funds, Stocks
false
Investment Products OwnedCRYPTO ASSET SURVEY
Single Chart
IPSOS
View slide
Features two vertical column charts comparing the market cap of top non-tech versus tech companies in Brazil between 2010 and 2019, showing significant growth in the tech sector.
Market Analysis and Trends
Technology & Software
Highlights the rapid growth of Brazil's technology sector within the top companies by market cap, contrasting it with the slower growth of non-tech sectors.
technology growth, market cap, Brazil, tech vs non-tech, 2010 vs 2019
false
Tech companies greatly outperformed companies from other sectors…Brazil Digital Report
Multiple Chart
McKinsey
View slide
The slide features a large image at the top left with text on the right, including a trend assessment with bar charts.
Technology and Digital Transformation
Retail & E-commerce
Discusses voice commerce, highlighting the use of smart speakers and voice commands to enhance online shopping experiences.
Voice Commerce, Smart Speakers, Voice Commands, Retail, Shopping, AI, Personalization, Customer Interaction
false
Planet Centricity Reflecting a new sense of social awareness of the impact of human activities,TrendRadar: The Future Consumer
Mixed Chart
Deloitte
View slide
Displays a column chart on efficiency ratio and comprehensive tables listing various expense categories with associated financial data.
Operational Efficiency
Financial Services
The slide offers a detailed breakdown of expenses, highlighting changes over time and efficiency ratios. It can be used to discuss operational expenses, budget planning, and financial strategy adjustments based on the illustrated data.
Expenses, Operational, Efficiency Ratio, Compensation, Technology, Clearing, Market Development, Tax Rate, Financial Results, Litigation Provision
false
Expenses Financial ResultsFull Year and Fourth Quarter 2019 Earnings Results Presentation
Mixed Chart
Goldman Sachs
View slide
The slide features a column chart displaying the private funding value from 2019 to H1 2022 alongside an orange line graph for the average 10-year US treasury rate. Annotations provide additional context about market trends, including recent changes affecting investments.
Investment Analysis
Financial Services
Highlights investment trends in the first half of 2022, comparing private funding values with the average 10-year US treasury rate, contextualized with annotations on SEA’s deal landscape, showing how rising interest rates affect investments.
investments, trends, H1 2022, private funding, treasury rates, SEA, market
false
Investments maintained strong momentum in H1 2022, but investors are getting increasingly cautiouse-Conomy SEA 2022 Through the waves, towards a sea of opportunity
Mixed Chart
Bain
View slide
Contains a column chart that compares SACU receipts over three fiscal years, with each year represented by a column colored in orange.
Regulatory and Compliance
Government & Public Sector
Analyzes the SACU receipts from previous, current, and projected fiscal years, providing insights into economic trends and regional financial contributions. This information is crucial for assessing economic health and regional cooperation within the Southern African Customs Union.
SACU, Receipts, Budget, Forecasting, Economic analysis
false
2023/24 Annual Budget Speech: SACU ReceiptsDissecting the 2023/24 Annual Budget Speech
Single Chart
PwC/Strategy&
View slide
Column chart showing the role of AI as an enabler or inhibitor under various sustainable development goals (SDGs) to 2030.
Technology and Digital Transformation
Technology & Software
The slide evaluates the impact of AI on achieving global sustainable development goals by 2030, suggesting that AI is more often seen as an enabler rather than an inhibitor. It presents data on AI's potential to contribute positively to various societal categories, such as no poverty, quality education, and clean water and sanitation.
AI, Sustainable Development Goals, Enabler
false
In terms of societal aspects under global sustainable development goals to 2030, AI is seen as more of an enabler than an inhibitorMegatrend 5 - Technology & Innovation
Mixed Chart
Roland Berger
View slide
Features two line charts comparing EU and US export trends to China, using a clear color distinction between the two.
Market Analysis and Trends
Transportation & Logistics
Analyzes the impact of trade tensions on export volumes between the EU, US, and China, highlighting recent trends and changes.
exports, trade tensions, EU, US, China
false
As trade tensions have escalated, EU exports to China have grown while U.S. exports have declinedDeutsche Bank Global Industrials & Materials
Multiple Chart
Deutsche Bank
View slide
This slide features a variety of bar and column charts, and textual data displaying statistics such as gender diversity, cultural origin, and turnover rates among PwC staff. The color scheme is predominantly orange and white.
Regulatory and Compliance
Professional Services
Provides a detailed breakdown of PwC's staff diversity statistics including gender, origin, and turnover, highlighting efforts towards inclusivity and diversity in the workplace. It's valuable for HR professionals and managers focusing on diversity and inclusion strategies.
diversity, human resources, statistics, PwC, inclusion
false
Diversity Cultural diversity (% of staff)*2017-2018 PwC Annual Report
Multiple Chart
PwC/Strategy&
View slide
The slide features a map showing the route of the H2 bus project in Pau, France, along with key characteristics and project partners listed on the side.
Regulatory and Compliance
Energy & Utilities
The slide describes an experimental project in Pau, France, using hydrogen buses for public transportation, highlighting project details, investment, and key characteristics.
H2 buses, public transport, France, experiment, Pau
false
Pau, France zero-emission public transportation project, FEBUSHydrogen applications and business models
Graphic
Kearney
View slide
Circle charts with net positive/negative financial statuses compared across SEA countries.
Market Analysis and Trends
Financial Services
The slide compares the financial status of respondents to a year ago, indicating a general decrease in financial wellbeing.
financial status, SEA, comparison, circle chart, survey
false
COMPARED TO A YEAR AGO, ABOUT 1 IN 3 ARE FINANCIALLY WORSE OFFIPSOS SEA AHEAD SHIFTS & SENTIMENTS
Multiple Chart
IPSOS
View slide
This slide presents a comparative analysis with two distinct sections. The left side displays a blue column chart depicting 'ADJUSTED OPERATING PROFIT' in euros for five quarters. Beside it, a pie chart illustrates the 'Q1 adjusted operating profit margin.' The right side shows a column chart breaking down profits by business segment. Images of a modern office space are shown in the upper and lower right corners, offering a visual context for the financial data.
Financial Performance
Financial Services
Compares profitability across different business segments, highlighting improvements and variations, relevant for financial segment analysis or presentations to investors.
profitability, financial segments, adjusted operating profit, profit margin, quarter comparison, financial data, segment analysis, real estate, construction, financial services
false
Profitability improved, variation between segmentsGoldman Sachs Symposium presentation
Multiple Chart
Goldman Sachs
View slide
The slide is a mixture of column charts and color-coded segments, each representing a sector within Thailand's private funding landscape. It shows funding values from 2019 to H1 2023 and the number of deals, with a notable spike in H2 2022. The design employs a simple color scheme to differentiate sectors and effectively uses annotations to highlight key data points.
Investment Analysis
Financial Services
The content depicts the investment funding trends in Thailand, highlighting the return to typical levels after a substantial increase in the second half of 2022. It is useful for investors and financial analysts to assess the funding environment's normalcy and plan future investments in nascent sectors like travel, transport & food, digital media, e-commerce, and digital financial services (DFS).
Private Funding, Investment, Thailand, Trends, Sectors, E-commerce, DFS, Travel, Digital Media, Transport
false
Thailand Funding returns to more typical levels after a spike in H2 2022e-Conomy SEA 2023 report: Thailand
Single Chart
Bain
View slide
The slide includes several column charts comparing revenue, net income, capital, ROE, and overhead ratio from 2011 to 2021 across various banking sectors. It also features demographic data and global presence details.
Financial Performance
Financial Services
This slide showcases JP Morgan's growth in financial metrics like revenue, net income, and capital, alongside ROE and overhead ratios over ten years. It illustrates the expansion and market dominance of the CIB franchise globally, highlighting their extensive reach and efficiency in serving top global businesses.
revenue, capital, global, ROE, banking
false
Since the formation of the CIB, we have consistently delivered strong financial performance and remain the #1 CIB franchiseCorporate & Investment Bank 2022
Multiple Chart
JP Morgan
View slide
Photos of branch interiors and community engagement. Data boxes outline community strategy and roles.
Strategic Planning
Financial Services
Bank's approach to community engagement through tailored branch formats and local strategy implementation.
Community Engagement, Branch Evolution, Tailoring Execution, Local Strategy, Financial Services
false
We are evolving our branches and tailoring execution to meet the needs of local communitiesConsumer & Community Banking
Table
JP Morgan
View slide
Three pie charts showing geographical distribution of accounts, commissions, and client equity for IBKR.
Client Case Studies
Financial Services
Highlights geographical diversity in IBKR’s client base and financials, with pie charts displaying the regional spread of accounts and assets.
Geographical Diversity, Interactive Brokers, Client Accounts, Client Equity, Pie Charts, Americas, Europe, Asia-Pacific
false
Diversified Client Base – by Geography1Goldman Sachs US Financial Services Conference 2022
Multiple Chart
Goldman Sachs
View slide
A world map pinpoints manufacturing locations, accompanied by stats on global presence and strategic positioning. Visuals include icons and location counts per region which are highlighted in different colors.
Operational Efficiency
Industrial & Manufacturing
This slide illustrates TI Fluid Systems' global manufacturing footprint, emphasizing strategic location near key customers to optimize logistics and reduce costs, reflecting their operational efficiency and global market integration.
manufacturing, global footprint, operational efficiency, map
false
Global Low-Cost Manufacturing FootprintTI Fluid Systems Investor Presentation
Graphic
Deutsche Bank
View slide
The slide presents a segmented bar chart with text explanations on inflation impact responses and various cost increase management strategies.
Risk Assessment and Management
Consumer Goods
It explains how food & beverage companies manage inflation-driven cost increases through margin reduction, passing costs to customers, and other strategies.
Inflation, cost management, food & beverage, margin reduction, passing costs, supplier interventions, hedging, demand management
false
Considering convenience in isolation rather than part of full brand experience is a common pitfall.Customer loyalty and Convenience
Mixed Chart
Kearney
View slide
The slide is split into two parts, with one bar chart on the left showing oil demand and supply balance, and one column chart on the right showing global refining margins.
Market Analysis and Trends
Energy & Utilities
This slide discusses oil market fundamentals, highlighting supply-demand balance and refining margins, useful for understanding market dynamics in the energy sector.
oil demand, supply, refining margins, energy, market fundamentals
false
Oil demand, supply and inventories approaching a balance Refining margins improving, but unattractiveEY Price Point: global oil and gas market outlook Q2 | April 2021
Multiple Chart
EY
View slide
Features a line graph showing past and predicted future spending on social media, with spikes and trends annotated.
Market Analysis and Trends
Professional Services
Projects growth in social media spending, essential for investment strategies and market trend analysis in consumer services and media industries.
social media, spending, forecast, growth, investment, trend, analysis, consumer services, media, strategy
false
Social media spend increased slightly over the past year, but is expected to increase at a much faster pace moving forwardThe CMO Survey The Highlights and Insights Report February 2022
Mixed Chart
Deloitte
View slide
This slide features a dominant title with bullet points below explaining the trend. There's a flow diagram on the right illustrating the software development life cycle. The design is clean with a balance between text and visuals, using blue highlights to emphasize key areas.
Market Analysis and Trends
Technology & Software
The slide explains next-generation software development tools and processes, emphasizing the software life cycle stages affected by these advancements. It seems to be a detailed breakdown designed for viewers with some background in the field, highlighting the impact of AI in software development.
Software Development, Tools, AI, Life Cycle, Trends, Analysis, Process Improvement
false
What is this trend about?McKinsey Technology Trends Outlook 2022 Next-generation software development
Header Vertical
McKinsey
View slide
This slide uses a blue and white color scheme, with sections dedicated to each industry. Each section contains bullet points and corresponding icons.
Market Analysis and Trends
Transportation & Logistics
Explores the impact of mobility technology on different industries, detailing the specific implications for each, such as operational and business model changes.
automotive, aviation, telecommunications, ecosystem partnerships, bandwidth
false
What industries are most affected by the trend? slide 1McKinsey Technology Trends Outlook 2022 Future of mobility
Header Vertical
McKinsey
View slide
The slide contains a column chart showing managers' preparedness for upcoming global regulatory changes. An image of professionals discussing work is on the left.
Regulatory and Compliance
Financial Services
Analyzes the readiness of managers for upcoming global regulatory changes, detailing different levels of preparedness and gaps in infrastructure.
regulatory, compliance, managers, preparedness, global changes, investment, infrastructure, professionals, analysis
false
The growing regulatory agenda is a significant operational and reporting focus of the industryCan resilience shape a shifting landscape?
Mixed Chart
EY
View slide
This slide includes a table categorizing consumer personas by various health-related behaviors and preferences, such as digital skills, health data sharing, and virtual care consideration.
Market Analysis and Trends
Healthcare & Pharmaceuticals
It categorizes healthcare consumers into personas based on their digital skills, willingness to share health data, and openness to virtual care, providing insights for engagement strategies.
consumer personas, healthcare, digital skills, health data, virtual care
false
Summary, continued Consumer wants and needs vary, spotlighting opportunities for more nuanced engagement strategies.Health care consumer views on value
Multiple Chart
EY
View slide
A collection of column charts and feedback statements evaluating the pace of governmental reforms and sentiments towards governmental actions in France.
Regulatory and Compliance
Government & Public Sector
Analyzes opinions on the pace and effectiveness of governmental reforms in France, including insights into public sentiment and expectations from business leaders.
reforms, France, government, pace, public opinion
false
The pace of reforms is considered good by respondents, but they are divided on the presidential and governmental determination to succeedAmCham – Bain Barometer 19th Edition
Multiple Chart
Bain
View slide
Slide includes financial results tables and a column chart showing net revenues from FICC and equities. The layout is data-heavy with a clear distinction between the segments. Blue and grey bars represent the different revenue streams.
Market Analysis and Trends
Financial Services
Analyzes the financial results in global markets, presenting year-over-year and year-to-date comparisons. Useful for evaluating market trends, and understanding performance in FICC and equities for strategic decision-making.
Global Markets, FICC, Equities, Net Revenue
false
Global Markets Financial ResultsSecond Quarter 2022 Earnings Results Presentation
Mixed Chart
Goldman Sachs
View slide
A column chart showing the likelihood of enterprise executives using public blockchains in the future, with 75% believing public blockchains are in their future. Accompanied by text explaining the challenges of private blockchains and the advantages of public networks.
Market Analysis and Trends
Technology & Software
Shows survey results indicating a strong trend among enterprises towards adopting public blockchains due to the challenges faced with private blockchain networks.
Public blockchains, enterprise, challenges, private blockchains, survey, future adoption, power of public networks
false
For enterprises that have experienced the challenges of building private blockchains, most now understand the power of public networksGoing Public EY Global Blockchain Summit 2020
Mixed Chart
EY
View slide
Two large column charts detailing population and spending, accompanied by a colored map of Indonesia showing school connectivity rates. Visual elements are clear and neatly organized, using blues and oranges to differentiate data points.
Strategic Planning
Education & Training
Explains the connectivity challenges faced by schools across various Indonesian islands, showing the correlation between population size, economic contributions, and school connectivity.
school connectivity, population data, economic analysis, Indonesia, mapping
false
Majority schools have limited or no connectivity in the sparsely populated islandsIndonesia case study
Multiple Chart
BCG
View slide
The slide shows column charts representing the adoption rates of physician support systems, such as medication management systems and clinical decision support tools, in hospitals across different APAC regions.
Technology and Digital Transformation
Healthcare & Pharmaceuticals
The slide focuses on the adoption of physician support systems like medication management systems, clinical workflow management systems, and clinical decision support tools across hospitals in APAC, noting lower adoption rates in Japan.
APAC, physician support, hospitals, adoption, digital tools
false
On average, 25%-35% of hospitals in most of APAC are using physician support systems to improve patient outcomes; Japan, however, consistently has lower adoptionAsia-Pacific 2022 Hospital Priorities Survey: Strategic Implications for Healthcare Providers
Multiple Chart
LEK
View slide
The slide contains a mix of text and icons describing primary end markets, demand drivers, and outlook for the waste and recycling segment.
Market Analysis and Trends
Environmental Services & Sustainability
It details the resilience of the waste and recycling segment against commercial volume reduction, highlighting residential, commercial, and industrial demand.
Waste, recycling, demand, commercial, residential, industrial, segment, outlook, primary markets
false
Waste and recyclingsegment has not been significantly affected despite commercial volume reduction and lower recycling ratesEnvironmental Services Outlook
Table
LEK
1
...
Next
Load More
Hold On!
We are searching in our database
If nothing, comes up, please try different filters!
Create a FREE account to continue browsing
Receive Instant Access to 8,000+ of the internet's best slides
First Name
Last Name
Email
Password
I agree to all
Terms & Privacy Policy
Thank you! Your submission has been received!
Oops! Something went wrong while submitting the form.
Have an account?
Sign in
Column Chart
Heatmap
Chevron
Org Chart
Infographic
Callouts
Timeline
List
Graphic
Picture
Process Flow
Diagram
Paragraph
Map
Table
Framework
Subtitle
Takeaway Box
Icon
Other Chart
Radar Chart
Waterfall Chart
Mekko Chart
Pie Chart
Scatter Plot
Line Chart
Bar chart
Bullet points