🎉 Black Friday Sale!
- Save 20% on SlideStart Pro Annual plan! CODE:
BLACKFRIDAY
My Account
My Slides
Search by Category
Templates
View All Templates
Download Template Slides
Leave Feedback
Login
Logout
Get Started
Browse all Slides
Browse all Slides
Create a FREE Account
Instant access to 1,000+ real slides from top companies like McKinsey, BCG, Goldman Sachs, Google and many more!
First Name
Last Name
Email
Password
I agree to all
Terms & Privacy Policy
Thank you! Your submission has been received!
Oops! Something went wrong while submitting the form.
Have an account?
Sign in
Instant access to the internet's best slides
Get access to 40+ advanced filters and more
Advanced Search and Filters
Access to
10,000+ slides
Access to Category Pages
Save/Bookmark Slides
PowerPoint Template Library (New)
Choose your plan
MONTHLY
$12/month
Billed every month, cancel anytime.
YEARLY
$9/month
Billed $108 annually, cancel anytime.
Checkout for $12/month
Checkout for $108/yr
Secured by Stripe | AES-256 bit encryption
Spark Your Next Big Idea with New Presentation Templates
VIEW ALL Templates
Welcome,
Welcome
Upgrade to SlideStart
Pro
Instant access to 15,000+ slides
Show Featured Only
Checkbox 8
Companies
Mckinsey
Bain
BCG
EY
Deloitte
Accenture
PwC/Strategy&
JP Morgan
Goldman Sachs
Morgan Stanley
Citigroup
Deutsche Bank
Barclays
LEK
Kearney
Oliver Wyman
Booz Allen Hamilton
Gartner
IPSOS
Nielsen
Slide type
Header Horizontal
Framework
Vertical Flow
Single Chart
Single Chart
Text Only
Mixed Chart
Header Vertical
Graphic
Pillar
Multiple Chart
Agenda
Title
Table
Linear Flow
Upgrade to SlideStart
Pro
Instant access to 40+ advanced filters
Industry
Upgrade to SlideStart
Pro
Instant access to 40+ advanced filters
Technology
Healthcare
Financial Services
Consumer Goods
Energy & Utilities
Manufacturing
Retail
E-commerce
Logistics
Telecommunications
Real Estate
Professional Services
Education
Media
Entertainment
Hospitatlity
Tourism
Agriculture
Food Production
Government & Public Sector
Environmental
Sustainability
Use Case
Upgrade to SlideStart
Pro
Instant access to 40+ advanced filters
Sales and Business Development
Mergers and Acquisitions
Corporate Finance and Valuation
Performance Metrics and KPIs
Client Case Studies
Competitive Landscape
Product and Service Analysis
Customer and Market Segmentation
Organizational Structure
Human Resources and Talent Management
Industry Overview
Regulatory and Compliance
Risk Assessment and Management
Agriculture & Food Production
Hospitality and Tourism
Government
Environmental
Sustainability
Clear all
Thank you! Your submission has been received!
Oops! Something went wrong while submitting the form.
Show Featured Only
Checkbox 8
Companies
Mckinsey
Bain
BCG
EY
Deloitte
Accenture
PwC/Strategy&
JP Morgan
Goldman Sachs
Morgan Stanley
Citigroup
Deutsche Bank
Barclays
LEK
Kearney
Oliver Wyman
Booz Allen Hamilton
Gartner
IPSOS
Nielsen
Slide type
Text Only
Linear Flow
Vertical Flow
Single Chart
Header Horizontal
Mixed Chart
Header Vertical
Pillar
Multiple Chart
Graphic
Agenda
Title
Table
Framework
Industry
Technology
Healthcare
Financial Services
Consumer Goods
Energy & Utilities
Manufacturing
Retail
E-commerce
Logistics
Telecommunications
Real Estate
Professional Services
Education
Media
Entertainment
Hospitatlity
Tourism
Agriculture
Food Production
Government & Public Sector
Environmental
Sustainability
Use Case
Sales and Business Development
Mergers and Acquisitions
Corporate Finance and Valuation
Performance Metrics and KPIs
Client Case Studies
Competitive Landscape
Product and Service Analysis
Customer and Market Segmentation
Organizational Structure
Human Resources and Talent Management
Industry Overview
Regulatory and Compliance
Risk Assessment and Management
Agriculture & Food Production
Hospitality and Tourism
Government
Environmental
Sustainability
Clear all
Thank you! Your submission has been received!
Oops! Something went wrong while submitting the form.
Tag
View slide
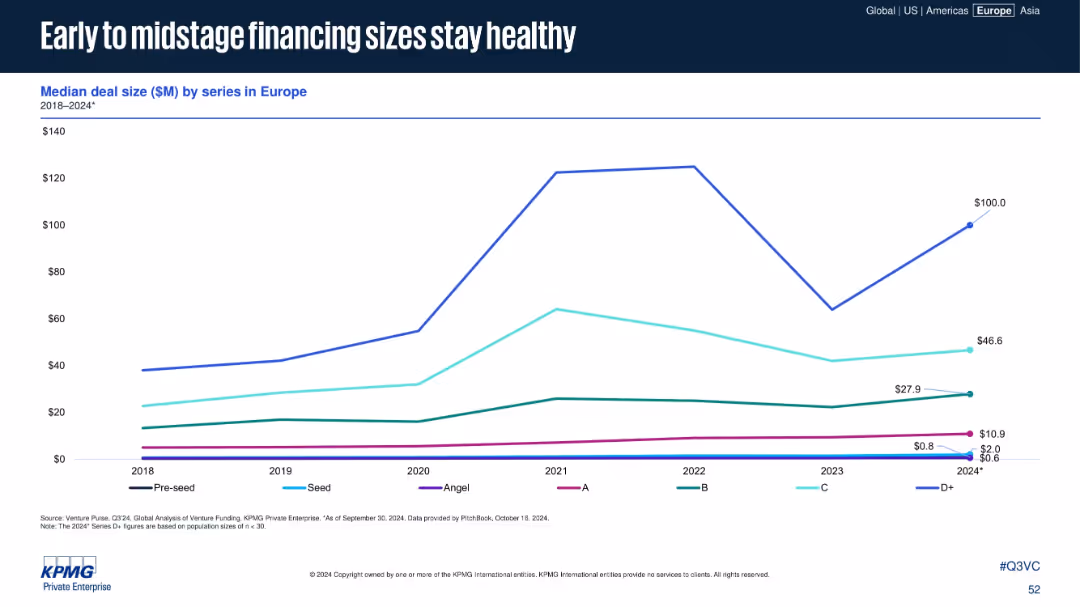
Line chart showing deal size by funding series (Pre-seed to D+) from 2018 to 2024
Performance Metrics and KPIs
Financial Services
This slide tracks the median deal size by funding series in Europe, with strong growth in D+ rounds rebounding in 2024. Early and mid-stage rounds (Series A to C) maintain consistent or growing deal sizes, signaling investor confidence.
Series A, Series B, VC financing, deal size, startup growth
false
Early to midstage financing sizes stay healthyVenture Pulse Q3 2024
Single Chart
KPMG
View slide
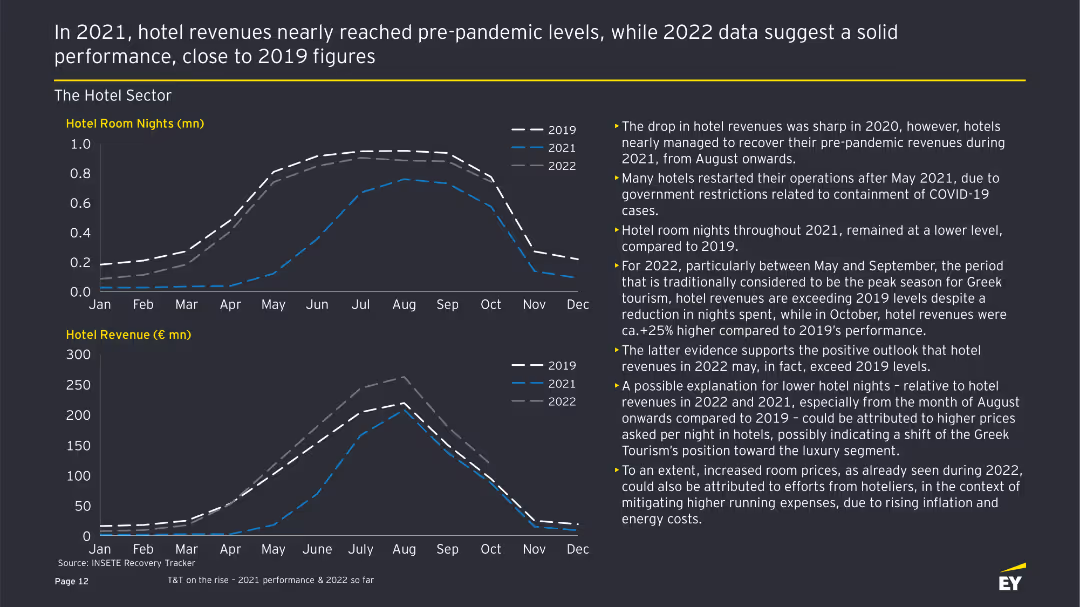
The slide features two line charts showing hotel room nights and revenue from 2019 to 2022, with accompanying text highlighting trends and performance.
Financial Performance
Hospitality & Tourism
This slide provides an analysis of the Greek hotel sector's performance, comparing room nights and revenue across different years, emphasizing recovery and growth trends.
Hotel performance, room nights, revenue analysis, financial performance, tourism trends
false
In 2021, hotel revenues nearly reached pre pandemic levels, while 2022 data suggest a solid performance, close to 2019 figuresIndustry Pulse Report: Travel & Tourism
Multiple Chart
EY
View slide
Integrates pie charts and text blocks. Blue and grey tones highlight different regions and sectors in real estate.
Risk Assessment and Management
Real Estate & Construction
Offers an analysis of non-recourse loans and exposure in CRE by region and sector, highlighting financial risks and market conditions.
Commercial real estate, loans, stress test, market analysis, risk assessment, regions, sectors
false
Commercial Real Estate (CRE) 1 / 2Q3 2023 Fixed Income Investor Conference Call
Multiple Chart
Deutsche Bank
View slide
Mix of tables, column charts, and a summary section, along with textual annotations and headings for each section.
Investment Analysis
Financial Services
Slide analyzes alternative investment assets, fees, and balance sheet allocations. Appropriate for discussions on investment strategy or financial planning.
Alternative Investments, Fees, Asset Allocation
false
Asset & Wealth Management –Alternative InvestmentsFull Year and Fourth Quarter 2023 Earnings Results Presentation
Multiple Chart
Goldman Sachs
View slide
The slide is divided into sections with each key message presented in a colored box containing icons and brief text, making the information clear and visually segmented.
Regulatory and Compliance
Environmental Services & Sustainability
Summarizes the pivotal findings of the survey, emphasizing high priorities like ESG remaining a top agenda, the need for a common taxonomy for ESG reporting, and the necessity of updating tax policies to foster a better environment for green finance.
ESG, Green finance, Tax policies, Reporting, Market maturity
false
Key messages to take homeAFF 2023 HKTDC and PwC’s Joint Pulse Survey
Pillar
PwC/Strategy&
View slide
The slide features a dark background with white and yellow text, highlighting survey results with column charts.
Market Analysis and Trends
Healthcare & Pharmaceuticals
It discusses the importance of healthcare experience for consumers, with survey results showing 44% above average, 26% average, and 30% below average rating.
healthcare, consumer, experience, survey, England
false
‘The experience is important to me.’ Consumers: EnglandHealth care consumer views on value
Mixed Chart
EY
View slide
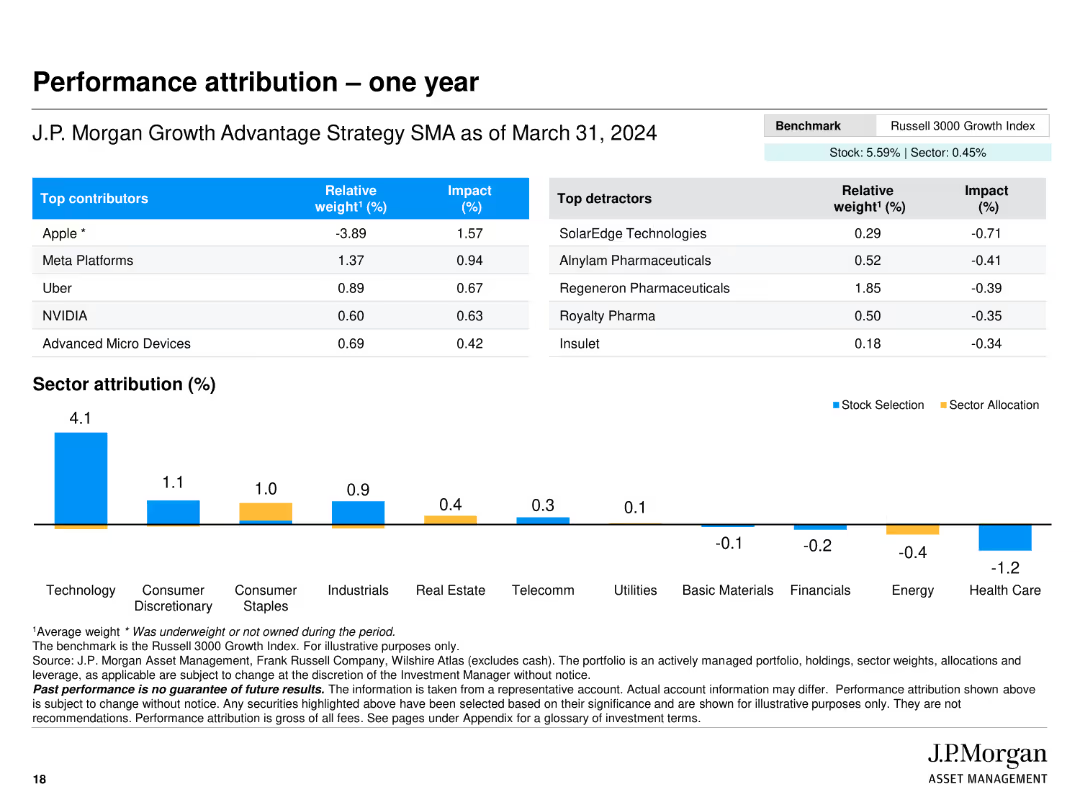
The slide includes tables showing top contributors and detractors to performance, along with sector attribution presented in a bar chart with stock selection and sector allocation data.
Investment Analysis
Financial Services
Analyzes the performance of J.P. Morgan Growth Advantage Strategy, detailing top contributing and detracting companies and the impact of stock selection and sector allocation.
performance, attribution, contributors, detractors, sector, allocation, bar chart, table
false
Performance attribution – one yearJ.P. Morgan Growth Advantage Strategy
Mixed Chart
JP Morgan
View slide
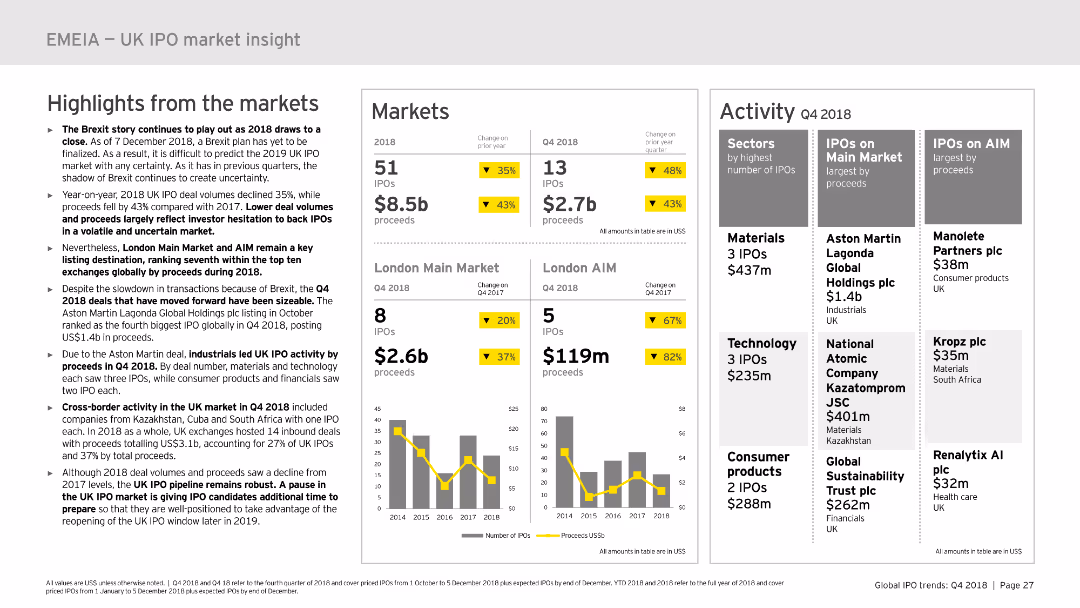
This slide includes multiple sections: highlights from the market, markets, and activity. It uses column charts and data tables to present IPO data and market performance in the UK. The layout is detailed, offering a clear and structured overview of the market insights.
Market Analysis and Trends
Financial Services
Provides insights into the UK IPO market in 2018, including market highlights, performance data, and activity details. Useful for market analysis and strategic planning in the financial sector.
UK, IPO, market insight, performance, trends
false
Highlights from the markets The Brexit story continues to play out as 2018 draws to a close.Big vs agile? Global IPO trends: Q4 2018 Mega and unicorn IPOs characterize 2018 deal landscape; trend to continue in 2019
Multiple Chart
EY
View slide
Slide displays two pie charts: one for company size distribution and another for industry distribution within a sample from France.
Industry Overview
Professional Services
Provides a demographic breakdown of respondents' companies by size and industry, useful for understanding the sample structure in market research.
company size, industry distribution, market research, demographics, France
false
Respondents’ companies by size and industryAmCham – Bain Barometer 19th Edition
Multiple Chart
Bain
View slide
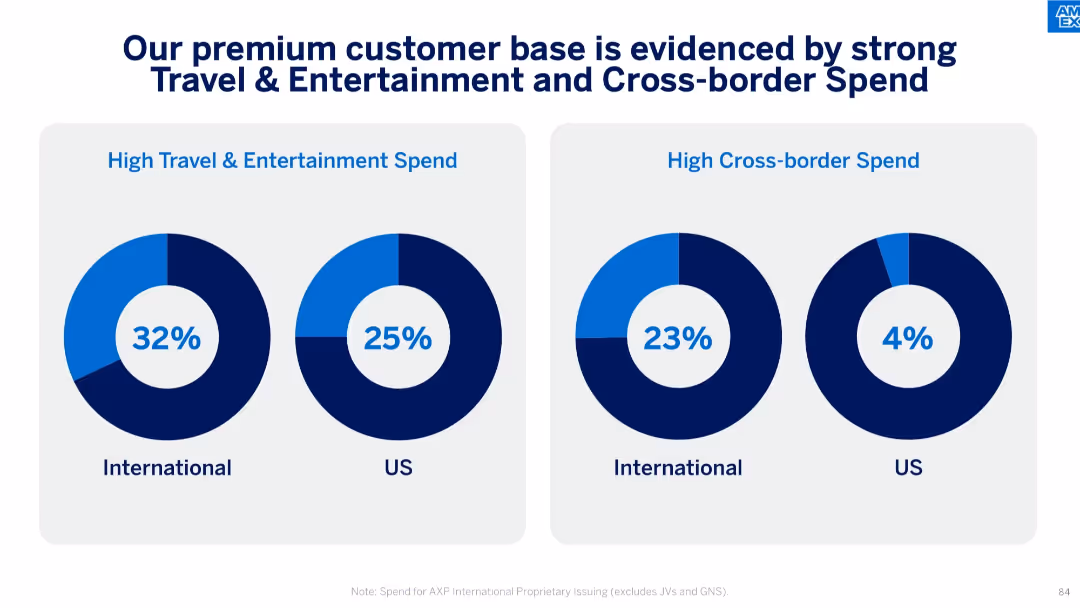
Dual donut charts showing % of spend in T&E and cross-border categories for International vs US.
Customer and Market Segmentation
Financial Services
AXP's international customers show higher spending in travel, entertainment, and cross-border transactions compared to US customers. This slide reinforces the brand's alignment with affluent and globally active users.
premium customers, travel spend, entertainment, cross-border, international, consumer behavior, T&E, global usage
false
Our premium customer base is evidenced by strong Travel & Entertainment and Cross-border SpendAmerican Express Investor Day 2024
Single Chart
McKinsey
View slide
Contains bullet points and iconography. It features a high-level summary of Western Australia's LNG industry, economic contributions, and impact metrics like $220 billion added and 57,000 workers.
Industry Overview
Energy & Utilities
Highlights Western Australia's significant role in the LNG industry, mentioning major projects, economic contributions, and employment impact over the last decade.
LNG, Economic Impact, Western Australia, Energy Industry, Employment, Major Projects, Investment, Tax Revenue
false
The oil and gas industry helps drive the Western Australian economyThe economic contribution of Western Australia’s oil and gas industry
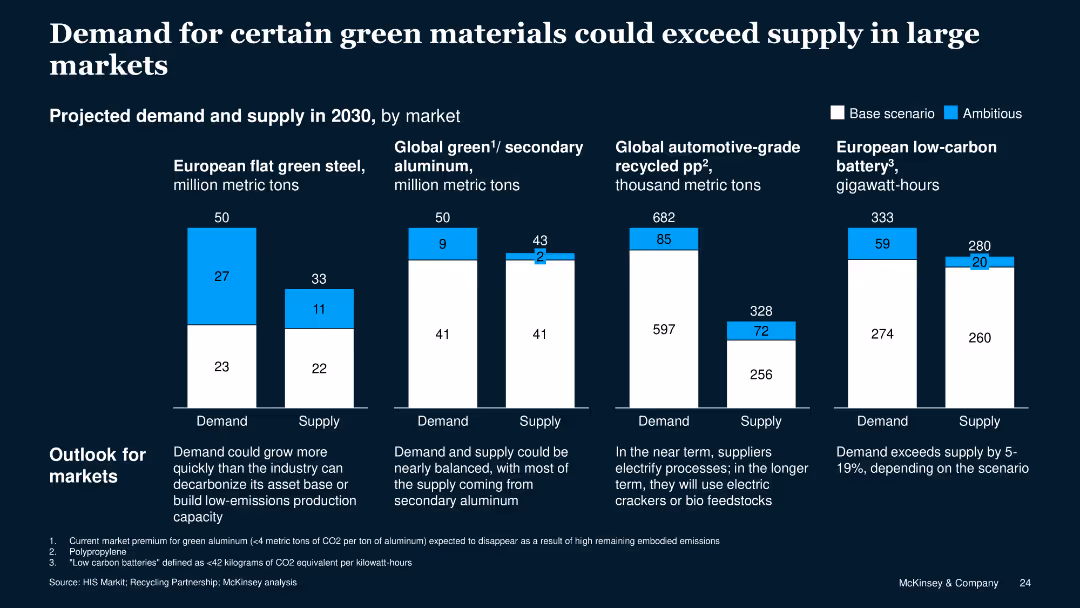
Header Horizontal
EY
View slide
The slide displays multiple column charts comparing projected demand and supply for various green materials in 2030, with blue and white bars.
Market Analysis and Trends
Industrial & Manufacturing
This slide analyzes the future demand and supply of green materials, highlighting potential shortages in key markets such as green steel, aluminum, recycled polypropylene, and batteries.
demand, supply, green materials, market analysis, trends, 2030, steel, aluminum, polypropylene, batteries
false
Demand for certain green materials could exceed supply in large marketsBest Practices in Private Sector Sustainable Procurement
Multiple Chart
McKinsey
View slide
The slide displays a series of table and pie charts with financial data across various business segments. It uses a clean, corporate color scheme predominantly featuring blues and grays.
Financial Performance
Financial Services
Provides a comprehensive financial overview of the company, including a full year net revenue mix and comparisons of current and past fiscal quarters.
financial overview, revenue mix, net earnings, investment banking, asset management
false
Financial Results Full Year Net Revenue Mix by Segment $ in millions, except per share amountsFull Year and Fourth Quarter 2019 Earnings Results Presentation
Mixed Chart
Goldman Sachs
View slide
The slide provides key figures and statements around the potential impact of quantum technologies. It employs a simple layout with icons to accompany the text, making the statistical data and projections stand out clearly against the dark background.
Strategic Planning
Technology & Software
Highlighting the financial stakes and developmental progress of quantum technologies, this slide aims to persuade business leaders of the urgency and importance of paying attention to this emerging field. It combines market projections with the current status of the technology to build a case for investment and interest.
Quantum, Leadership, Investment, Market
false
Why should leaders pay attention?McKinsey Technology Trends Outlook 2022 Quantum technologies
Pillar
McKinsey
View slide
The slide contains two column charts and a pie chart depicting customer engagement through various banking channels and related transaction statistics.
Financial Performance
Financial Services
Presents the bank's omnichannel service model, emphasizing the balance between self-service transactions and branch visits, highlighting digital and in-branch engagement.
omnichannel, banking, customer engagement, digital transactions, branch services, self-service, multi-channel, financial services, transaction statistics
false
Branches are an important part of our omnichannel service and engagement modelInverstors Day 2023
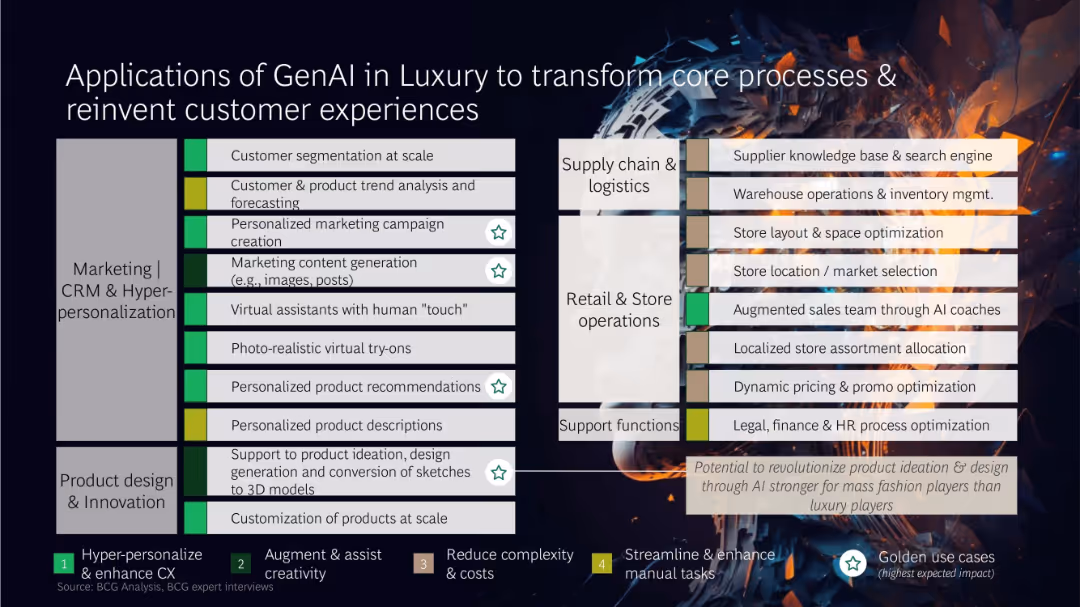
Multiple Chart
JP Morgan
View slide
Matrix layout categorizing GenAI use cases across business functions, with color-coded impact labels and icons
Technology and Digital Transformation
Artificial Intelligence
This slide presents a comprehensive matrix of GenAI applications across marketing, product design, retail operations, supply chain, and support functions. High-impact use cases include dynamic pricing, AI-assisted sales, and virtual try-ons, transforming both front-end and back-end operations.
GenAI, luxury, CRM, product design, automation, customer experience, AI use cases
false
Applications of GenAI in Luxury to transform core processes & reinvent customer experiencesTrue-Luxury Global Consumer Insights
Table
BCG
View slide
A list detailing NFT use cases across industries like Digital Art, Sports, Music, Real Estate, Gaming, and Finance. Each has icons and descriptions.
Industry Overview
Media & Entertainment
Outlines various NFT applications across multiple sectors, emphasizing the breadth of NFT adoption and its impact on different industries. Essential for industry overview presentations on NFTs.
NFTs, Use Cases, Digital Art, Sports, Music, Real Estate, Gaming, Finance
false
Use cases for NFTs have proliferated across industriesBlockchain and Digital Assets
Table
McKinsey
View slide
The slide contains two column charts illustrating the increase in levelized cost of energy production for coal and natural gas power plants with various CO2 capture rates.
Market Analysis and Trends
Energy & Utilities
The slide details how applying CCUS to power plants increases the levelized cost of production, with moderate impacts from higher capture rates. The left chart shows cost increases for coal, and the right for natural gas, highlighting the additional cost burden at different capture rates.
CCUS, power plants, production cost, CO2
false
Increase in levelized cost of production for CCUS power plantsCarbon Capture Utilization and Storage
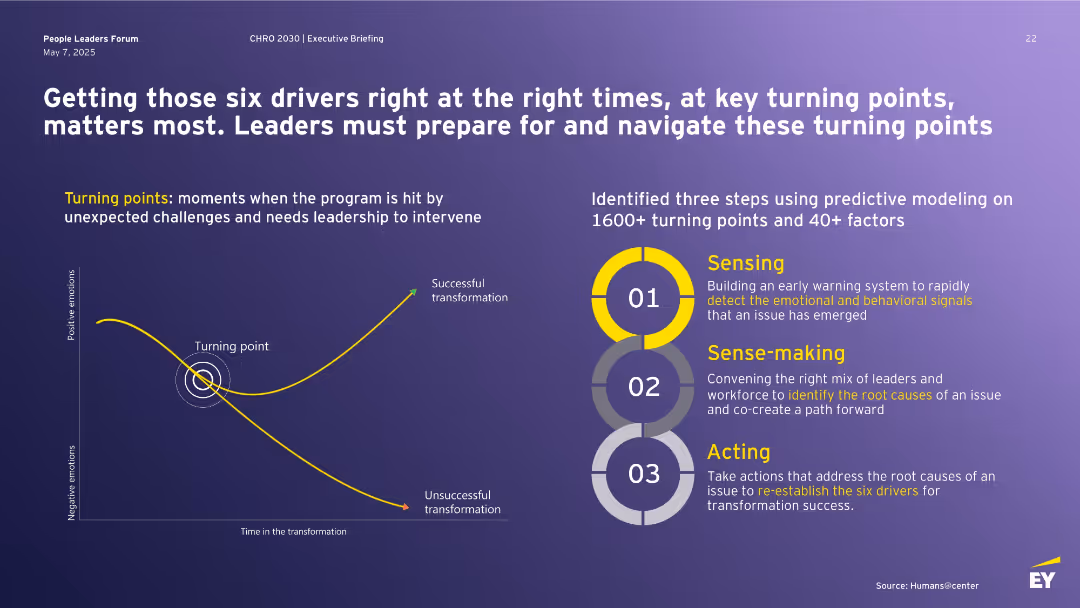
Multiple Chart
Kearney
View slide
Dark background with bold white heading at top, yellow-highlighted keywords, chart on left showing turning point curve, and three-step circular graphic on right.
Strategic Planning
Professional Services
The slide emphasizes the importance of timing in leadership interventions during transformation initiatives. It introduces the concept of “turning points” and outlines a three-step model—Sensing, Sense-making, Acting—based on data analysis of over 1,600 cases. The aim is to guide leaders through critical transformation junctures.
transformation, leadership, turning point, predictive modeling, intervention, success, emotional signals, root cause, business change
false
Getting those six drivers right at the right times, at key turning points, matters most. Leaders must prepare for and navigate these turning pointsPeople Leaders Forum
Mixed Chart
EY
View slide
Four bar chart comparisons on left, with accompanying explanatory text on right in dark-themed box. Charts cover processing time, accuracy, context relevancy, and scalability.
Performance Metrics and KPIs
Financial Services
Compares Elastic RAG to a Naive RAG method across various metrics (accuracy, processing time, relevancy, scalability) for ESG data extraction. The analysis shows that Elastic RAG consistently outperforms in extracting relevant data with better accuracy and speed. Highlights its robustness, scalability, and potential to improve ESG data handling in a scalable AI-driven platform.
ESG metrics, Elastic RAG, performance comparison, context relevancy, AI, scalability
false
Use case implementation evaluation (Cont’d)Enhanced Data Extraction using Gen AI
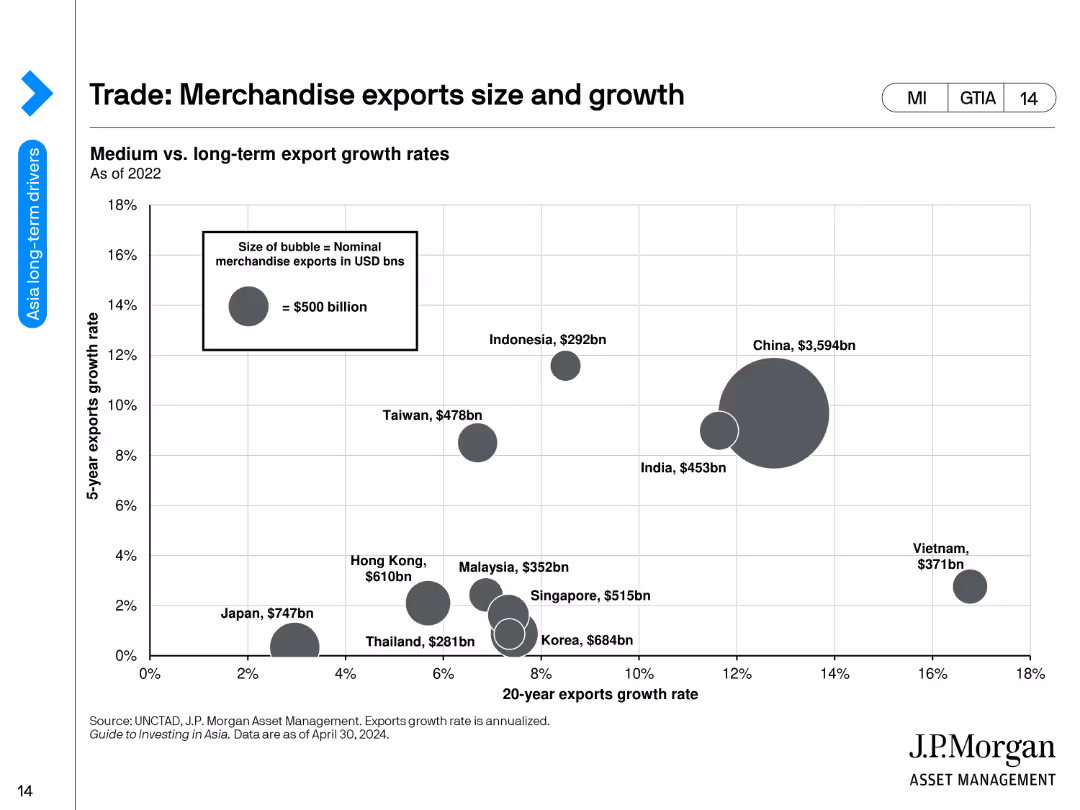
Multiple Chart
EY
View slide
A bubble chart showing the merchandise export growth rates and sizes for various countries.
Market Analysis and Trends
Financial Services
The slide analyzes the medium vs. long-term export growth rates of merchandise exports for different countries, represented by bubble sizes corresponding to export values.
merchandise exports, growth rates, economic analysis, countries, trade, export values, financial trends, bubbles, development, export growth
false
Trade: Merchandise exports size and growthGuide to Investing in Asia
Single Chart
JP Morgan
View slide
This slide has a large image on the left and column charts on the right, detailing the impact of ESG policies on investment decisions and investor satisfaction with these policies.
Regulatory and Compliance
Financial Services
The slide discusses the evolution of ESG policies among managers and the increasing focus of investors on these policies, highlighting their importance in investment decisions.
ESG, managers, investors, policies, corporate
false
Managers continue to evolve on corporate ESG policies; investor focus also still growingCan resilience shape a shifting landscape?
Multiple Chart
EY
View slide
Four-column chart layout; red and gray vertical bar charts; minimal text above each chart; percentage growth bubbles; clean and consistent infographic style
Market Analysis and Trends
Industrial & Manufacturing
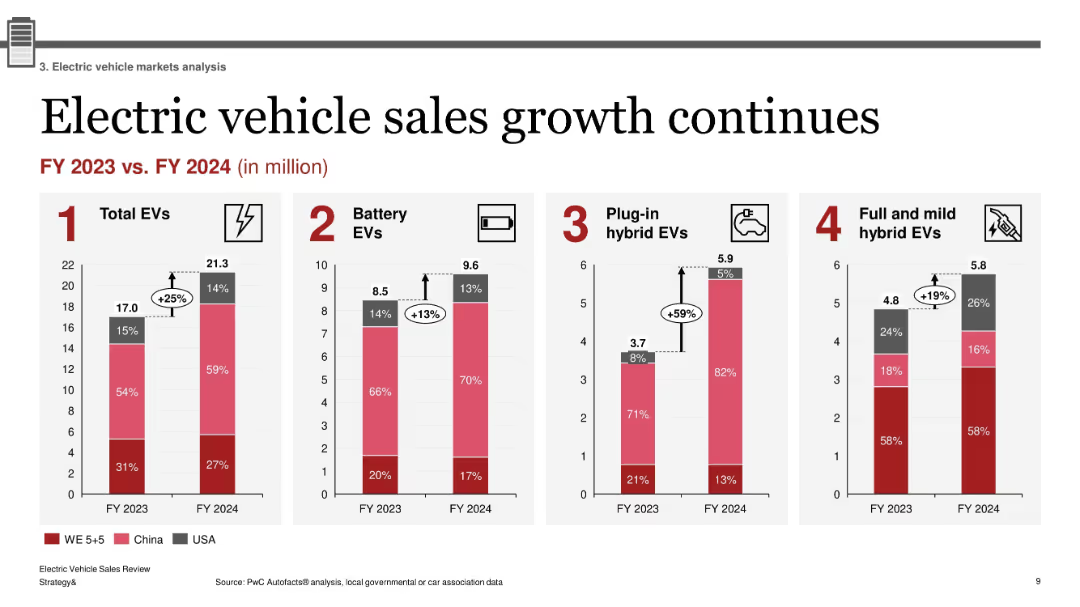
The slide illustrates year-over-year growth in EV sales across four categories (Total EVs, Battery EVs, Plug-in Hybrids, and Hybrids) from FY2023 to FY2024. It shows a 25% increase in total EVs, with notable growth in PHEVs (+59%). Sales are broken down by region (Western Europe, China, USA).
EV growth, battery EV, plug-in hybrid, market trends, regional EV sales, FY2024, BEV, hybrid EVs, PHEV
false
Electric vehicle sales growth continuesElectric Vehicle Sales Review Q4 2024
Multiple Chart
PwC/Strategy&
View slide
The slide features a column chart showing the breakdown of LCOH for the SMR example, including segments for Capex, startup costs, fuel, water, catalysts, labor and overhead, maintenance, insurance, and electricity selling. Each segment's percentage of total LCOH is displayed.
Financial Performance
Energy & Utilities
This slide provides a detailed breakdown of the LCOH for SMR, illustrating the contributions of various cost factors like Capex, fuel, and maintenance to the overall cost. It offers a financial analysis of hydrogen production using SMR.
LCOH, SMR, Cost Breakdown, Hydrogen, Financial Analysis
false
LCOH breakdown: SMR exampleHydrogen applications and business models
Single Chart
Kearney
View slide
Column chart showing carbon emissions reduction goals; text on the left
Strategic Planning
Environmental Services & Sustainability
Discusses EY's sustainability goals and achievements, including carbon neutrality and net-zero targets
Sustainability, carbon, EY, goals, emissions
false
EY's ambition: to become net zero on a global level by 2025EY Italia for the country system
Mixed Chart
EY
View slide
Features a blue column chart indicating the percentage of users increasing food delivery frequency, with additional insights in text format.
Market Analysis and Trends
Retail & E-commerce
Analyzes the food delivery sector, showing the surge in user frequency and the competitive landscape. This slide is essential for businesses operating in or entering the food delivery market, providing data to strategize on customer retention and market entry.
Food Delivery, User Growth, Market
false
Food delivery remains sizzling hot, with incumbents expanding rapidly and new entrants rushing to join the racee-Conomy SEA 2021 Roaring 20s: The SEA Digital Decade
Mixed Chart
Bain
View slide
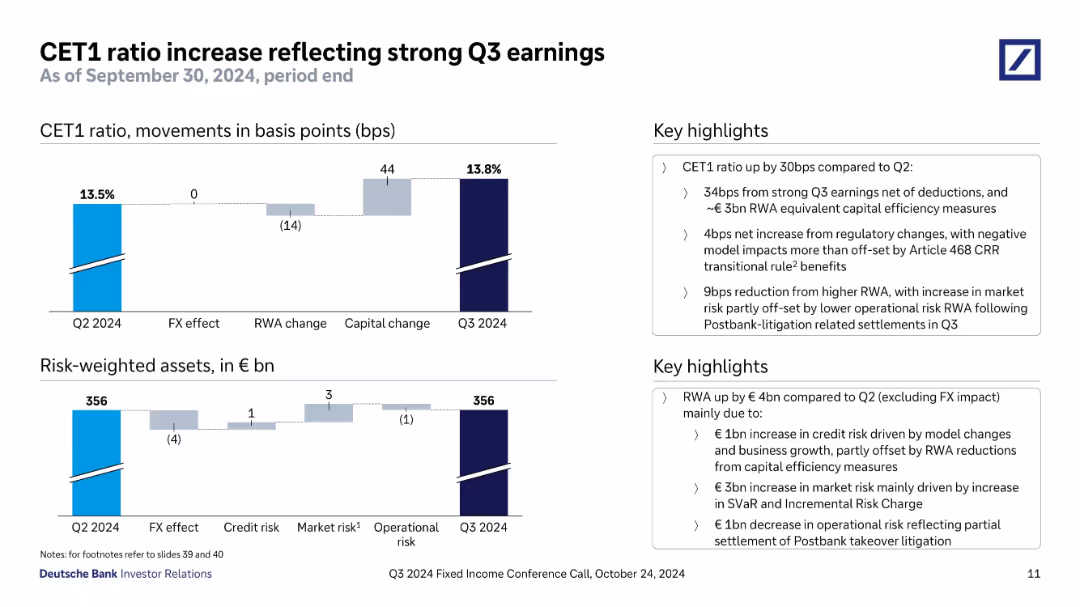
Top chart shows CET1 ratio change in basis points; bottom chart shows changes in risk-weighted assets. Key drivers annotated. Sidebar text summarizes the changes and regulatory impacts.
Regulatory and Compliance
Financial Services
Shows CET1 ratio improvement to 13.8% in Q3 2024, driven by strong earnings and capital efficiency. Regulatory changes and RWA movements are detailed, with breakdowns by credit, market, and operational risks.
CET1 ratio, capital adequacy, Q3 earnings, RWA, risk-weighted assets, regulatory change, Postbank litigation
false
CET1 ratio increase reflecting strong Q3 earningsQ3 2024 Fixed Income Investor Conference Call
Multiple Chart
Deutsche Bank
View slide
The slide displays a generational breakdown of luxury goods consumers using vertical column charts, showing shifts from 2018 to projected 2035 figures.
Customer and Market Segmentation
Consumer Goods
Analyzes generational shifts in the consumption of luxury goods, highlighting the growing influence of Gen Y and Gen Z in the market.
Generational trends, Luxury goods, Market analysis
false
YOUNGER CUSTOMER BASE WILL DELIVER ALL OF THE MARKET’S GROWTH IN 2019; GEN Y RAPIDLY APPROACHING 50% OF MARKET VALUEBAIN-ALTAGAMMA 2019 WORLDWIDE LUXURY MARKET MONITOR
Mixed Chart
Bain
View slide
Graphical layout with bar charts comparing technology in use and deployment across various domains.
Technology and Digital Transformation
Technology & Software
Slide depicts technology usage and deployment statistics, emphasizing the higher adoption rate of hybrid work technologies.
Technology, Statistics, Hybrid Work, Data Analysis
false
Technology in use or being deployedFuture Workplace Index 2.0
Single Chart
EY
View slide
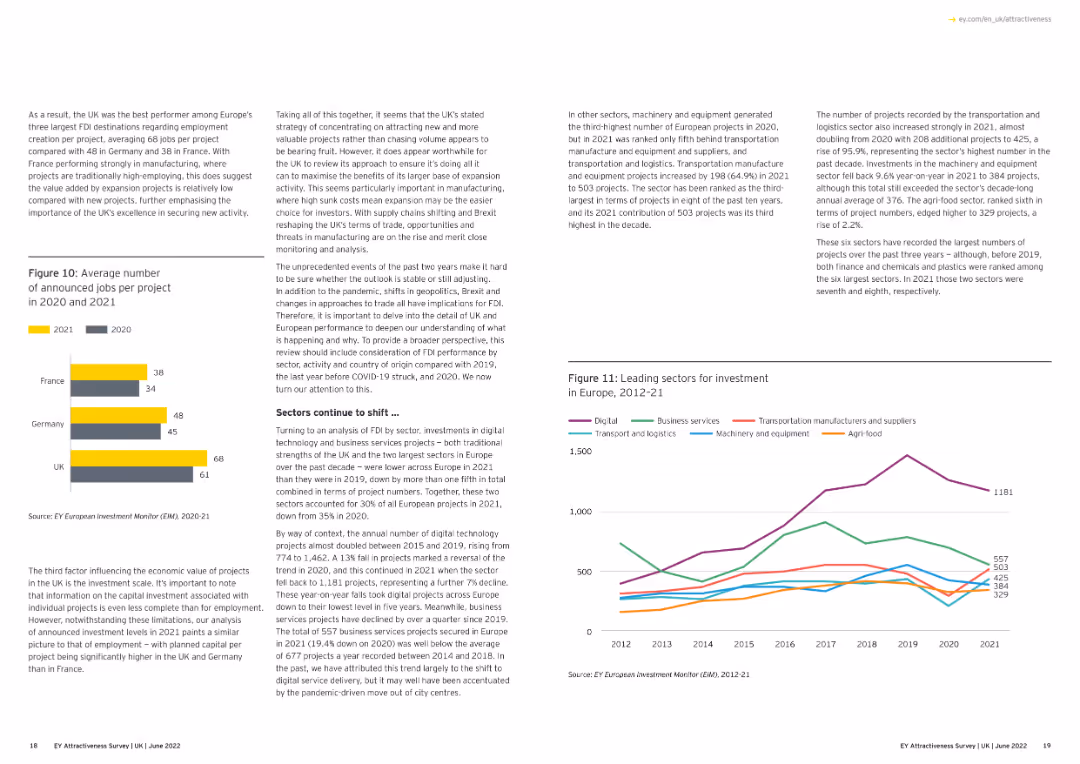
This slide features a column chart comparing the average number of announced jobs per project in 2020 and 2021 for the UK, Germany, and France.
Market Analysis and Trends
Financial Services
The slide presents a comparison of the average number of announced jobs per project in 2020 and 2021 across three countries, highlighting the UK's performance.
FDI, jobs, comparison, UK, Germany, France
false
As a result, the UK was the best performer among Europe’s three largest FDI destinations regarding employment creation per project,Adapting to a changed world EY Attractiveness Survey
Multiple Chart
EY
View slide
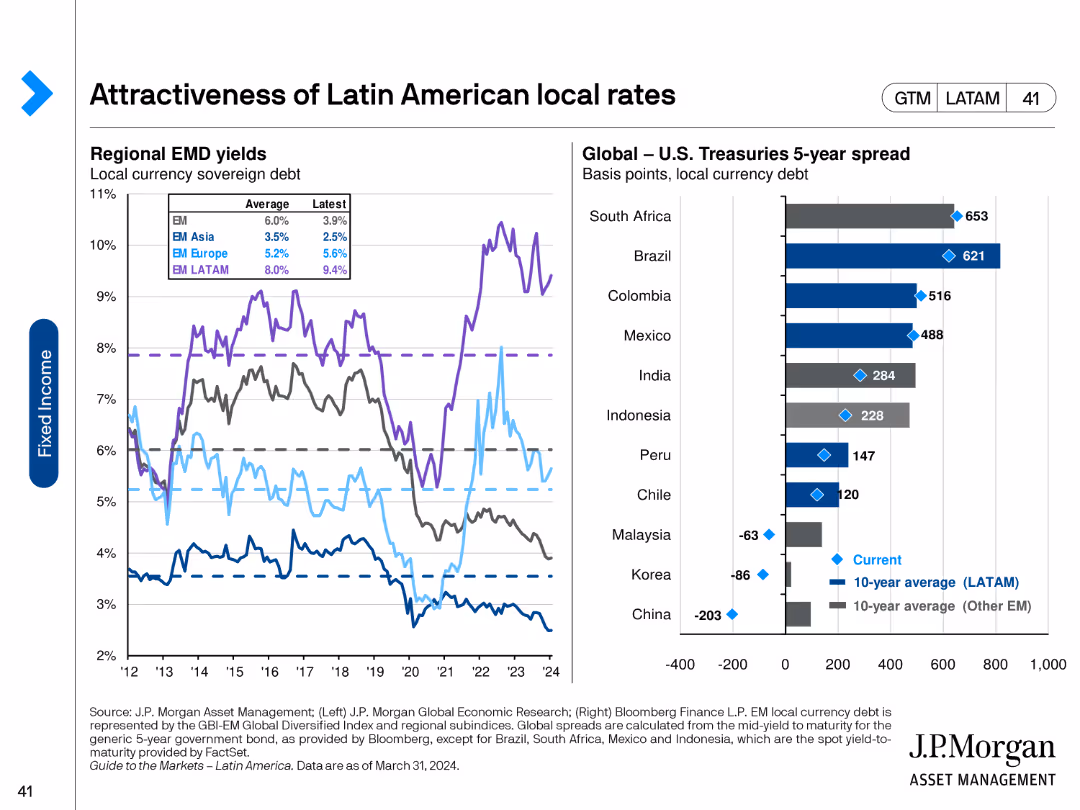
This slide features line charts showing regional EMD yields and a column chart comparing global U.S. Treasuries 5-year spread across various countries.
Market Analysis and Trends
Financial Services
The slide evaluates the attractiveness of Latin American local rates by comparing EMD yields and U.S. Treasury spreads across different countries, highlighting investment opportunities and risks.
Latin America, local rates, EMD yields, U.S. Treasuries, investment opportunities, investment risks, economic analysis
false
Attractiveness of Latin American local ratesGuide to the Markets Latin America | 2Q 2024
Multiple Chart
JP Morgan
View slide
Scatter plot and table comparing return, risk, and ratios of international stock categories.
Investment Analysis
Financial Services
Compares small cap and emerging market stocks, useful for assessing risk and diversification.
Small Cap Stocks, Emerging Markets, Risk Assessment, Diversification, Returns, Data Table, Scatter Plot, Morgan Stanley, Market Monitor
false
International Small Cap Stocks May Offer Attractive Diversification BenefitsMonthly Market Monitor January 2024
Single Chart
Morgan Stanley
View slide
Contains segmented column charts showing direct and indirect contributions of tourism to the GDP and employment in Europe.
Strategic Planning
Hospitality & Tourism
Examines the direct and indirect economic impacts of tourism in Europe, including contributions to GDP and employment figures.
Tourism, GDP, Employment, Economic impact, Europe
false
Overall tourism contributed directly to ~4% of GDP and 12M jobs in 2019, up to ~6% and 22M if considering indirect impactHigh-end Tourism - a strong driver for Europe
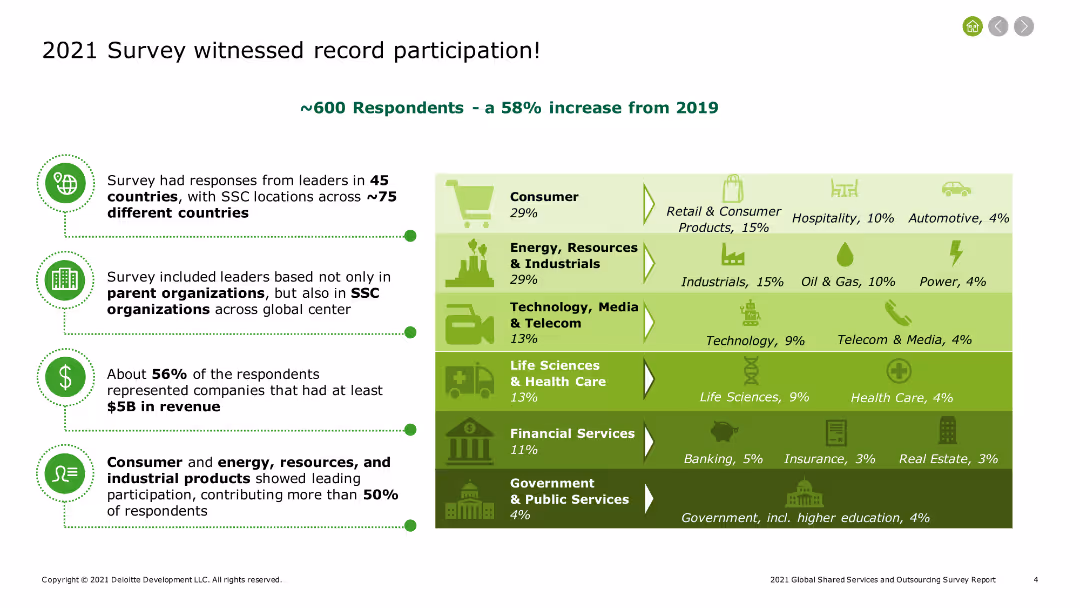
Mixed Chart
Bain
View slide
The slide includes a summary of survey participation, with key points highlighted in bullet form on the left and a stacked bar chart on the right showing the distribution of respondents across various industries such as consumer products, energy, and technology.
Industry Overview
Professional Services
The slide summarizes the 2021 survey participation, noting a 58% increase from 2019. It highlights the diverse representation from different industries and companies with substantial revenue, providing a broad overview of the survey demographics and industry engagement.
Survey participation, industry overview, respondent distribution, 2021 survey, consumer products, energy, technology, revenue analysis, survey demographics
false
2021 Survey witnessed record participation!2021 Global Shared Services and Outsourcing Survey Report
Table
Deloitte
View slide
The slide has a column chart showing SRU adjusted results in USD bn for 9M16 and 9M17, with segments for net revenues, pre-tax income, and operating expenses.
Financial Performance
Financial Services
This slide shows the reduction in pre-tax income drag on Group results from -2.5 bn to -1.5 bn, highlighting changes in net revenues and operating expenses.
pre-tax income, net revenues, operating expenses, income drag, financial results
false
SRU continues to reduce its pre-tax income drag on Group results…Credit Suisse Investor Day 2017
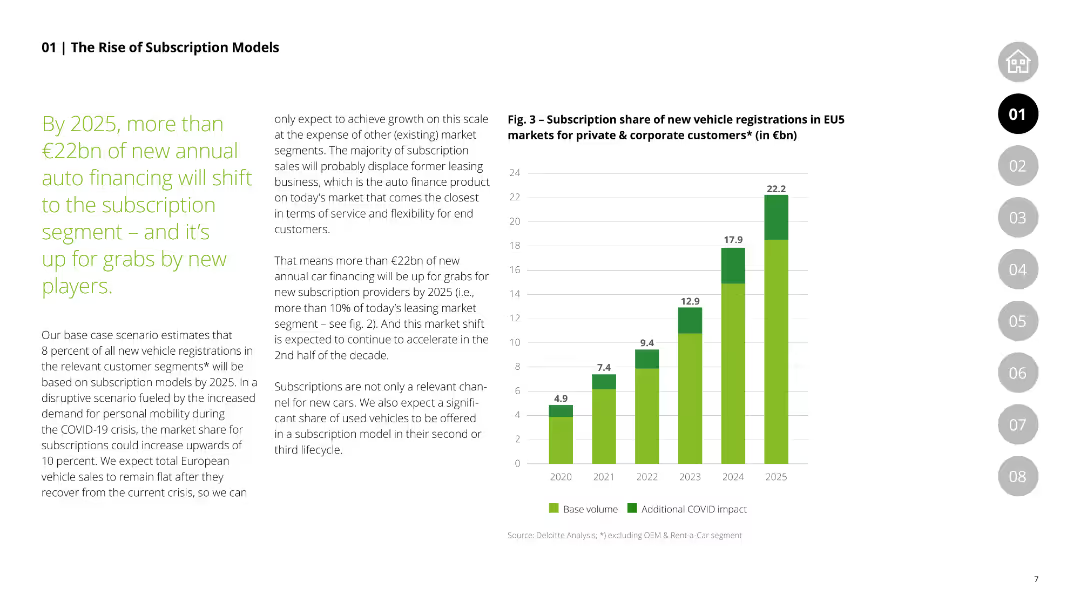
Single Chart
Credit Suisse
View slide
The slide shows a column chart projecting subscription share of new vehicle registrations in the EU5 markets for private and corporate customers from 2020 to 2025, highlighting the expected growth due to COVID-19 impact.
Market Analysis and Trends
Financial Services
Provides projections for the rise in subscription models in vehicle registrations in the EU5, emphasizing the impact of COVID-19 and the shift in market dynamics.
subscription models, vehicle registrations, EU5, market projection, COVID-19 impact
false
Fig. 3 – Subscription share of new vehicle registrations in EU5 markets for private & corporate customers* (in €bn)Vehicle-as-a-Service From vehicle ownership to usage-based subscription models
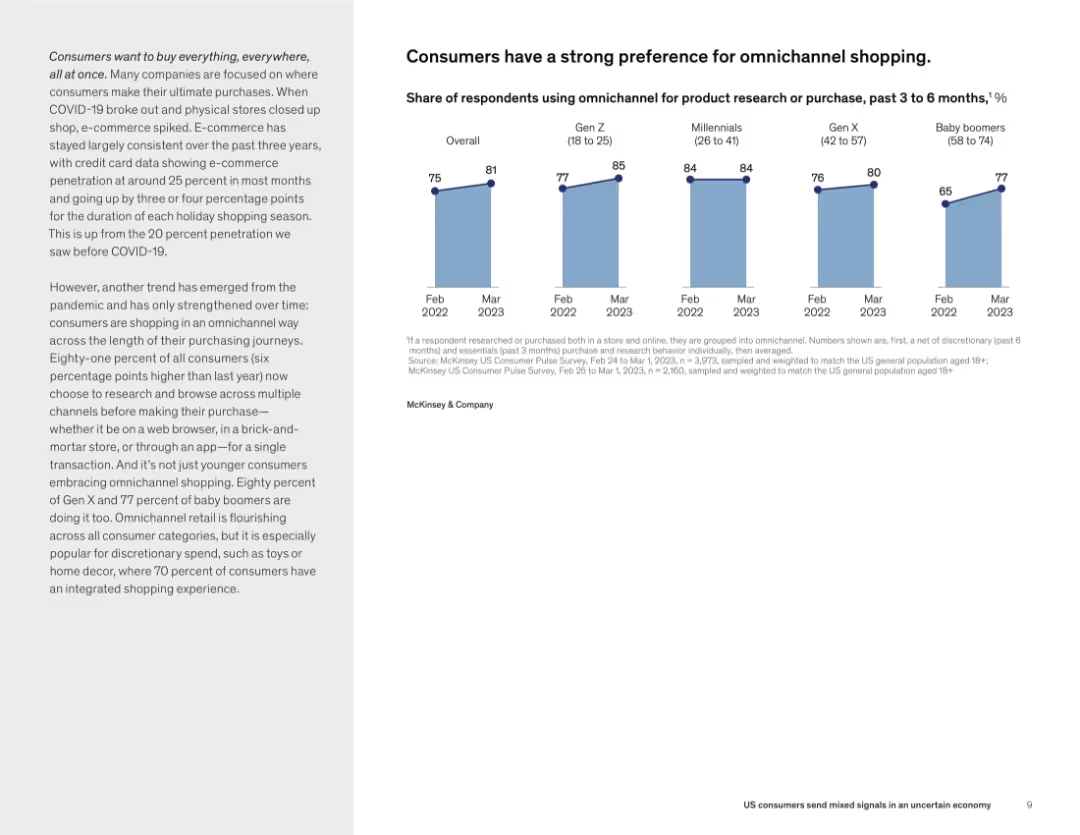
Mixed Chart
Deloitte
View slide
Side-by-side layout with text on the left and bar charts on the right. The bar charts show omnichannel usage trends across different generations from 2022 to 2023. The design uses soft blue tones with consistent data visualization styling.
Customer and Market Segmentation
Retail & E-commerce
This slide presents data on consumer preferences for omnichannel shopping, showing a clear upward trend across all age groups. It emphasizes the increased integration of online and offline channels for product research and purchases, especially for discretionary items. Omnichannel engagement rose from 75% to 81% overall from 2022 to 2023.
omnichannel, shopping behavior, Gen Z, Millennials, trends, retail
false
Consumers have a strong preference for omnichannel shoppingUS consumers send mixed signals in an uncertain economy
Mixed Chart
McKinsey
View slide
Slide includes multiple column charts presenting financial data like revenue CAGR and CET1 ratio development across various banking divisions.
Performance Metrics and KPIs
Financial Services
Analyzes Deutsche Bank’s key performance metrics such as revenue growth, cost/income ratio, and liquidity, comparing current data with previous fiscal years.
performance, revenue, financial metrics, banking, growth
false
Key performance indicators In % Revenue CAGR1 9M 2023 LTM vs FY 2021 Q3 2023 results
Multiple Chart
Deutsche Bank
View slide
Slide with column charts depicting dividend yield comparisons among peers and discussions on resiliency through market cycles in neutral and green colors.
Financial Performance
Energy & Utilities
Analyzes the dividend yield and total return metrics for Permian Resources compared to its peers, emphasizing resilience and growth potential in fluctuating markets.
dividends, financial benchmarks, Permian Resources, resiliency
false
Return of Capital Program BenchmarkingBarclays CEO Energy-Power Conference
Multiple Chart
Barclays
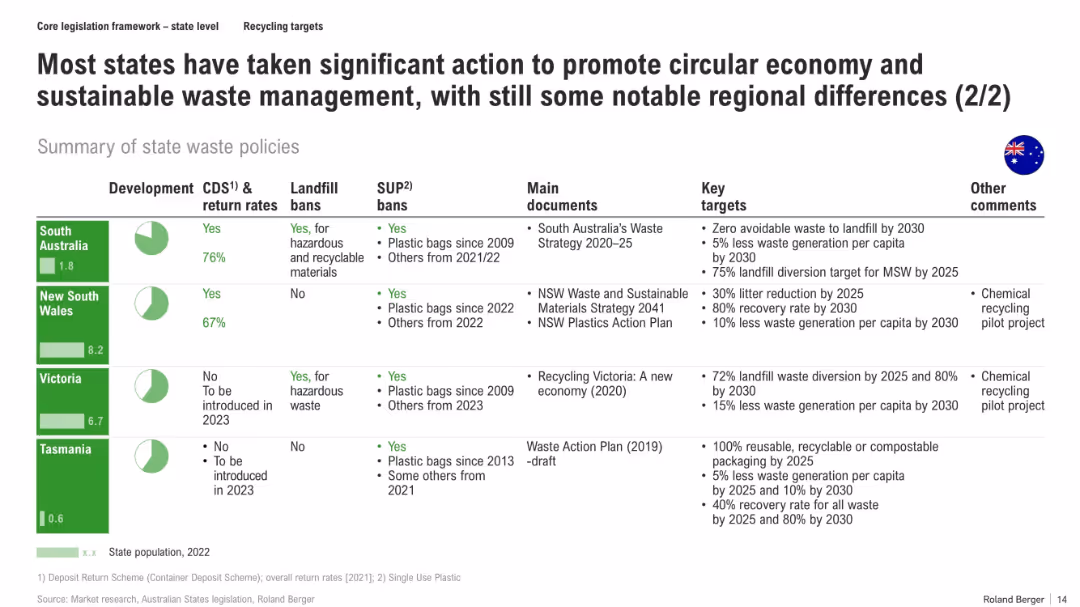
View slide
Tabular layout summarizing policies across four states with icons, colored headers, and key targets and comments for each
Regulatory and Compliance
Environmental Services & Sustainability
The slide summarizes waste management developments for South Australia, NSW, Victoria, and Tasmania, including CDS implementation, bans, strategic documents, and ambitious waste diversion/reduction targets. It highlights regional variations and the progressive steps each state has taken.
recycling targets, landfill bans, plastic bag bans, state policies, CDS, circular economy, Australia
false
Most states have taken significant action to promote circular economy and sustainable waste management, with still some notable regional differences (2/2)Aluminum Cans Market Assessment - Australia
Mixed Chart
Roland Berger
View slide
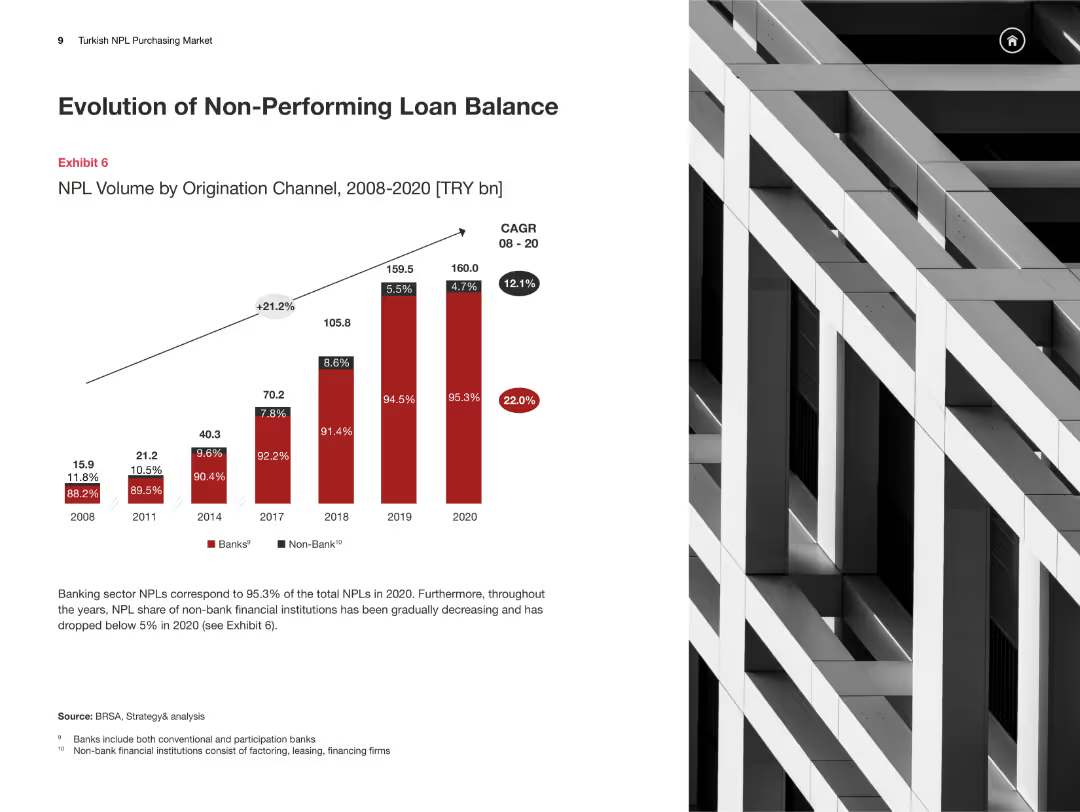
The slide includes a column chart showing the NPL volume by origination channel from 2008 to 2020, with a detailed explanation of the trends and market implications.
Risk Assessment and Management
Financial Services
This slide analyzes the evolution of non-performing loans (NPLs) in the Turkish banking sector, focusing on the changes in NPL volumes by origination channel over time.
Non-Performing Loans, NPL, Turkey, Origination Channel, Risk Assessment
false
Evolution of Non-Performing Loan BalanceTurkish NPL Purchasing Market Overview and the way forward
Mixed Chart
PwC/Strategy&
View slide
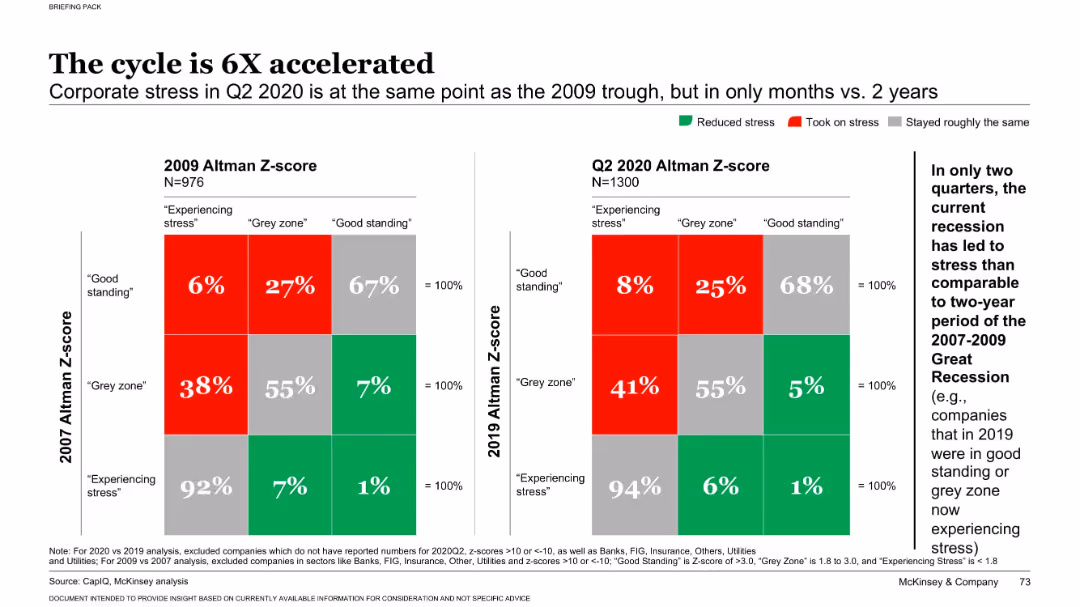
Dual heatmap chart comparing Altman Z-scores from 2009 vs. 2020 with labeled stress categories
Risk Assessment and Management
Financial Services
This slide shows how rapidly corporate financial stress increased during the COVID-19 recession compared to the 2008 crisis. It uses Altman Z-scores to classify companies' financial health, revealing a sharp acceleration in stress levels across firms.
Altman Z-score, financial stress, recession, corporate risk, COVID-19
false
The cycle is 6X acceleratedCOVID-19: Briefing materials
Multiple Chart
McKinsey
View slide
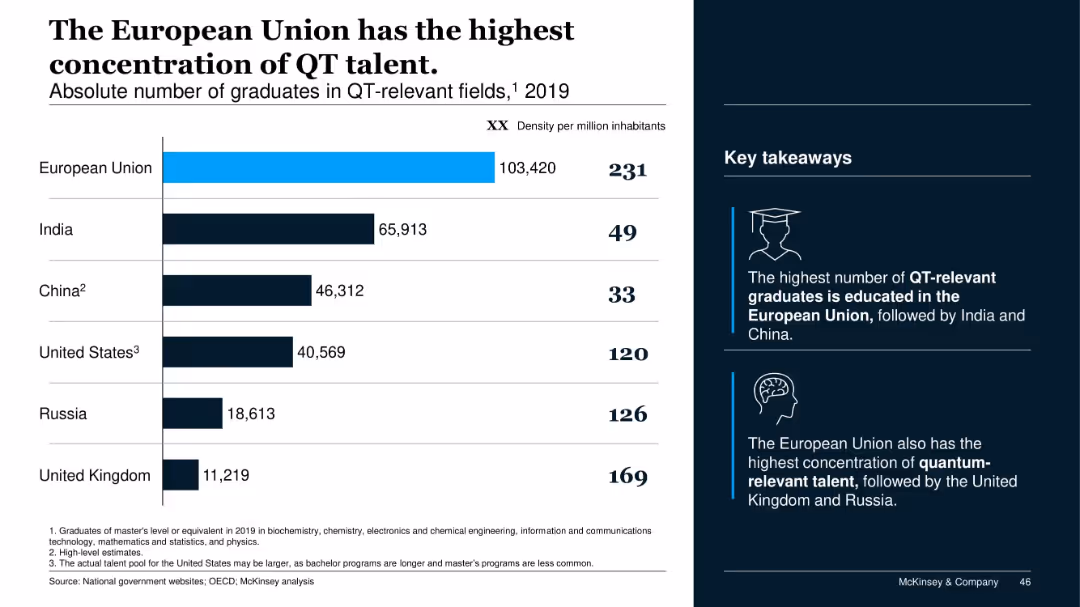
Bar chart showing number of graduates in QT-relevant fields (2019) across countries; dual axis with total graduates and density per capita.
Human Resources and Talent Management
Education & Training
The slide highlights the European Union's leadership in quantum technology education, both in absolute graduates and talent density. The UK, US, and Russia also show strong concentrations relative to population.
QT graduates, education, talent pool, EU, quantum technology, workforce, talent density
false
The European Union has the highest concentration of QT talent.Quantum Technology Monitor June 2022
Mixed Chart
McKinsey
View slide
Content slide with three icons and descriptions: Person-Level, In-Session, and Modernized. Each section details different aspects of CTV ad optimization.
Technology and Digital Transformation
Media & Entertainment
Describes the unique features of Nielsen Streaming Signals, focusing on person-level optimization, session data, and modern privacy measures.
CTV, ad optimization, Nielsen, person-level, in-session, modernized
false
Only Nielsen Streaming Signals can provideSpring 2022 National Client Meeting
Header Vertical
Nielsen
View slide
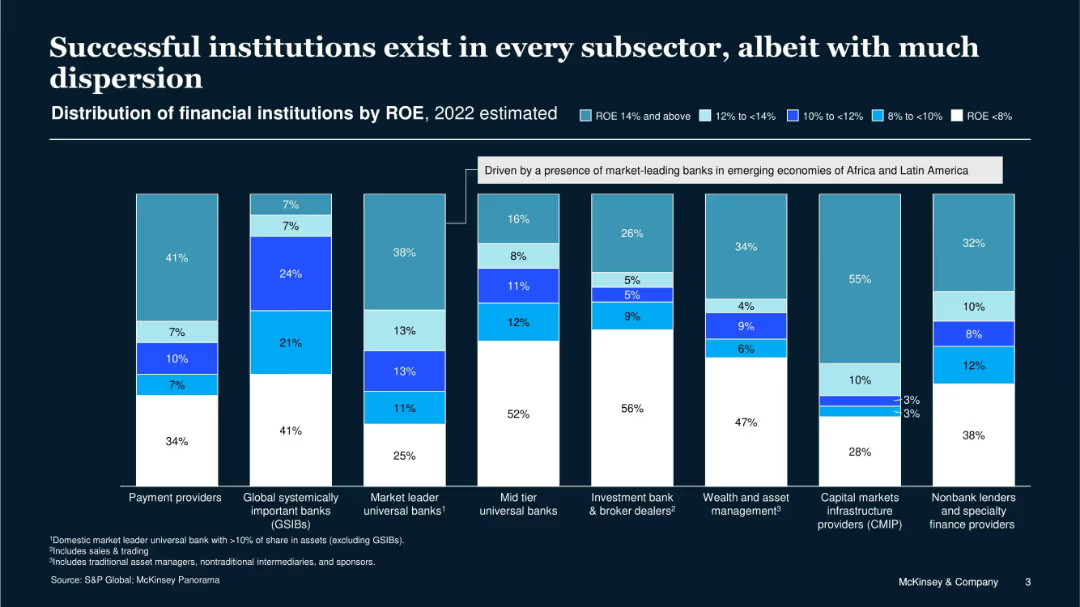
Vertical stacked bar charts showing ROE distribution across financial institution types in 2022; color-coded by ROE range.
Performance Metrics and KPIs
Financial Services
The slide shows ROE variation across financial subsectors, indicating that success is achievable in all categories despite wide dispersion. Certain segments like payment providers and nonbank lenders show high profitability, emphasizing the importance of strategic positioning.
ROE, financial institutions, profitability, dispersion, KPIs, subsectors, 2022, success
false
Successful institutions exist in every subsector, albeit with much dispersionGlobal Banking Annual Review 2023
Single Chart
McKinsey
View slide
Displays a pie chart of sales distribution by product type, along with multiple product images with associated pricing, categorized into 'Base', 'Value up', and 'Premiumization'.
Product and Service Analysis
Consumer Goods
Provides a comparative analysis of Nestlé's product offerings by price segmentation, illustrating potential areas for value enhancement and premium product strategies. Ideal for discussing pricing strategies and market differentiation.
product analysis, pricing strategy, sales distribution, premium products, market differentiation
false
3 Growth by choice: capture value-up opportunitiesDeutsche Bank 2023 Leveraging emerging market opportunities
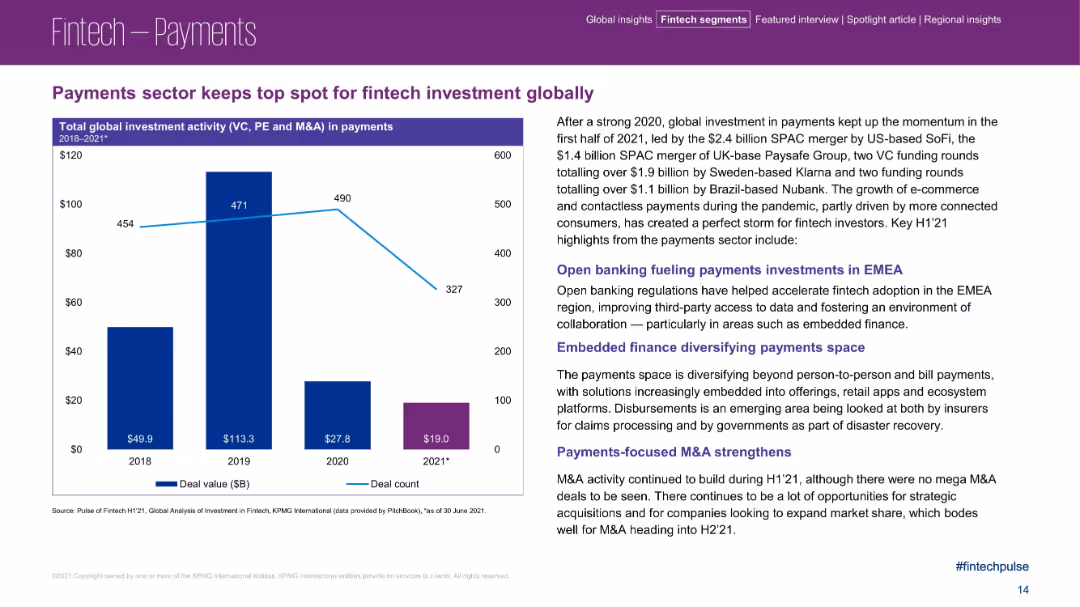
Mixed Chart
Deutsche Bank
View slide
Left side has a bar chart; right side contains text-heavy analysis with highlighted headings.
Product and Service Analysis
Financial Services
This slide focuses on payments remaining the top sector in global fintech investment through early 2021. It covers major funding rounds, SPAC activity, and strategic themes such as open banking, embedded finance, and M&A trends fueling investor interest.
payments sector, fintech investment, open banking, embedded finance, SPAC, M&A
false
Payments sector keeps top spot...Pulse of Fintech H1’21
Mixed Chart
KPMG
View slide
A split layout detailing strategies to adapt to digital consumer behavior on the left, and on the right, statistics on e-commerce growth are presented in column charts.
Market Analysis and Trends
Technology & Software
The slide discusses strategies for businesses to adapt to digital trends and consumer behaviors, with e-commerce statistics to back up claims. It could be used for market analysis and planning.
digital trends, consumer behavior, e-commerce growth, market analysis, business strategy
false
Explore the digital awakeningKEEP MOVING FORWARD
Boxed
JP Morgan
View slide
Two column charts show Eaton's segment operating margin and sales from 2000 to 2018, across different business divisions like Electrical Products and Hydraulics.
Financial Performance
Technology & Software
Tracks profitability changes in Eaton’s various business divisions over nearly two decades, useful for financial analysis and strategy planning.
Eaton, profitability, sales, financial analysis
false
This transformation adds to a long track record of improving profitability…Deutsche Bank Global Industrials & Materials
Multiple Chart
Deutsche Bank
View slide
This slide presents bar charts comparing marketing budget allocation for customer experience across different company sizes and revenues, with a clear, structured layout.
Market Analysis and Trends
Professional Services
It examines the allocation of marketing budgets towards customer experience initiatives, segmented by company size and revenue, offering strategic insights.
customer experience, marketing, budget, analysis
false
Medium sized firms in terms of employees and revenue most likely to spend more marketing budget on customer experienceThe CMO Survey The Highlights and Insights Report February 2022
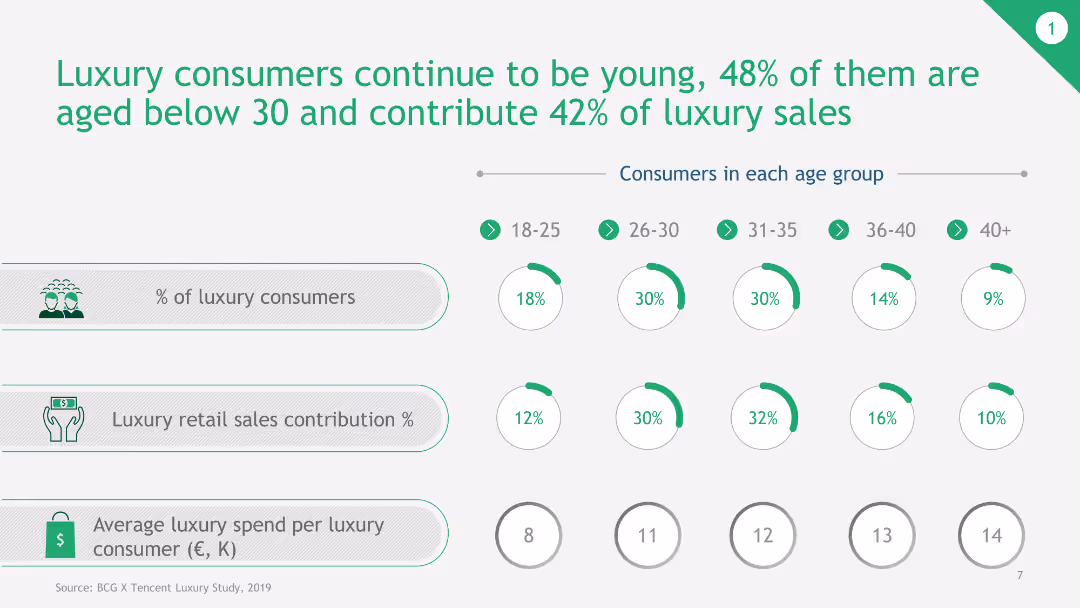
Multiple Chart
Deloitte
View slide
The slide features circular data visuals and icons to represent age groups, percentages of luxury consumers, and sales contributions. Predominantly green and white color scheme.
Customer and Market Segmentation
Consumer Goods
This slide presents data on the age distribution of luxury consumers and their contributions to luxury sales, highlighting that a significant portion is under 30 years old.
Age Distribution, Luxury Consumers, Sales Contribution, Young Consumers, Market Analysis
false
Luxury consumers continue to be young, 48% of them are aged below 30 and contribute 42% of luxury salesChina Luxury Digital Playbook
Multiple Chart
BCG
View slide
Textual content and comparative data visualizations with maps. Shows the number of unicorns in Asia Pacific countries and outlines the initiatives of China, India, South Korea, and Japan to fulfill digital imperatives.
Industry Overview
Government & Public Sector
Compares the progress of prominent Asian countries in developing their digital ecosystems. Discusses initiatives and policies implemented to push for a flourishing digital economy, useful for understanding competitive positioning and the race to achieve key digital imperatives.
Digital Ecosystem, Unicorns, Asia Pacific, China, India, South Korea, Japan, Policy, Digital Economy, Competitiveness
false
Prominent countries with flourishing digital ecosystem are pushing to achieve key imperatives.Unlocking the next wave of digital growth: beyond metropolitan Indonesia
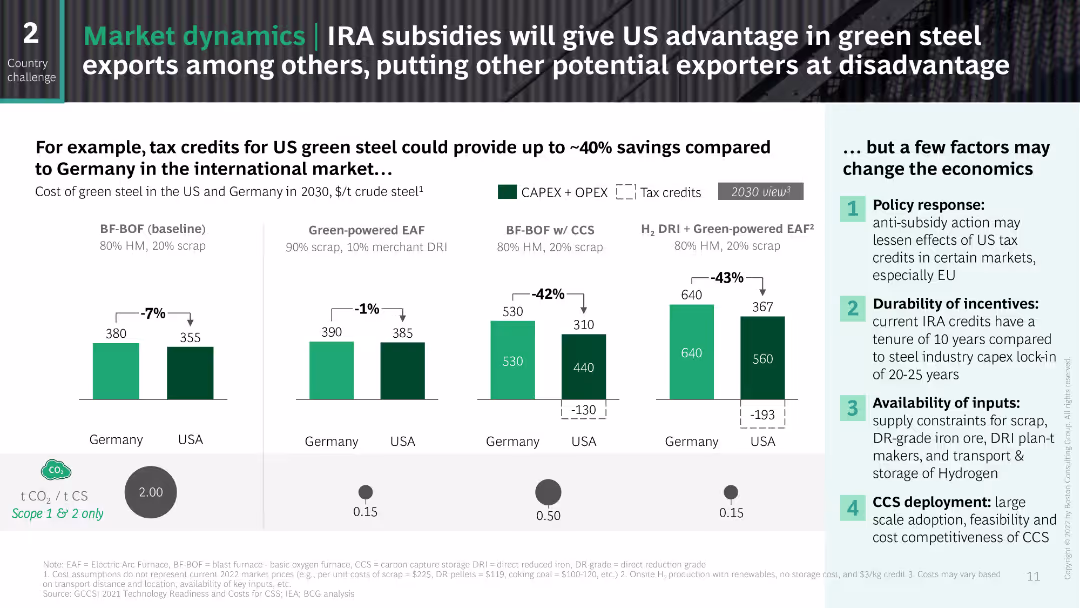
Single Chart
Kearney
View slide
The slide uses a side-by-side comparison format to illustrate the cost differences between green steel production in the US and Germany. It includes column charts with cost breakdowns and a section on potential economic factors affecting these costs. The design is clear and data-focused.
Financial Performance
Industrial & Manufacturing
This slide compares the potential cost savings of US green steel exports versus German green steel, considering the impact of IRA subsidies and highlighting factors that may affect these economics, such as policy responses and input availability.
green steel, IRA, subsidies, cost comparison, US, Germany
false
Market dynamics | IRA subsidies will give US advantage in green steel exports among others, putting other potential exporters at disadvantageUS Inflation Reduction Act: Global Implications
Multiple Chart
BCG
View slide
This slide presents a column chart that breaks down the LCOH for a PEM electrolyzer, with electricity being the largest cost component.
Market Analysis and Trends
Energy & Utilities
The slide shows the breakdown of LCOH costs for a PEM electrolyzer, emphasizing the significant impact of electricity costs on overall expenses.
LCOH, electrolyzer, PEM, electricity costs, capex
false
LCOH breakdown - PEM exampleHydrogen applications and business models
Single Chart
Kearney
View slide
Featuring a line graph of search trends for Germany related to Singapore's travel announcements, this slide marks significant increases with an accent color. It includes sidebar bullet points discussing expected leisure travel demand, changing consumer behaviors, and the importance of flexibility and safety in travel offerings.
Market Analysis and Trends
Hospitality & Tourism
This slide presents an optimistic view on the recovery of the travel sector, suggesting a rapid rebound driven by pent-up demand and a shift in consumer travel behaviors, as demonstrated by the spike in search interest following Singapore's introduction of the Vaccinated Travel Lane (VTL) with Germany.
travel recovery, search trends, consumer demand, COVID-19, vaccinated travel, Singapore, Germany, industry analysis, consumer behavior
false
Travel likely to see a swift recovery once travel restrictions easee-Conomy SEA 2021 Roaring 20s: The SEA Digital Decade
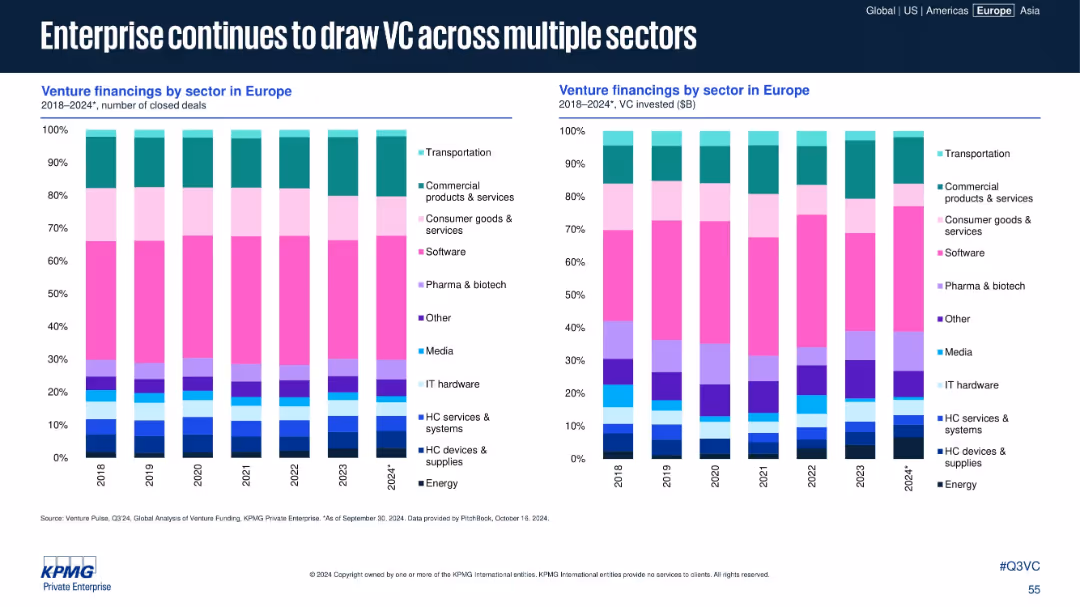
Mixed Chart
Bain
View slide
Two stacked bar charts showing sector-wise financing by deal count and VC dollars invested from 2018–2024
Customer and Market Segmentation
Technology & Software
This slide analyzes the distribution of VC investment across sectors in Europe. Enterprise-focused sectors such as software, commercial services, and transportation attract consistent investment, highlighting sustained sector interest.
enterprise, VC sector, software, biotech, transportation, deal count
false
Enterprise continues to draw VC across multiple sectorsVenture Pulse Q3 2024
Multiple Chart
KPMG
View slide
Lists eight domains where the state supports hydrogen industry development, each represented with an icon and a brief description, including strategy, infrastructure, and R&D.
Regulatory and Compliance
Government & Public Sector
Details the support mechanisms the Chilean government provides for the hydrogen industry, covering strategic vision, regulatory frameworks, and incentives, aiming to foster industry growth and sustainability.
government, support, hydrogen, infrastructure
false
The state will support the development of the industry taking action in 8 domainsChilean Hydrogen Pathway
Table
McKinsey
View slide
Featuring a mixture of column charts and stacked bar graphs, this slide presents AWM client assets, NAV, and net returns for various alternative investment options over several years. The data is segmented by asset type and performance against benchmarks.
Investment Analysis
Financial Services
This slide reviews the growth and scaling of alternative investments, presenting data on net asset value and returns compared to benchmarks. Useful for investor meetings or strategic reviews focusing on diversification and alternative investment strategies.
alternatives, investment, growth, benchmarks, net asset value
false
Key investment #3: Building AlternativesAsset & Wealth Management 2022
Multiple Chart
JP Morgan
View slide
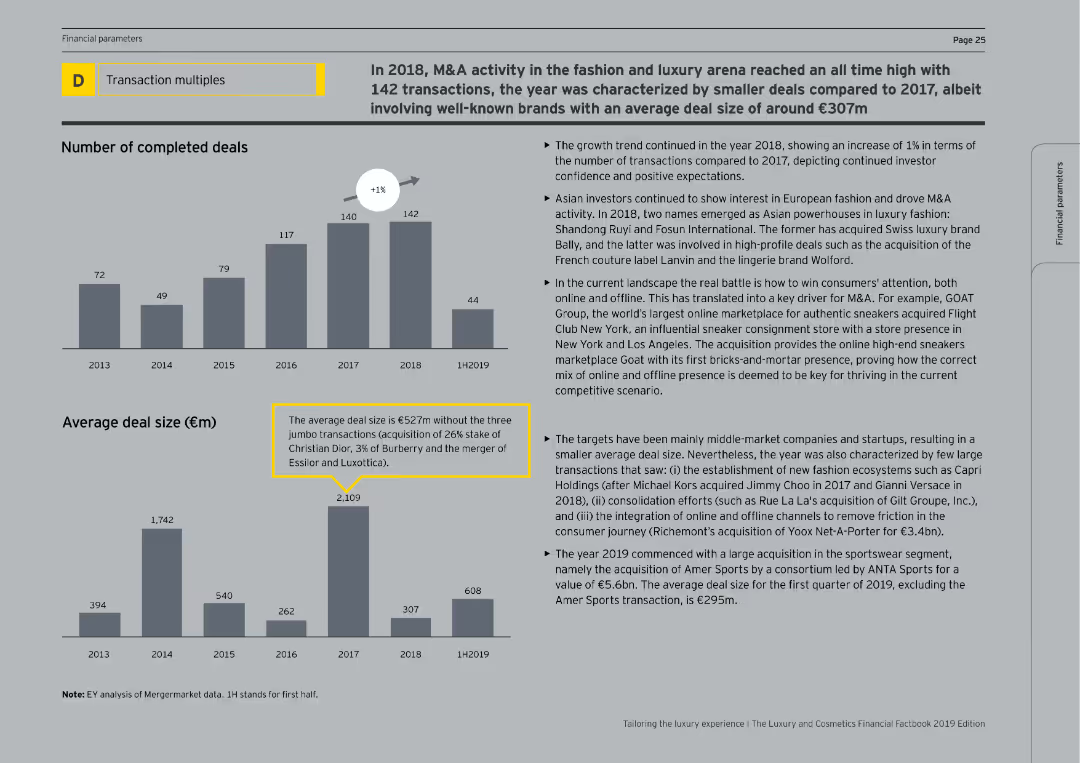
The slide includes a column chart showing the number of completed deals from 2013 to 1H2019 and average deal sizes. The text on the right provides an analysis of M&A trends, with a focus on smaller deal sizes and high-profile acquisitions.
Mergers and Acquisitions
Consumer Goods
The slide details the record-high M&A activity in 2018 within the fashion and luxury sectors, emphasizing the number of transactions, average deal sizes, and notable acquisitions. It also discusses the trends driving this activity, including the focus on smaller, high-value brands.
M&A, Fashion, Luxury, Deals, Acquisitions
false
In 2018, M&A activity in the fashion and luxury arena reached an all time high with 142 transactionsTailoring the luxury experience The Luxury and Cosmetics Financial Factbook 2019 Edition
Multiple Chart
EY
View slide
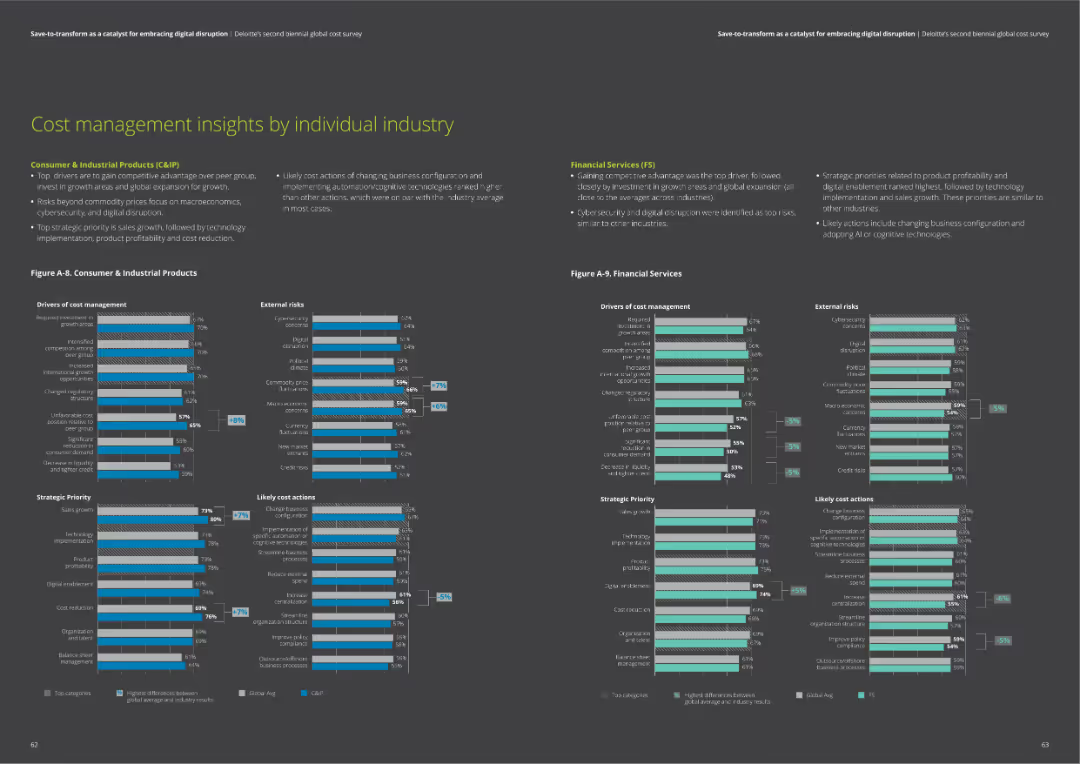
The slide contains two column charts comparing drivers of cost management, external risks, strategic priorities, and likely cost actions for Consumer & Industrial Products and Financial Services sectors.
Market Analysis and Trends
Financial Services
Insights on cost management, including drivers, risks, priorities, and actions for Consumer & Industrial Products and Financial Services. Helps understand industry-specific trends.
cost management, industry insights, risks, priorities, actions
false
Cost management insights by individual industrySave-to-transform as a catalyst for embracing digital disruption Deloitte’s second biennial global cost survey
Multiple Chart
Deloitte
View slide
Horizontal stacked bar chart of countries showing belief that their country is in decline; includes historical agreement percentages by year.
Market Analysis and Trends
Government & Public Sector
Ranks countries by belief in national decline; South Africa, Netherlands, and Sweden top the list. Year-over-year data from 2016 to 2023 shows dynamic shifts.
country trends, decline sentiment, Ipsos, longitudinal, public opinion, country comparison
false
[Country] is in declineIPSOS POPULISM SURVEY
Mixed Chart
IPSOS
View slide
A column chart showing the concern levels about online privacy across different regions, with a focus on the percentages of very concerned and somewhat concerned.
Risk Assessment and Management
Technology & Software
The slide highlights global concerns about online privacy, comparing regions such as LATAM, Middle East, APAC, and Europe.
column chart, online privacy, concern, regions, survey, global
false
Across all regions, most have at least some degree of concern when it comes to their online privacyMARKET DATA FROM SECONDARY SOURCES
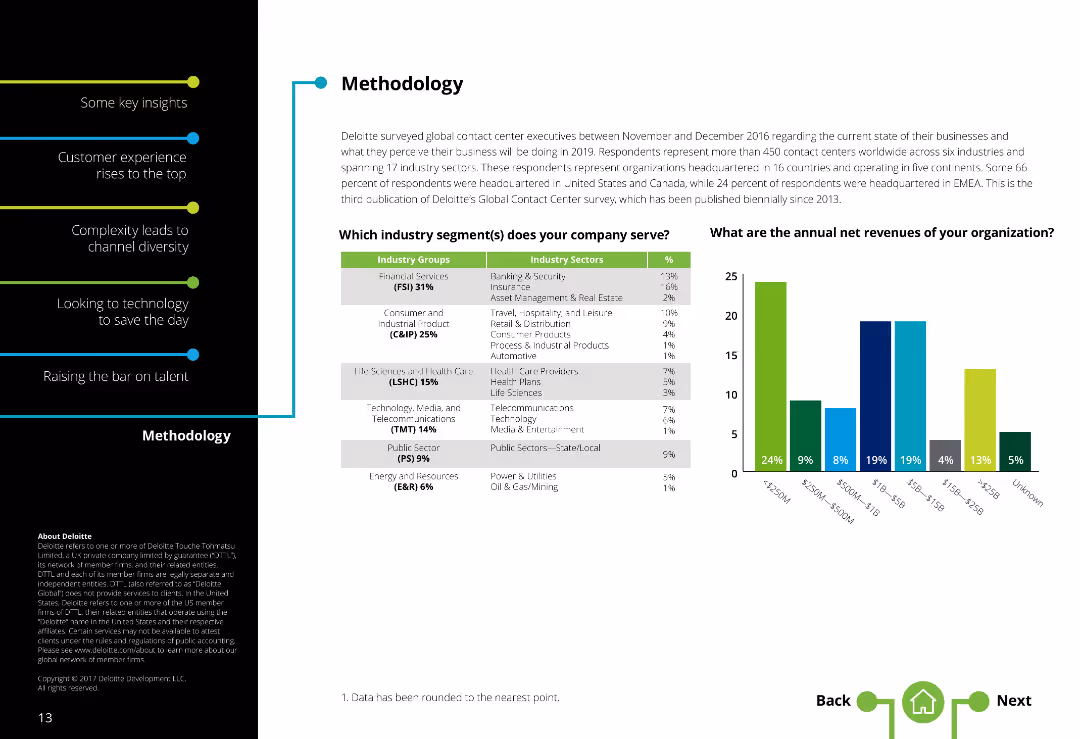
Single Chart
IPSOS
View slide
Two-column layout with text on the left and a table along with a column chart on the right. Text is moderately dense.
Market Analysis and Trends
Professional Services
Provides an overview of the survey methodology, including industry segments served and annual net revenues of respondent organizations.
Methodology, Survey, Industry segments, Contact centers, Annual revenues, Respondent demographics
false
Deloitte surveyed global contact center executives between November and December 2016 regarding the current state of their businesses and what they perceive their business will be doing in 2019.Global Contact Center Survey
Mixed Chart
Deloitte
View slide
Demographics infographic, statistical representations, and a purple and white theme.
Industry Overview
Technology & Software
The slide shows survey demographics, highlighting the representation of various high-tech industries and geographic distribution. This could be used in presentations analyzing market trends, industry representation, or for setting the context in a broader industry analysis discussion.
Survey, Demographics, High Tech, Industries, Geographic Distribution, Market Trends, Analysis, Context, Representation
false
Survey demographicsTransforming the Industry that transformed the World: 02 Expand industry boundaries
Multiple Chart
Accenture
View slide
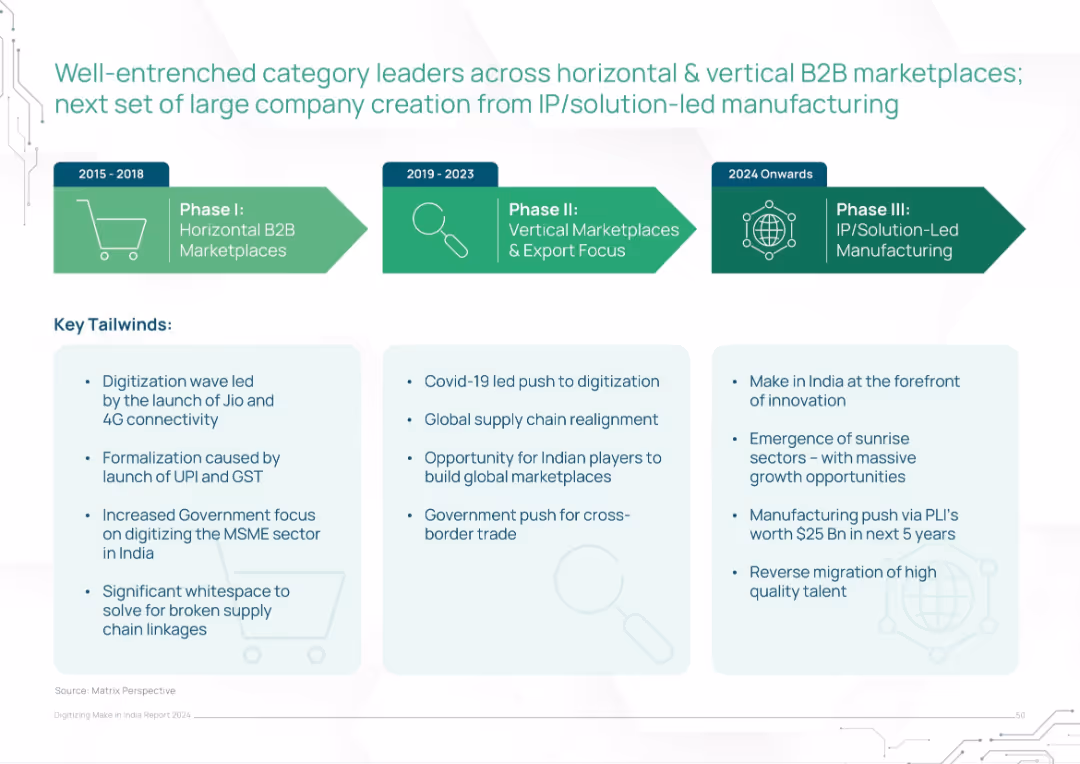
Horizontal timeline across three phases (2015–2024 onwards) with bullet points on key tailwinds underneath
Strategic Planning
Technology & Software
The slide presents a phased evolution of India’s B2B marketplace development, moving from horizontal platforms to IP-driven manufacturing. It identifies key enabling factors like digitization, GST/UPI formalization, Covid-related shifts, and emerging innovation-led sectors. Tailwinds are categorized by era and strategic influence.
B2B, marketplaces, India, digitization, UPI, IP-led, MSME, government policy, manufacturing evolution
false
Well-entrenched category leaders across horizontal & vertical B2B marketplaces; next set of large company creation from IP/solution-led manufacturingDigitizing Make in India Report 2024
Pillar
BCG
View slide
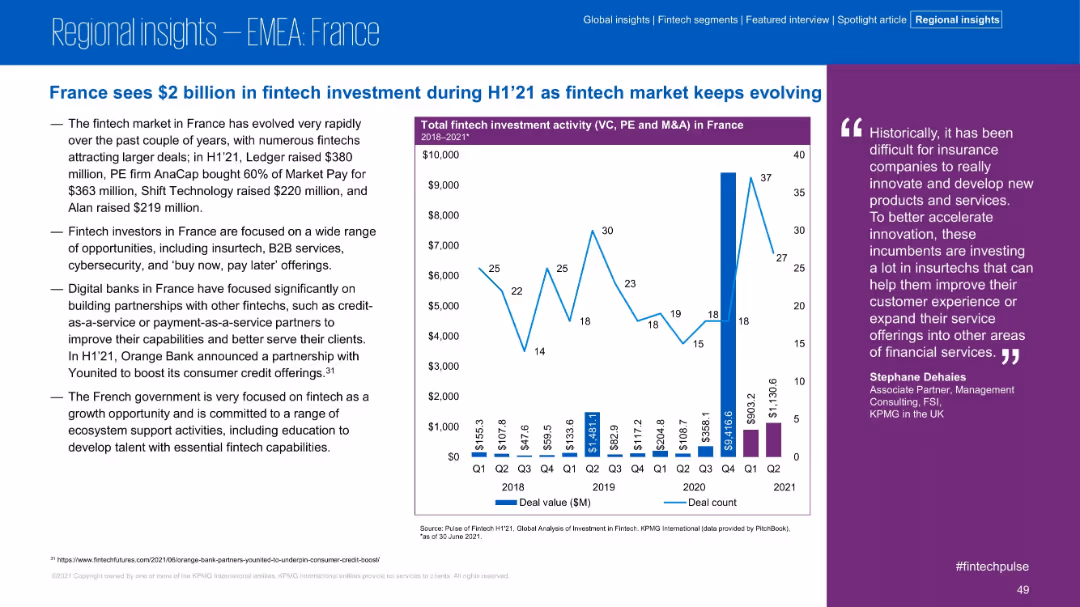
Text-heavy left panel and right-aligned investment trend chart; quote in purple column; professional and clear design.
Market Analysis and Trends
Financial Services
Fintech investment in France reached $2B in H1 2021, with multiple large deals and focus on insurtech, B2B services, and digital banks. The government’s support and emphasis on ecosystem development are also highlighted.
France, Fintech, H1 2021, Digital Banking, Insurtech, Investment, B2B, Government Support
false
France sees $2 billion in fintech investment during H1’21 as fintech market keeps evolvingPulse of Fintech H1’21
Mixed Chart
KPMG
View slide
A stacked column chart and pie chart slide with a segmented breakdown of revenue by region and business lines. Blue and brown hues denote different business areas.
Market Analysis and Trends
Financial Services
Showcases a financial firm’s revenue diversification and scale of operations, reflecting robust business performance across regions and services.
revenue, diversification, global, scale, financial, operations, performance, analysis
false
Our complete, global, diversified and at scale franchise delivers for clients in all environments…Firm Overview 2022
Mixed Chart
JP Morgan
View slide
This slide displays a column chart with four bars representing completed M&A activity in emerging private education markets from 2002 to 2013, labeled with "n" numbers indicating the count of deals. There's a title at the top and a table below showing global deals totals.
Investment Analysis
Education & Training
The slide is used to present M&A activity trends in Asian education, highlighting a substantial increase in completed deals over four specified periods, from 2002-2004 to 2011-2013. The upward trend suggests growing investor interest in the sector.
M&A, Education, Asia, Trend, Increase, Deals, Private, Investor Participation, Exponential, Decade
false
The last decade has witnessed an exponential increase in investor participation in Asian EducationInvesting in Asian Education: Opportunities and Challenges
Single Chart
EY
View slide
A combination of cycle diagrams and column charts, this slide showcases financial growth metrics, such as sales volume and net revenue. It's visually balanced with clear demarcations between different sections and graphical elements.
Financial Performance
Financial Services
The slide describes the growth strategy and financial performance of a card franchise, with a focus on scaling, engaging, and deepening customer relationships. It’s intended for illustrating successful financial strategies and growth patterns within the industry.
Card franchise, Industry position, Sales volume, Net revenue, Financial growth, Strategy implementation
false
Our Card franchise has an industry leading position in sales and outstanding balancesCONSUMER & COMMUNITY BANKING
Multiple Chart
JP Morgan
View slide
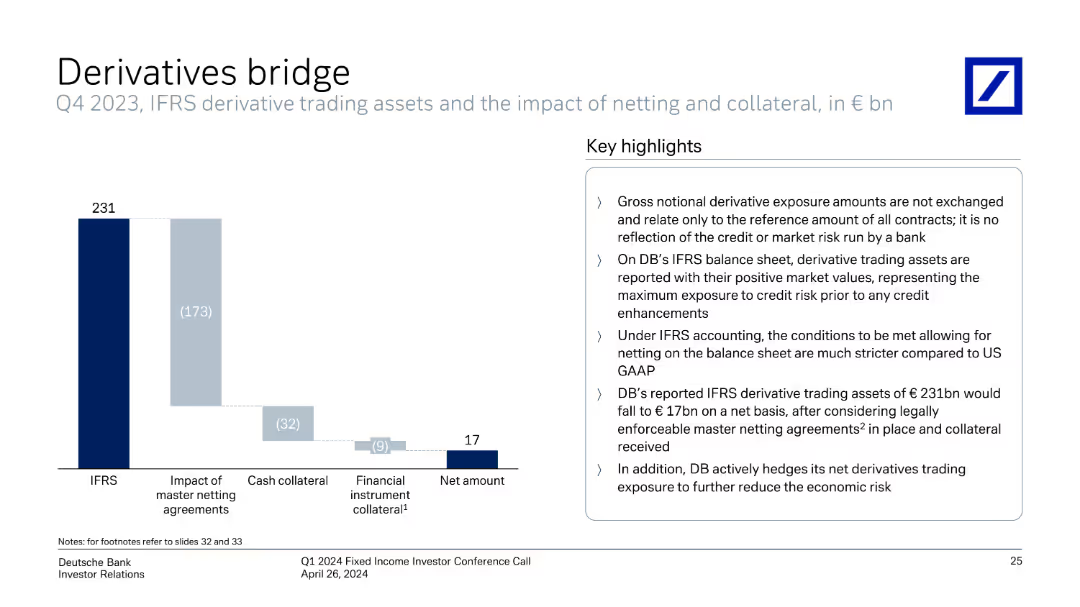
Column chart showing IFRS derivative trading assets and net amounts with key highlights on the right.
Risk Assessment and Management
Financial Services
Explains the impact of netting and collateral on derivative trading assets, highlighting the gross and net amounts reported under IFRS.
derivatives, IFRS, trading assets, netting, collateral, exposure, financial reporting
false
Derivatives bridge Q4 2023, IFRS derivative trading assets and the impact of netting and collateral, in € bnQ1 2024 Fixed Income Investor Conference Call
Mixed Chart
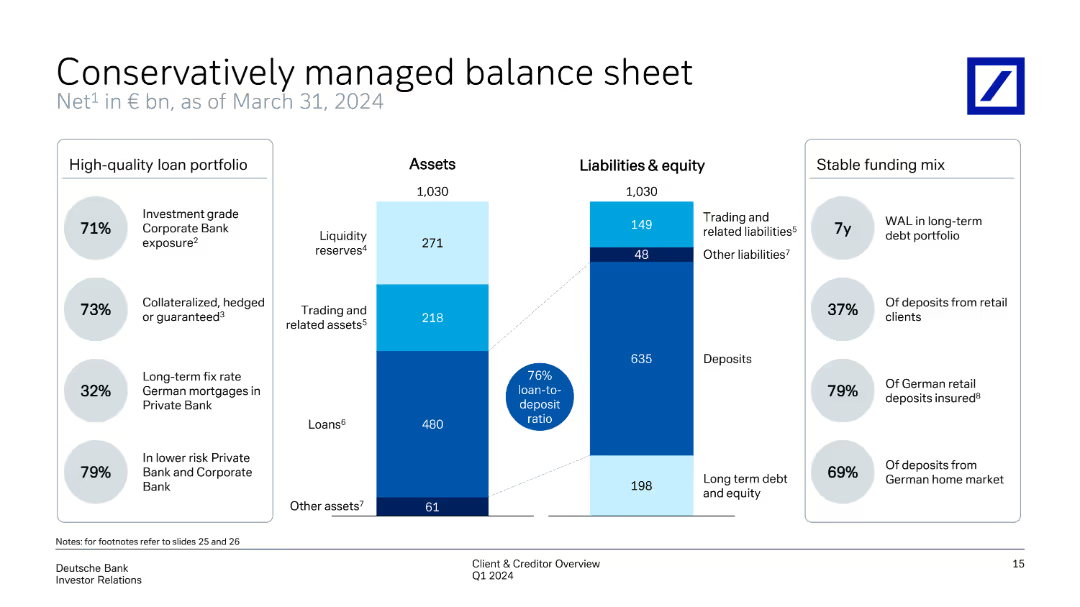
Deutsche Bank
View slide
The slide displays a divided column chart representing assets and liabilities & equity as of March 31, 2024. The left side includes a high-quality loan portfolio with percentages, while the right side shows a stable funding mix with key percentages.
Risk Assessment and Management
Financial Services
Highlights the bank's managed balance sheet, detailing asset distribution and liabilities, alongside a stable funding mix. The slide underscores high-quality loan portfolio and the overall balance between assets and liabilities, ensuring financial stability.
balance sheet, assets, liabilities, loan portfolio, funding mix
false
Conservatively managed balance sheet Net1 in € bn, as of March 31, 2024Client & Creditor Overview May, 2024
Multiple Chart
Deutsche Bank
View slide
The slide includes a title at the top, text on the left, and a column chart on the right, comparing market share growth among all entrants, finalists, and winners.
Financial Performance
Consumer Goods
Discusses market share growth among winners, finalists, and all entrants in a marketing context. Provides data from Effie 2020 entries showing 57% market share growth for winners.
Market Share, Winners, Growth, Marketing, Data
false
Market share gain is most likely to be claimed by winners2020 Effie UK Report • In partnership withIpsos
Mixed Chart
IPSOS
View slide
Bar chart with multiple bars in two colors showing various uses of HR data such as payroll, recruitment, and performance monitoring, with the highest use for standard data at 90%.
Human Resources and Talent Management
Professional Services
The slide illustrates common applications of HR data in organizations, emphasizing heavy use for standard operations like payroll and leave management.
HR data, payroll, recruitment, performance, bar chart
false
Uses of HR dataHR Pulse Survey Presentation of results
Single Chart
PwC/Strategy&
View slide
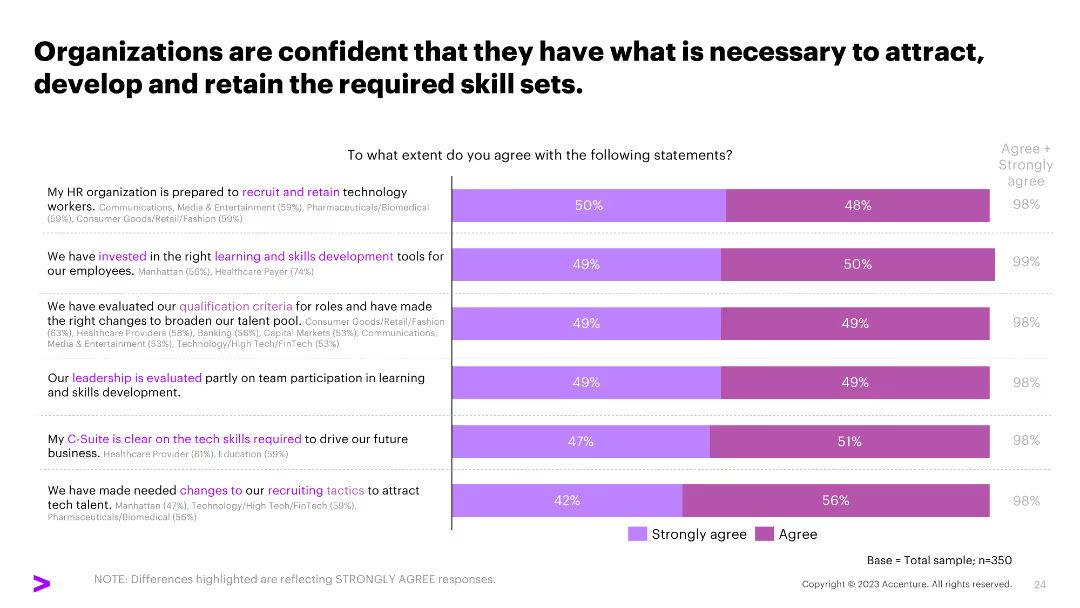
A column chart showing agreement levels on various HR practices, such as recruitment, skills development, and leadership evaluation, with percentages for each.
Human Resources and Talent Management
Professional Services
The slide shows how organizations agree on their capability to attract, develop, and retain required skill sets, emphasizing effective HR practices.
HR practices, skills development, recruitment, leadership evaluation
false
Organizations are confident that they have what is necessary to attract, develop and retain the required skill sets.Tech Talent Hiring Trends Survey
Mixed Chart
Accenture
View slide
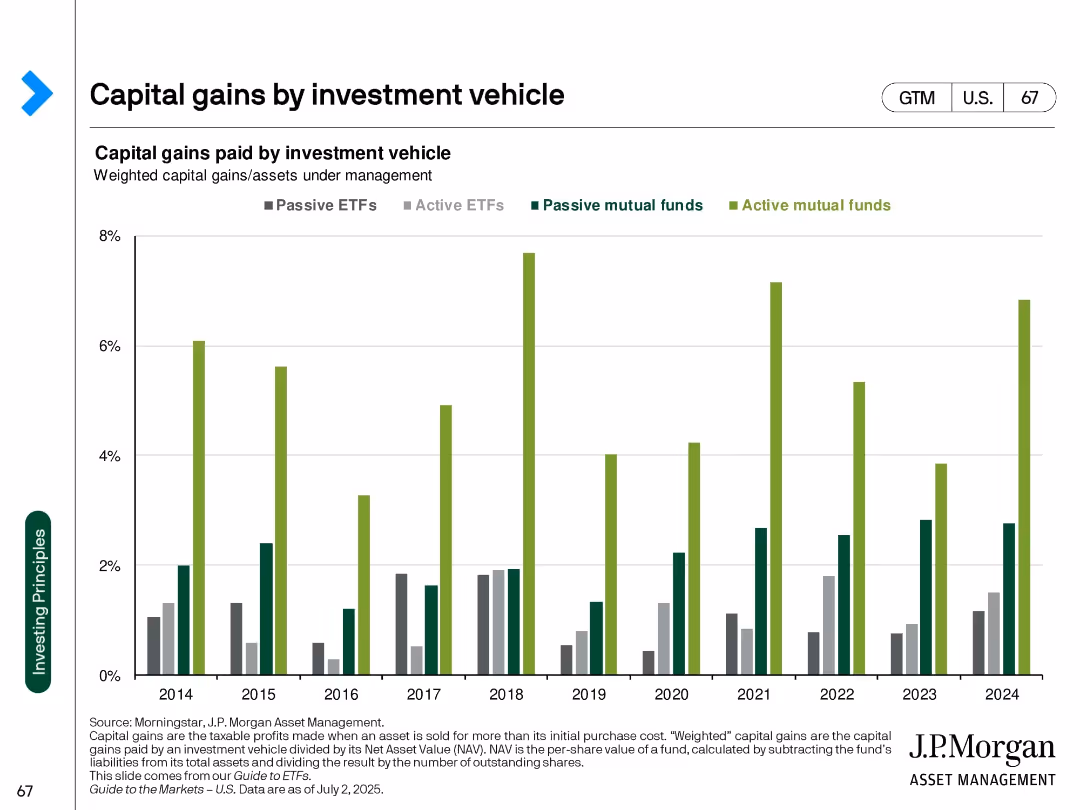
Clustered bar chart over years by vehicle type (ETFs, mutual funds) with color differentiation
Regulatory and Compliance
Financial Services
Compares capital gains distributions across investment vehicle types from 2014 to 2024. Active mutual funds show consistently higher capital gains than ETFs, indicating greater tax inefficiency.
capital gains, ETFs, mutual funds, tax efficiency, investment vehicles, fund structure, tax impact
false
Capital gains by investment vehicleGuide to the Markets U.S. 3Q 2025
Single Chart
JP Morgan
View slide
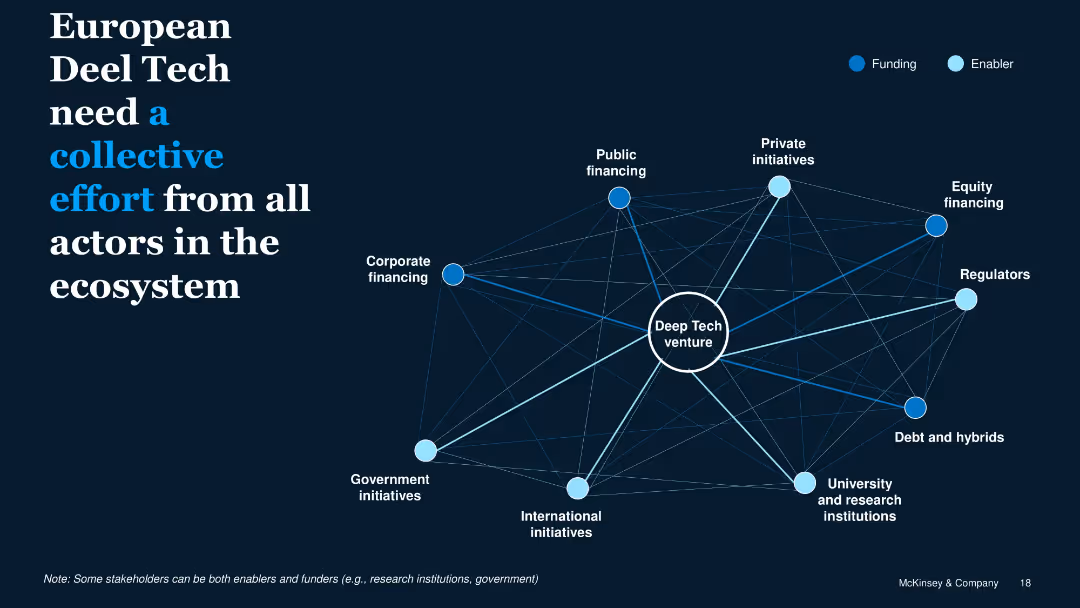
Network diagram with central Deep Tech node and surrounding ecosystem players categorized by Funding or Enabler
Organizational Structure and Change
Technology & Software
Emphasizes that successful Deep Tech ventures require coordinated actions among funding bodies (e.g., corporates, public finance) and enablers (e.g., regulators, universities), creating a connected innovation ecosystem.
ecosystem, collaboration, Deep Tech, funding, enablers, stakeholders
false
European Deel Tech need a collective effort from all actors in the ecosystemEuropean Deep Tech – Opportunities and Discoveries
Framework
McKinsey
View slide
A slide with blue column chart bars showing Chase Travel sales volume over time, with additional details on marketplace strategies and acquisitions.
Financial Performance
Technology & Software
Projects growth in consumer travel, discussing marketplace strategies and highlighting the value of recent acquisitions.
travel sales, growth projection, marketplace strategy, acquisitions, premium customers, Chase
false
We estimate we are a top 5 consumer travel provider 1 and will continue to growConsumer & Community Banking
Mixed Chart
JP Morgan
View slide
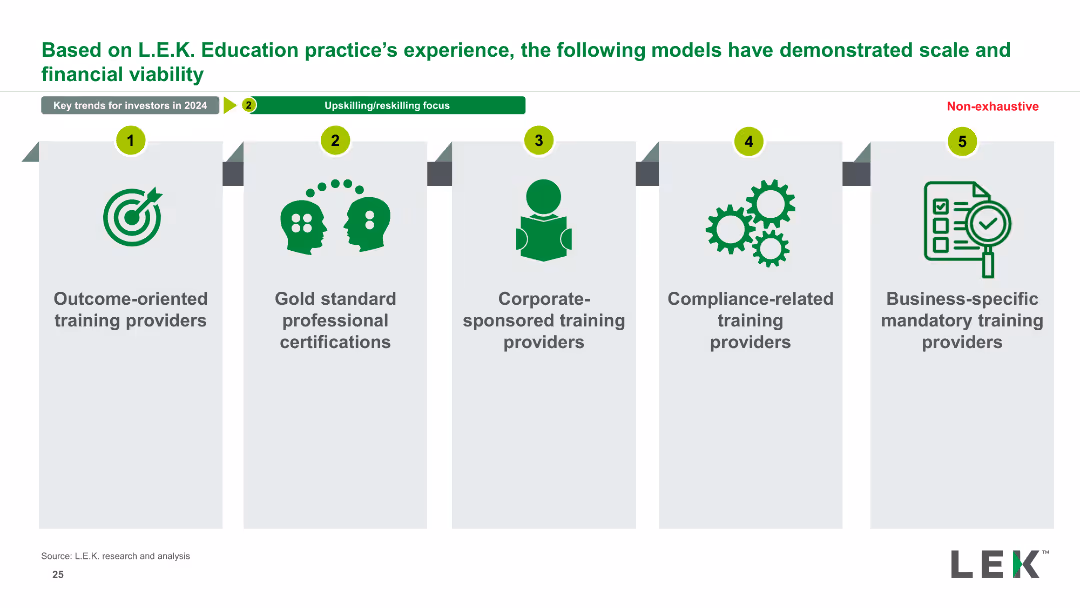
The slide presents five vertical blocks, each describing a different model for training providers, with corresponding icons and brief descriptions.
Strategic Planning
Education & Training
This slide showcases various training provider models that have proven to be scalable and financially viable, including outcome-oriented and corporate-sponsored providers.
training providers, financial viability, scalable models, education practice, strategic planning, training models, corporate training
false
Based on L.E.K. Education practice’s experience, the following models have demonstrated scale and financial viabilityEducation: 2023 M&A Deal Roundup and Trends to Watch Out for in 2024
Pillar
LEK
View slide
The slide presents two column charts, one showing the percentage of cov-lite loans and the other showing incurrence debt percentages.
Risk Assessment and Management
Financial Services
The slide addresses risks associated with covenant-lite loans and compares them with traditional loans, highlighting concerns and mitigants.
covenant-lite loans, risks, Credit Suisse, incurrence debt, traditional loans, mitigants, comparisons, credit quality
false
…including potential risks with covenant-lite loans…Credit Suisse Investor Day 2018 Managing our business through the cycle
Multiple Chart
Credit Suisse
View slide
This slide features a line graph displaying global per capita food consumption with a forecast till 2030. It's accompanied by text boxes highlighting key investment opportunities.
Market Analysis and Trends
Agriculture & Food Production
It outlines the relationship between population growth and agricultural technology improvements, proposing investment opportunities.
food consumption, population growth, agriculture, technology, investment opportunities
false
Crop market investment themesEY-Parthenon Perspectives: Investing in the agricultural crop industry
Single Chart
EY
View slide
Multi-panel comparison, various aspects of CAI solutions
Strategic Planning
Professional Services
Guides decision-making in CAI implementation
CAI, platform, user experience, analytics
false
What to Look For When Making SolutionDecisionsTrends & AI in the Contact Center
Table
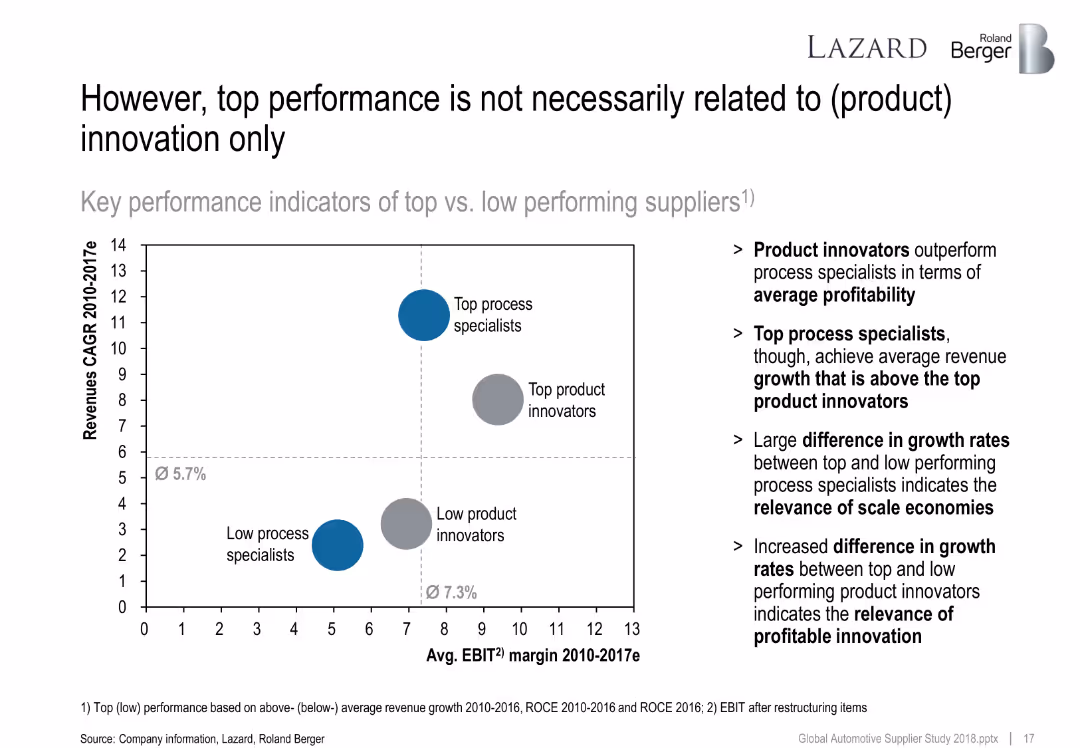
Deloitte
View slide
Bubble chart comparing revenue CAGR and EBIT margin of four supplier groups (top/low innovators and process specialists).
Financial Performance
Industrial & Manufacturing
Analyzes whether innovation is the sole driver of performance. Concludes that scale and execution also matter, with top process specialists sometimes outperforming in growth versus top innovators in profitability.
innovation, process specialist, profitability, scale economies, growth drivers
false
However, top performance is not necessarily related to (product) innovation onlyThe overall positive sentiment was also reflected in the supplier valuation levels that still trade above their long-term average
Mixed Chart
Roland Berger
View slide
This slide features a column chart and a numeric list detailing the impact of logistics on e-commerce deals. The colors used differentiate the segments clearly, with annotations providing insights on investment trends.
Market Analysis and Trends
Transportation & Logistics
Analyzes how logistics investments have become a major driver in e-commerce deal values, with a notable surge in H1 2021. It also touches on the growing trend of non-marketplace investment opportunities within the e-commerce realm.
E-commerce, Logistics, Investment Trends, SEA
false
Rocketing deal values in e-commerce mainly driven by logisticse-Conomy SEA 2021 Roaring 20s: The SEA Digital Decade
Mixed Chart
Bain
View slide
Slide includes bar charts comparing potential production costs for refining and producing active materials in different cities, focusing on cost advantages in Australia.
Financial Performance
Financial Services
Compares production costs for refining and active materials in various global locations, highlighting Perth and Brisbane as potential low-cost producers if mining and refining are integrated.
refining costs, production costs, global comparison, Australia
false
Australian cities (Perth and Brisbane) could be the lowest-cost producers of LHM and LFP if Australian mining and refining are integratedCharging Ahead Australia’s battery powered future
Multiple Chart
Accenture
View slide
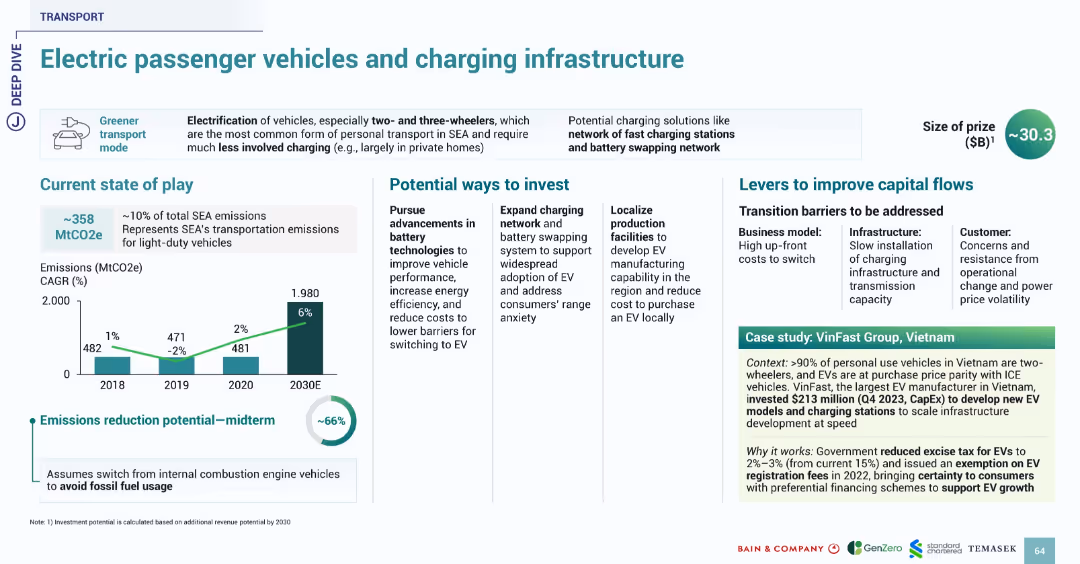
Uses familiar slide format with sections on current state, investment, barriers, and case study. Bright icons and data visualization maintain consistent transport theme.
Technology and Digital Transformation
Transportation & Logistics
Highlights the opportunity in electric passenger vehicles and associated charging infrastructure in SEA, which contributes 10% to SEA emissions. Suggests up to 66% reduction potential with a shift from fossil fuel vehicles. VinFast’s $213M investment in Vietnam illustrates local EV production and policy support. Government incentives like excise tax reduction and fee exemption are noted.
EV, charging, transport, SEA, emissions, VinFast, Vietnam, infrastructure, battery
false
Electric passenger vehicles and charging infrastructureSOUTHEAST ASIA’S GREEN ECONOMY 2024
Multiple Chart
Bain
View slide
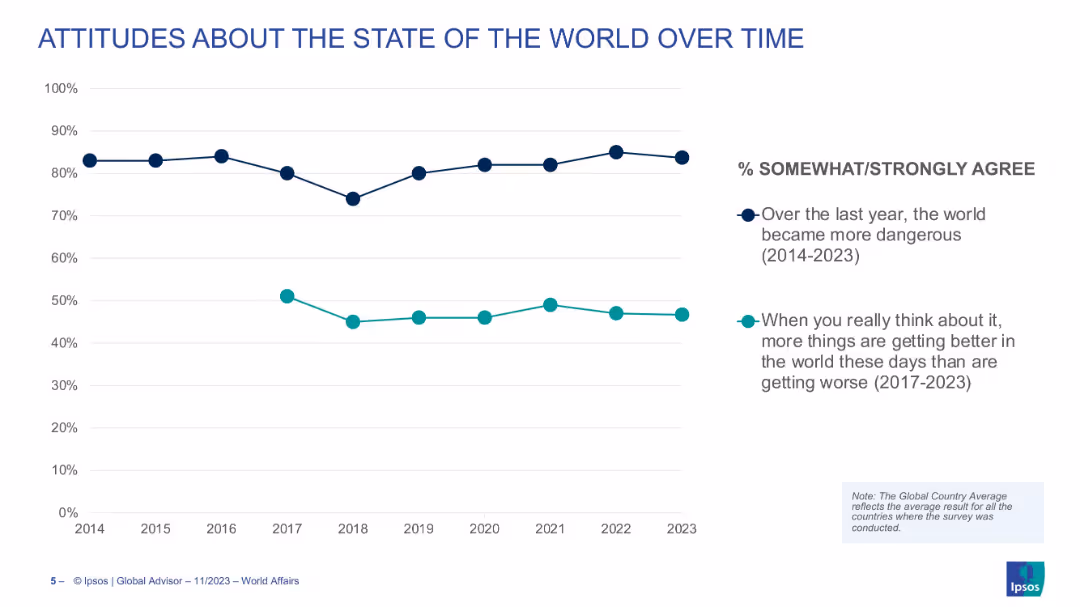
Line graph showing two trendlines over time (2014–2023): one for belief the world is more dangerous, and another for belief that more things are getting better.
Market Analysis and Trends
Media & Entertainment
The slide tracks global attitudes toward danger and optimism over nearly a decade, showing consistent concern about safety and a more fluctuating view on global progress.
world views, optimism, danger, global trends, perceptions, time-series, sentiment
false
Attitudes About the State of the World Over TimeWORLD AFFAIRS 2023
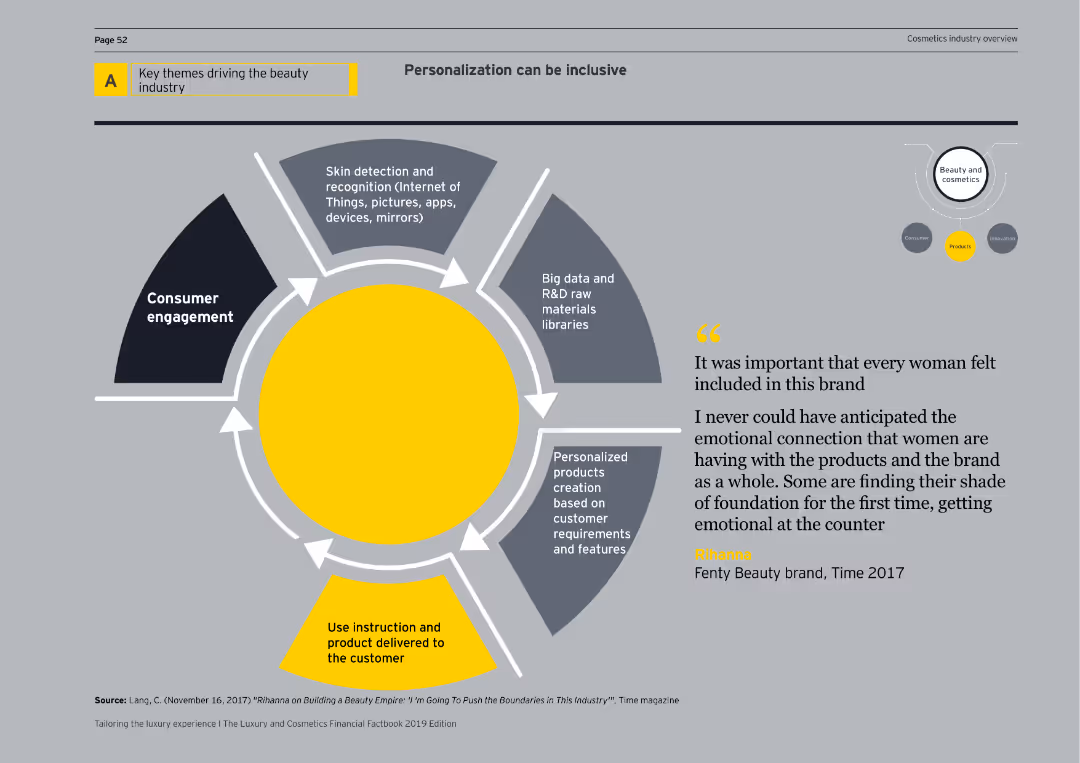
Single Chart
IPSOS
View slide
Features a diagram depicting consumer engagement, skin detection, big data, personalized products, and delivery mechanisms for inclusive personalization.
Market Analysis and Trends
Consumer Goods
Explores the role of personalization in the beauty industry, emphasizing inclusive approaches and advanced technological applications.
personalization, inclusivity, consumer engagement, skin detection, big data, beauty products, innovation, cosmetics, diagram, market analysis
false
Personalization can be inclusiveTailoring the luxury experience The Luxury and Cosmetics Financial Factbook 2019 Edition
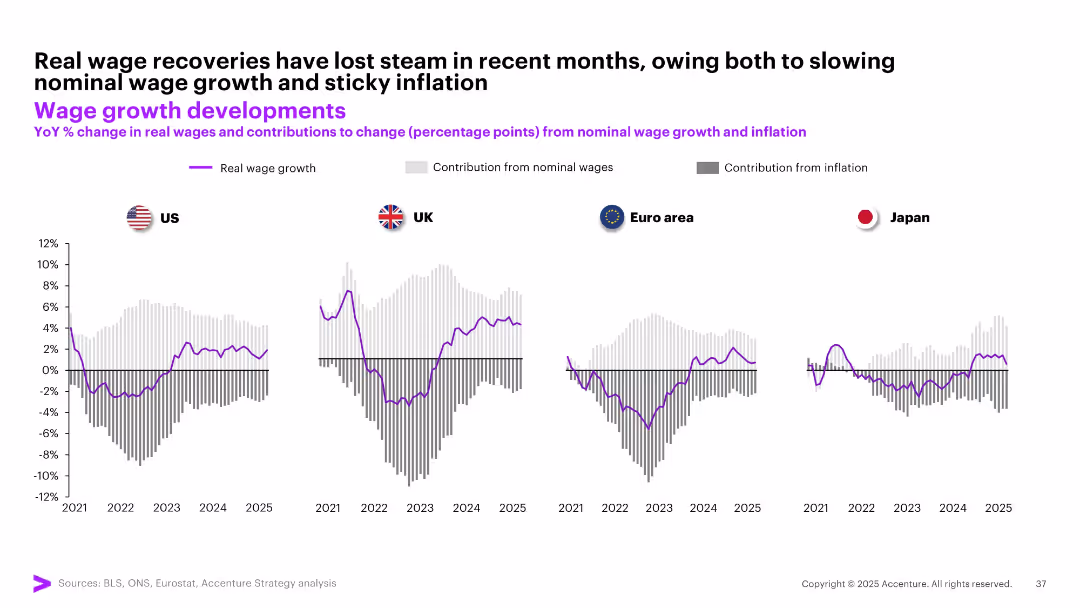
Linear Flow
EY
View slide
Four bar and line combination charts (US, UK, Euro area, Japan) showing real wage growth and contribution from nominal wages and inflation.
Performance Metrics and KPIs
Professional Services
Real wage growth has stagnated recently across major regions. The charts decompose growth into contributions from nominal wage increases and inflation, highlighting inflation's dampening effect on real income improvements.
wage growth, inflation, real income, US, UK, Euro area, Japan, nominal wages, stagnation, labor economics
false
Real wage recoveries have lost steam in recent months, owing both to slowing nominal wage growth and sticky inflationMay Macro Brief Consumer spending in flux
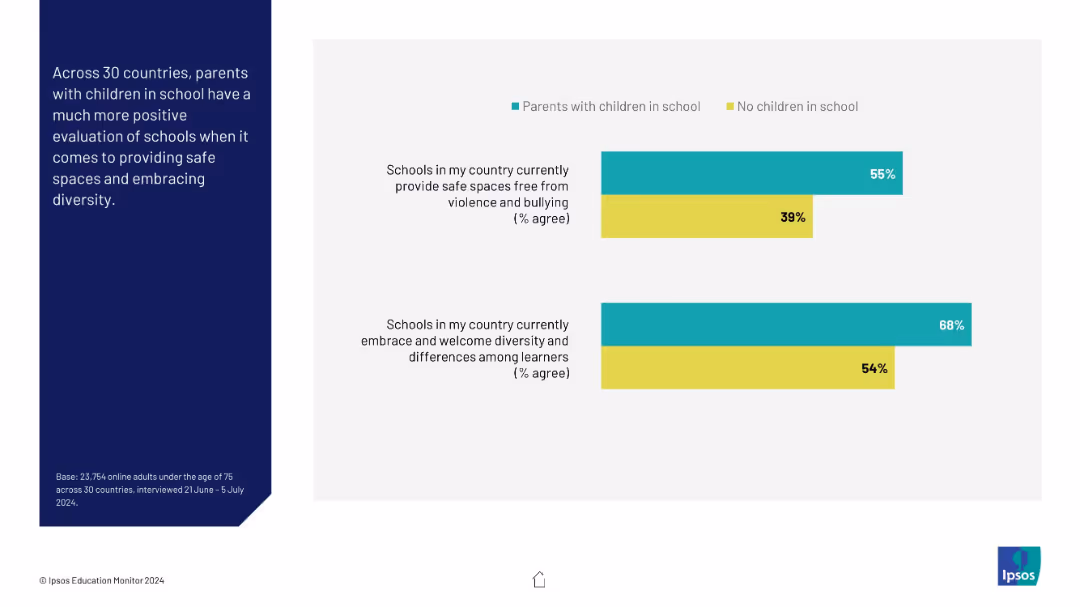
Multiple Chart
Accenture
View slide
Two horizontal bar charts comparing parents with/without school-age children; clean two-column layout with side panel explanation.
Performance Metrics and KPIs
Education & Training
This slide compares perceptions of school safety and inclusiveness between parents of school children and others. Parents with children in school report more favorable views on both measures.
school safety, diversity, parent opinions, comparison, education metrics, Ipsos, survey insights
false
Parents with children rate schools more positively on safety and diversityIPSOS EDUCATION MONITOR 2024
Mixed Chart
IPSOS
View slide
A grid illustrating strategic business areas with adjacent opportunities, indicating expansion directions with arrows.
Strategic Planning
Financial Services
Explores expansion strategies by leveraging synergies between existing and new business areas, essential for strategic market expansion discussions.
Market Expansion, Strategic Adjacencies, Business Development, Growth, Addressable Market
false
Leveraging Adjacencies to Expand Our Addressable MarketGoldman Sachs Investor Day
Framework
Goldman Sachs
1
...
Next
Load More
Hold On!
We are searching in our database
If nothing, comes up, please try different filters!
Create a FREE account to continue browsing
Receive Instant Access to 1,000+ slides from companies like McKinsey, Google, and Goldman Sachs
First Name
Last Name
Email
Password
I agree to all
Terms & Privacy Policy
Thank you! Your submission has been received!
Oops! Something went wrong while submitting the form.
Have an account?
Sign in
Column Chart
Heatmap
Chevron
Org Chart
Infographic
Callouts
Timeline
List
Graphic
Picture
Process Flow
Diagram
Paragraph
Map
Table
Framework
Subtitle
Takeaway Box
Icon
Other Chart
Radar Chart
Waterfall Chart
Mekko Chart
Pie Chart
Scatter Plot
Line Chart
Bar chart
Bullet points


![[Country] is in decline](https://cdn.prod.website-files.com/654e70fb59937215cac87b19/6899bd2cb729b6bf115e8c68_nKBIWqbk_PqjoIb92MCay5JTPTHPMlp7bf8lVyQtNSg.avif)