🎉 Black Friday Sale!
- Save 20% on SlideStart Pro Annual plan! CODE:
BLACKFRIDAY
My Account
My Slides
Search by Category
Templates
View All Templates
Download Template Slides
Leave Feedback
Login
Logout
Get Started
Browse all Slides
Browse all Slides
Create a FREE Account
Instant access to 1,000+ real slides from top companies like McKinsey, BCG, Goldman Sachs, Google and many more!
First Name
Last Name
Email
Password
I agree to all
Terms & Privacy Policy
Thank you! Your submission has been received!
Oops! Something went wrong while submitting the form.
Have an account?
Sign in
Instant access to the internet's best slides
Get access to 40+ advanced filters and more
Advanced Search and Filters
Access to
10,000+ slides
Access to Category Pages
Save/Bookmark Slides
PowerPoint Template Library (New)
Choose your plan
MONTHLY
$12/month
Billed every month, cancel anytime.
YEARLY
$9/month
Billed $108 annually, cancel anytime.
Checkout for $12/month
Checkout for $108/yr
Secured by Stripe | AES-256 bit encryption
Spark Your Next Big Idea with New Presentation Templates
VIEW ALL Templates
Welcome,
Welcome
Upgrade to SlideStart
Pro
Instant access to 15,000+ slides
Show Featured Only
Checkbox 8
Companies
Mckinsey
Bain
BCG
EY
Deloitte
Accenture
PwC/Strategy&
JP Morgan
Goldman Sachs
Morgan Stanley
Citigroup
Deutsche Bank
Barclays
LEK
Kearney
Oliver Wyman
Booz Allen Hamilton
Gartner
IPSOS
Nielsen
Slide type
Header Horizontal
Framework
Vertical Flow
Single Chart
Single Chart
Text Only
Mixed Chart
Header Vertical
Graphic
Pillar
Multiple Chart
Agenda
Title
Table
Linear Flow
Upgrade to SlideStart
Pro
Instant access to 40+ advanced filters
Industry
Upgrade to SlideStart
Pro
Instant access to 40+ advanced filters
Technology
Healthcare
Financial Services
Consumer Goods
Energy & Utilities
Manufacturing
Retail
E-commerce
Logistics
Telecommunications
Real Estate
Professional Services
Education
Media
Entertainment
Hospitatlity
Tourism
Agriculture
Food Production
Government & Public Sector
Environmental
Sustainability
Use Case
Upgrade to SlideStart
Pro
Instant access to 40+ advanced filters
Sales and Business Development
Mergers and Acquisitions
Corporate Finance and Valuation
Performance Metrics and KPIs
Client Case Studies
Competitive Landscape
Product and Service Analysis
Customer and Market Segmentation
Organizational Structure
Human Resources and Talent Management
Industry Overview
Regulatory and Compliance
Risk Assessment and Management
Agriculture & Food Production
Hospitality and Tourism
Government
Environmental
Sustainability
Clear all
Thank you! Your submission has been received!
Oops! Something went wrong while submitting the form.
Show Featured Only
Checkbox 8
Companies
Mckinsey
Bain
BCG
EY
Deloitte
Accenture
PwC/Strategy&
JP Morgan
Goldman Sachs
Morgan Stanley
Citigroup
Deutsche Bank
Barclays
LEK
Kearney
Oliver Wyman
Booz Allen Hamilton
Gartner
IPSOS
Nielsen
Slide type
Text Only
Linear Flow
Vertical Flow
Single Chart
Header Horizontal
Mixed Chart
Header Vertical
Pillar
Multiple Chart
Graphic
Agenda
Title
Table
Framework
Industry
Technology
Healthcare
Financial Services
Consumer Goods
Energy & Utilities
Manufacturing
Retail
E-commerce
Logistics
Telecommunications
Real Estate
Professional Services
Education
Media
Entertainment
Hospitatlity
Tourism
Agriculture
Food Production
Government & Public Sector
Environmental
Sustainability
Use Case
Sales and Business Development
Mergers and Acquisitions
Corporate Finance and Valuation
Performance Metrics and KPIs
Client Case Studies
Competitive Landscape
Product and Service Analysis
Customer and Market Segmentation
Organizational Structure
Human Resources and Talent Management
Industry Overview
Regulatory and Compliance
Risk Assessment and Management
Agriculture & Food Production
Hospitality and Tourism
Government
Environmental
Sustainability
Clear all
Thank you! Your submission has been received!
Oops! Something went wrong while submitting the form.
Tag
View slide
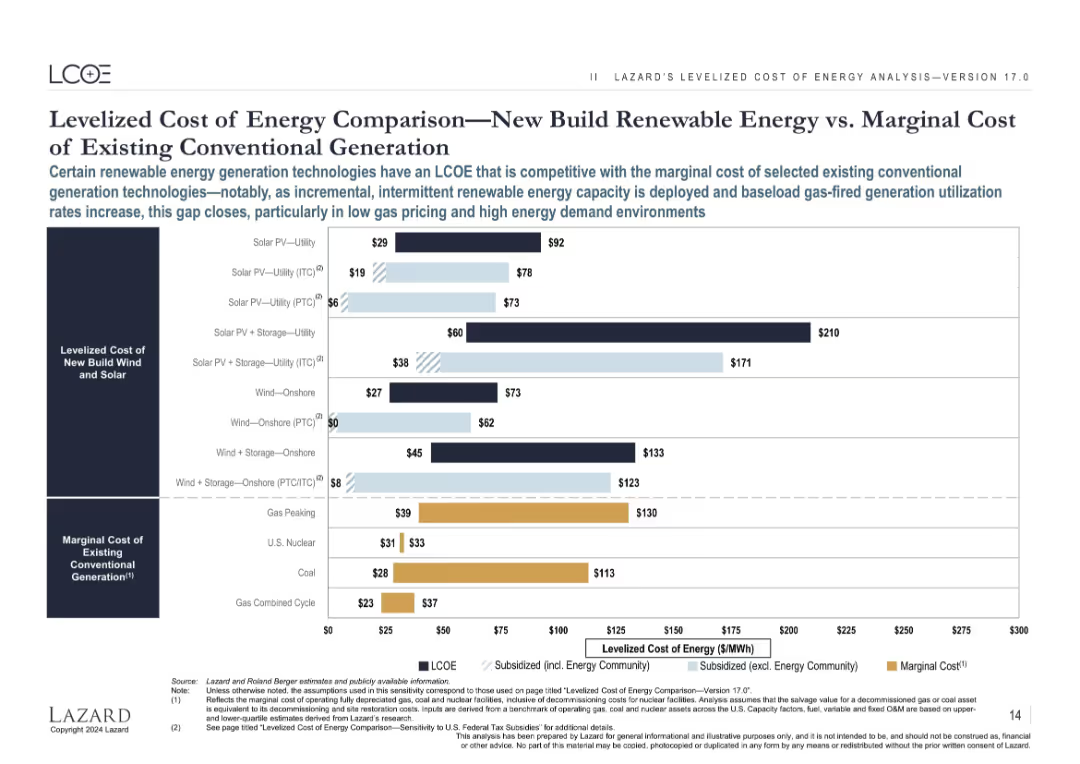
Bar chart comparing LCOE of new renewable projects with marginal cost of operating existing conventional plants; includes subsidy impacts.
Strategic Planning
Energy & Utilities
Shows that new renewable projects are often cheaper than continuing to operate existing fossil plants, especially when subsidies are considered, underscoring the financial case for clean energy transition.
renewable, marginal cost, conventional energy, LCOE, transition, subsidies, solar, wind
false
Levelized Cost of Energy Comparison—New Build Renewable Energy vs. Marginal Cost of Existing Conventional GenerationLazard LCOE+
Single Chart
Roland Berger
View slide
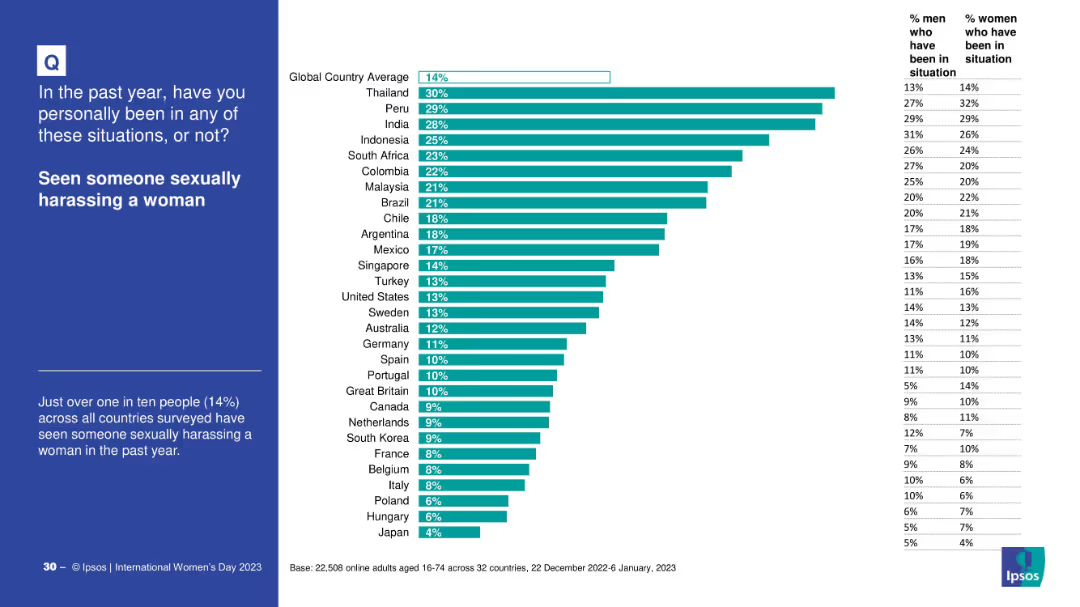
Country-wise bar chart on witnessing sexual harassment, with gender breakdown. Global average line included.
Risk Assessment and Management
Government & Public Sector
This slide presents global data on the percentage of people who witnessed sexual harassment of women in the past year. Thailand and Peru report the highest percentages, while Japan is lowest.
harassment, gender issues, observation statistics, global variance, witness data
false
Sexual Harassment Witnessing – By CountryINTERNATIONAL WOMEN'S DAY 2023
Mixed Chart
IPSOS
View slide
This slide presents a bar chart comparing local authorities by the number of high-growth companies, paired with a table showing total investment received.
Market Analysis and Trends
Government & Public Sector
Focuses on the distribution of high-growth companies and investment across UK local authorities, highlighting areas with significant economic activity like Edinburgh and Manchester.
local authorities, high-growth companies, economic development, investment received, regional comparison, economic hubs, UK cities, business clustering
false
Local authorities by number of high-growth companies (2021)Unlocking growth: Creating tech ecosystems to stimulate local economies
Multiple Chart
Barclays
View slide
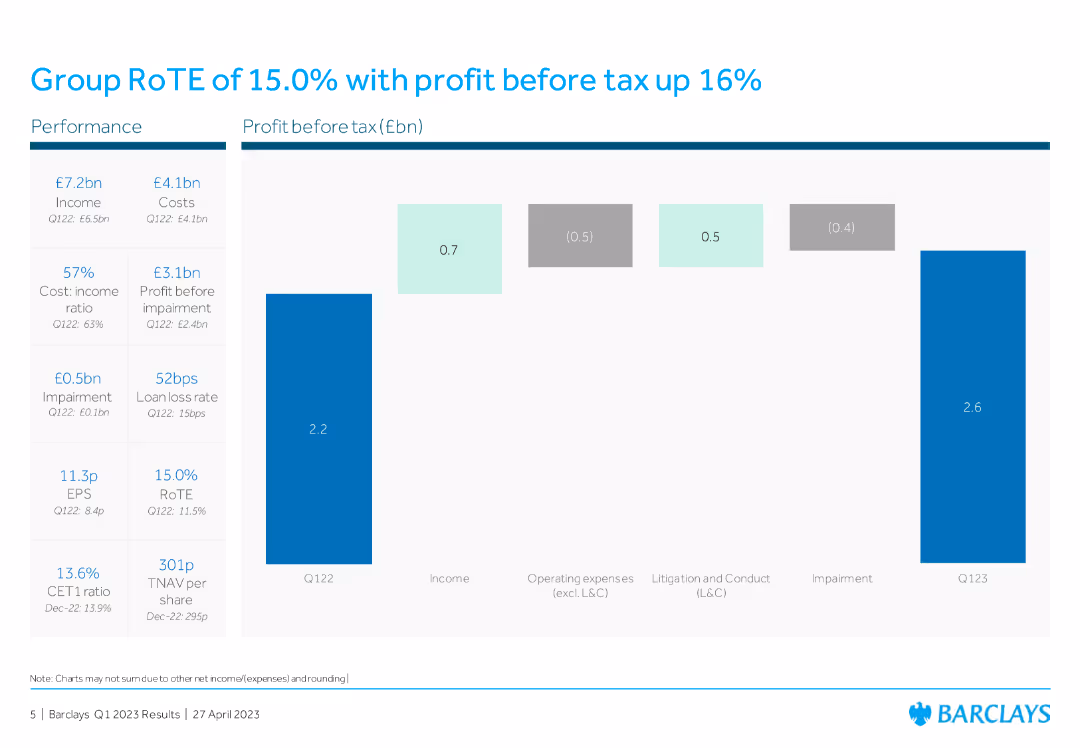
This slide includes a column chart showing profit before tax and other financial metrics like income, operating expenses, litigation, conduct costs, and impairment for Q122 and Q123, highlighting changes and growth rates.
Financial Performance
Financial Services
The slide displays financial performance metrics for Barclays Group, showing a 15% RoTE and profit before tax increase, with detailed breakdowns of income, expenses, and impairments for Q122 and Q123.
RoTE, profit before tax, financial metrics, income, expenses
false
Group RoTE of 15.0% with profit before tax up 16%Barclays PLC Q1 2023 Fixed Income Investor Presentation
Mixed Chart
Barclays
View slide
Features a column chart showing the growth of the online luxury goods market from 2015 to 2025F.
Market Analysis and Trends
Retail & E-commerce
Highlights the explosive growth of the online luxury goods market, predicting continued expansion and digital influence through 2025.
online, luxury, market, growth, 2025
false
Online luxury doubled its weight in the total market in 2020, a skyrocketing performance worth five years of growth; clear road to 2025BAIN-ALTAGAMMA 2020 WORLDWIDE LUXURY MARKET MONITOR
Multiple Chart
Bain
View slide
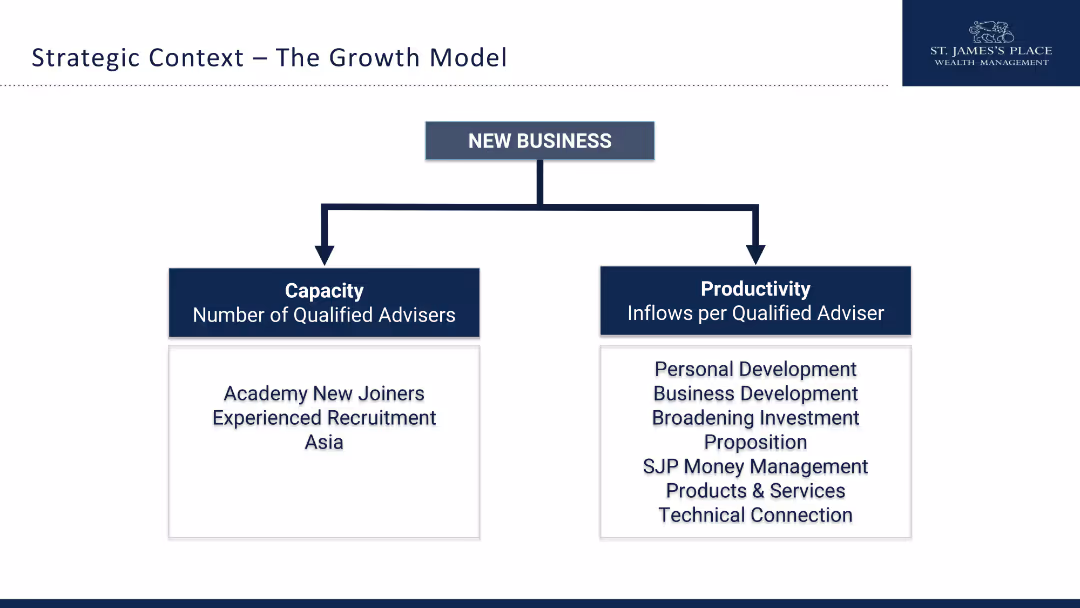
The slide features a hierarchical diagram with two main branches: Capacity and Productivity. Simple design.
Strategic Planning
Financial Services
This slide outlines the strategic growth model for new business, focusing on increasing the number of advisors and their productivity.
growth model, capacity, productivity, strategy, advisors, recruitment, development, financial services
false
Strategic Context The Growth ModelExternal Asset Manager (EAM) Conference
Diagram
Deloitte
View slide
Slide with four bar charts and accompanying text blocks highlighting talent presence in various industries in Italy, colored distinctly for each sector.
Human Resources and Talent Management
Technology & Software
Discusses talent distribution across different sectors, emphasizing on the gaps and how companies might bridge these to match top-performing companies.
talent management, HR, technology, analytics, digital marketing
false
Companies are starting to enhance their talent acquisition processes, but there’s still a long way to goDigital Revolution Awards
Multiple Chart
Bain
View slide
A bar chart with horizontal bars showing the importance of various macro risk factors to investors, including Federal Reserve policies and inflation. Includes percentage labels and change indicators.
Risk Assessment and Management
Financial Services
Summarizes investor perspectives on critical macroeconomic risks impacting investment decisions, highlighting the prominence of interest rates, inflation, and geopolitical concerns as top factors.
macro risks, investments, inflation, Federal Reserve
false
When asked which macro risk factors are the most important, investors pointed to inflation, Federal Reserve policy, and geopolitical risksBCG Investor Perspectives Series Q1 2023
Single Chart
BCG
View slide
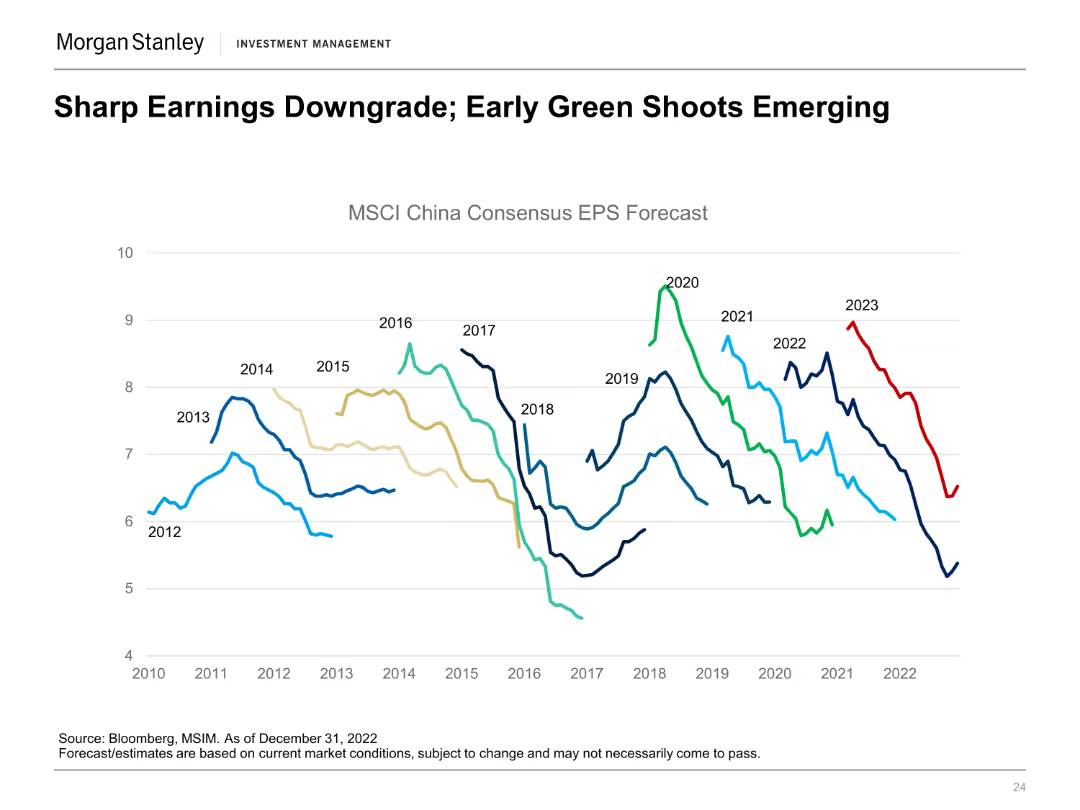
A line chart showing the MSCI China Consensus EPS Forecast from 2012 to 2023 with different colored lines representing each year's forecast.
Market Analysis and Trends
Financial Services
The slide highlights the downgrading of earnings forecasts for MSCI China while identifying early signs of recovery, projecting future trends.
MSCI China, EPS Forecast, Earnings, Downgrade, Recovery
false
Sharp Earnings Downgrade; Early Green Shoots EmergingMorgan Stanley Investment Management Emerging Markets / Asia
Single Chart
Morgan Stanley
View slide
Features two column charts comparing estimated contract values and contract awards from 2016 to 2019, annotated with statistical data. There's also a key at the bottom for color references.
Financial Performance
Energy & Utilities
This slide provides financial data on the growth and success of integrated contracts and specific subsea projects under the Subsea Integration Alliance, highlighting significant industry collaboration and achievements.
financials, contracts, growth, subsea, integration
false
Integrated Contracts Est. Value (USD bn)Barclays CEO Energy-Power Conference 2019
Multiple Chart
Barclays
View slide
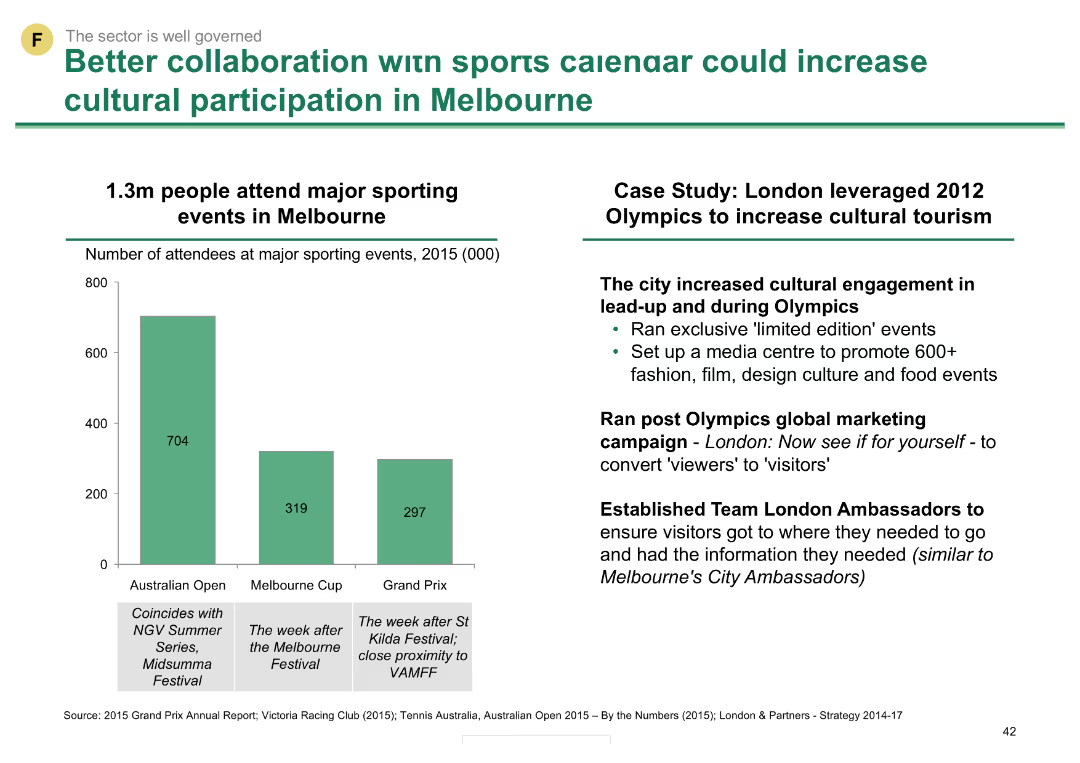
Column chart showing attendance numbers for major sporting events in Melbourne in 2015, alongside a case study of the London 2012 Olympics' impact on cultural tourism.
Strategic Planning
Hospitality & Tourism
This slide highlights the potential of leveraging sports events to boost cultural participation, using Melbourne and the London 2012 Olympics as examples.
sports, cultural participation, Melbourne, London, Olympics, tourism, events, collaboration, strategic planning
false
Better collaboration with sports calendar could increase cultural participation in MelbourneMelbourne as a Global Cultural Destination
Mixed Chart
BCG
View slide
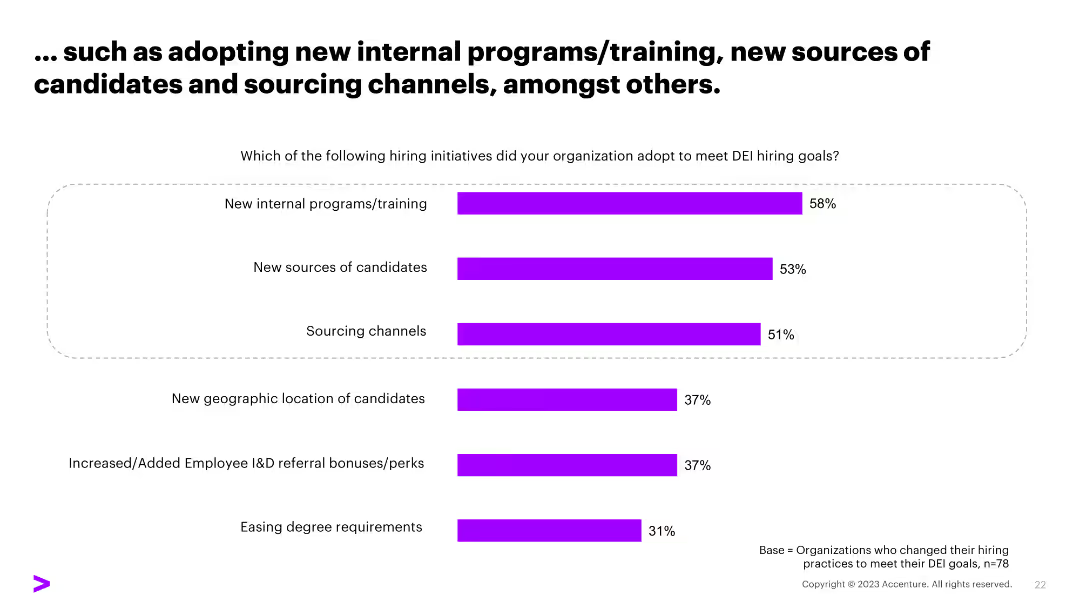
A column chart showing various hiring initiatives like new internal programs/training, new sources of candidates, and sourcing channels, with percentage values.
Human Resources and Talent Management
Professional Services
The slide lists various initiatives organizations adopted to meet DEI hiring goals, highlighting the most common methods and their adoption rates.
DEI, hiring initiatives, training programs, candidates, sourcing channels
false
… such as adopting new internal programs/training, new sources of candidates and sourcing channels, amongst others.Tech Talent Hiring Trends Survey
Single Chart
Accenture
View slide
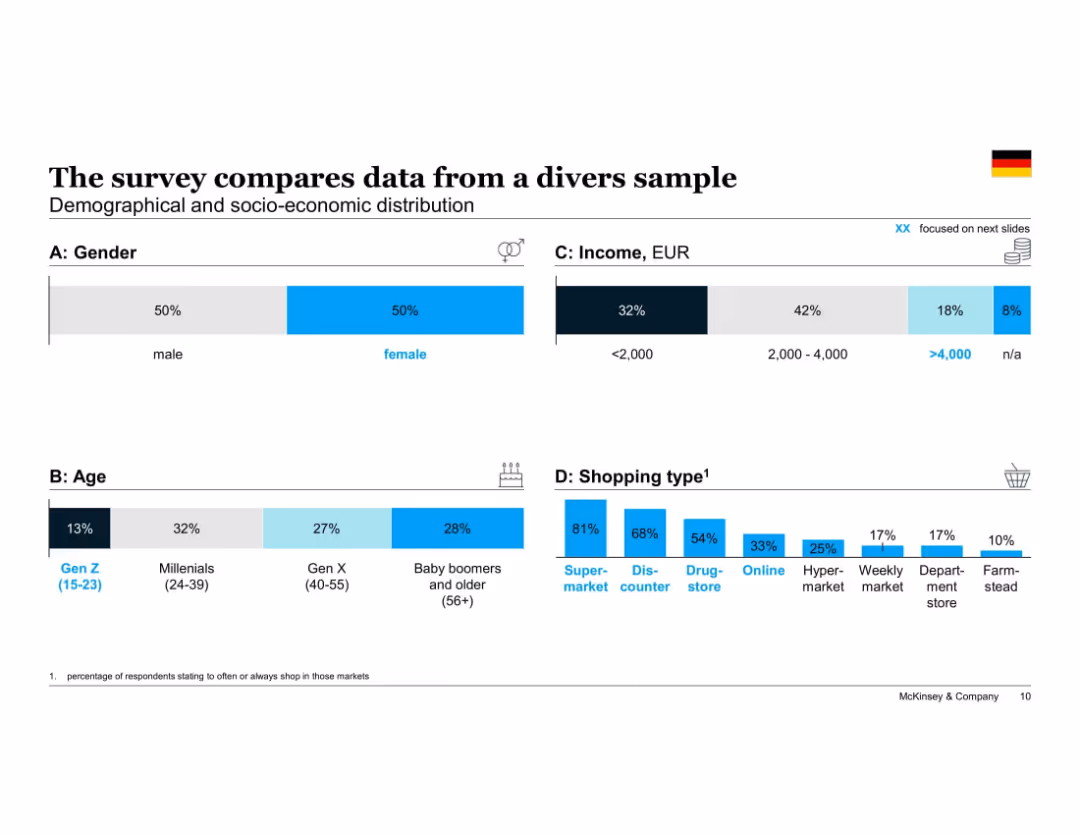
Grid of demographic distribution visualizations: gender, age, income, and shopping types. Uses bars and color blocks.
Market Analysis and Trends
Consumer Goods
Provides demographic and economic background of the consumer survey sample, covering gender, age groups, income levels, and preferred shopping venues. Sets the foundation for interpreting insights in subsequent slides.
demographics, income distribution, age segmentation, shopping types, survey sample, consumer data, McKinsey, Germany
false
The survey compares data from a divers sampleConsumers' sustainability sentiment and behavior before, during and after the COVID-19 crisis
Multiple Chart
McKinsey
View slide
This slide features a column chart and a table that depicts the global wallet evolution by product, the other by region, accompanied by a sidebar listing key market drivers with directional arrows.
Market Analysis and Trends
Financial Services
Reflecting on the investment banking industry's financial metrics, it shows the distribution of wallet size by product and region, with attention to various economic and geopolitical drivers influencing the industry.
Investment Banking, Global Wallet, Drivers
false
Our Payments business has grown significantly as a result of both NII and fee growthInverstors Day 2023
Mixed Chart
JP Morgan
View slide
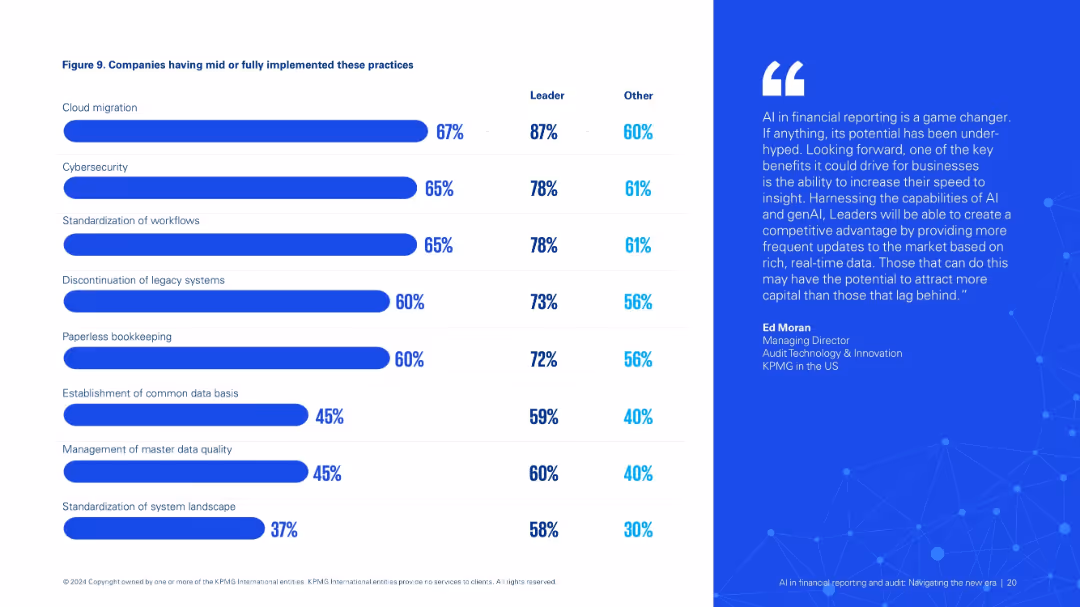
Two-column layout: left side includes implementation stats with a bar chart (Figure 9), right features a quote. Blue-white color scheme.
Operational Efficiency
Financial Services
Details implementation levels of key practices like cloud migration, cybersecurity, and workflow standardization that enable AI integration in financial reporting, especially among industry leaders.
implementation, AI adoption, cloud, cybersecurity, workflow, financial reporting
false
Companies having mid or fully implemented these practicesAI infinancial reporting and audit: Navigating the new era
Mixed Chart
KPMG
View slide
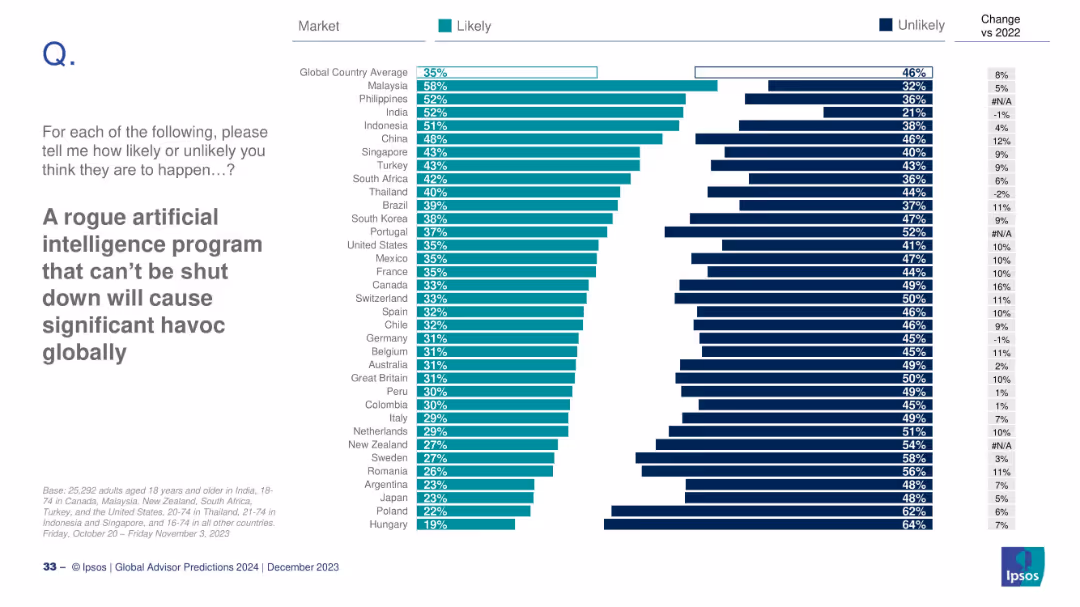
Horizontal bar chart with countries ranked by likelihood of AI-caused chaos; right side shows change vs 2022.
Risk Assessment and Management
Artificial Intelligence
This slide evaluates global concerns about uncontrollable AI causing havoc. Malaysia and Philippines rank highest, while Hungary and Poland rank lowest. A comparison with 2022 perceptions is included, showing changes in sentiment for each country.
AI risk, rogue AI, global concern, survey, Ipsos, public opinion, 2024 prediction
false
A rogue artificial intelligence program that can’t be shut down will cause significant havoc globallyGLOBAL ADVISOR 2024 PREDICTIONS
Mixed Chart
IPSOS
View slide
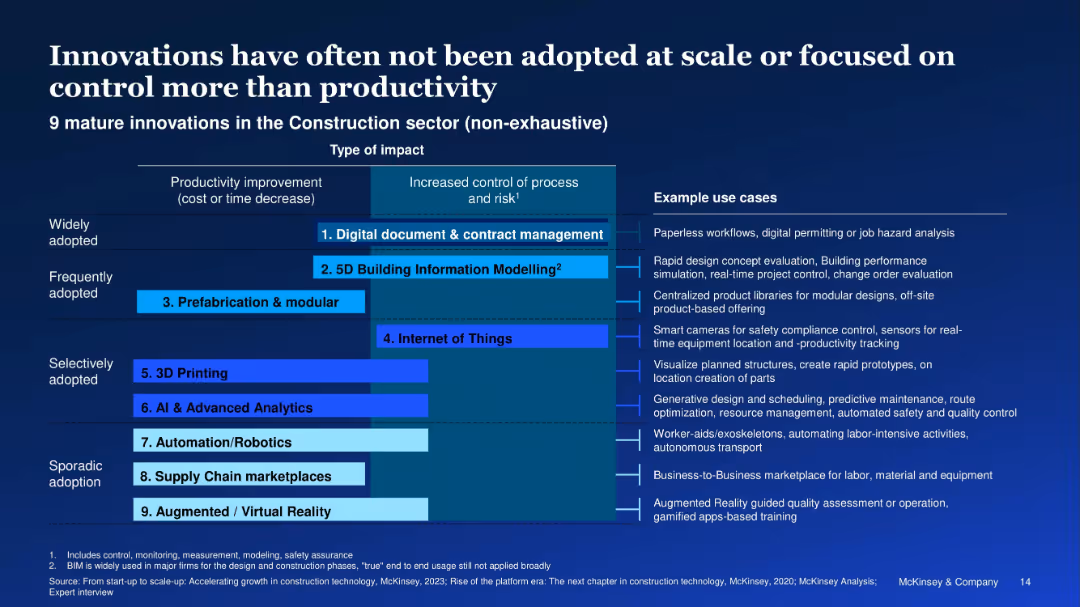
Matrix categorizing 9 innovations by adoption level and impact; use case examples on right
Technology and Digital Transformation
Real Estate & Construction
A framework ranking 9 construction innovations by adoption and type of impact. Highlights that widely adopted tools favor control over productivity, with sporadic adoption of high-impact technologies like AI and robotics.
construction tech, innovation, adoption, AI, IoT, productivity control
false
Innovations have often not been adopted at scale or focused on control more than productivityDelivering on construction productivity is no longer optional
Mixed Chart
McKinsey
View slide
A flowchart diagram showing the interconnectivity of privacy-preserving technologies, including data platforms, clean rooms, and activation channels.
Technology and Digital Transformation
Technology & Software
Depicts the interconnectivity of various privacy-preserving technologies, emphasizing the integration of data platforms and clean rooms for secure data management.
privacy-preserving, interconnectivity, data platforms, clean rooms, technology
false
Privacy Preserving Technology : Interconnectivity MapState of Data 2023
Diagram
IPSOS
View slide
This slide features texts and percentages comparing aspects like development opportunities, compensation, and workplace conditions between Ukraine and Global statistics. There are illustrations of diverse individuals on the left side.
Human Resources and Talent Management
Professional Services
This slide presents data on how employees' influence varies by region in aspects such as development opportunities, compensation, and workplace conditions. It contrasts these aspects between Ukraine and globally, highlighting regional differences and focusing on employee empowerment strategies.
Employee, Influence, Global, Ukraine, Data
false
Building relations with employees by balancing their interests with organization’sDeloitte 2023 Global Human Capital Trends: New fundamentals for a boundaryless world
Table
Deloitte
View slide
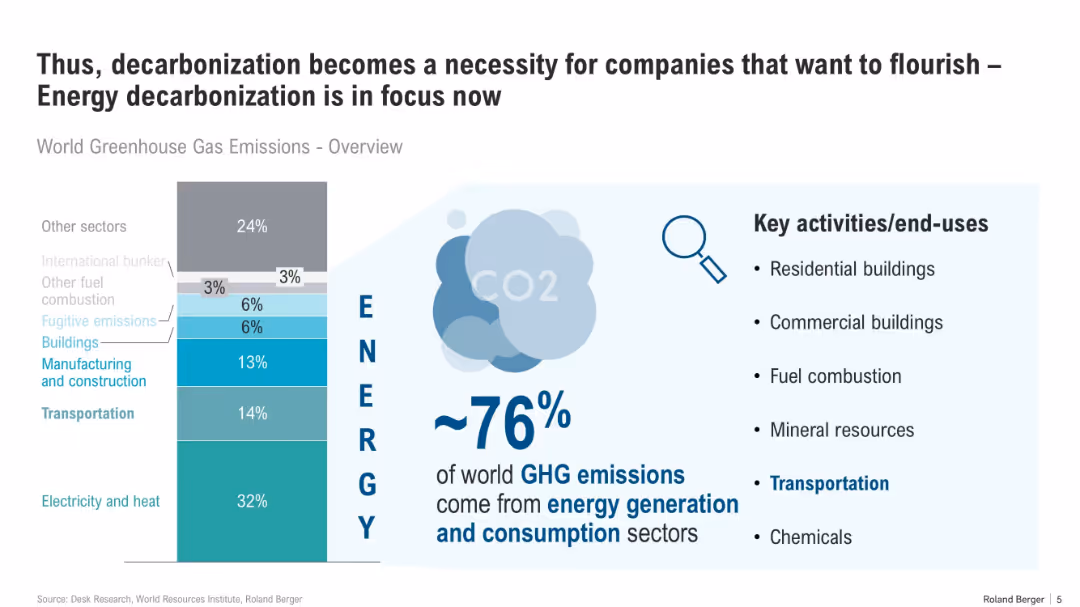
Vertical bar chart centered, split into sectors by emission contribution, with supporting bullet points and infographic elements on the right.
Technology and Digital Transformation
Energy & Utilities
The slide emphasizes that ~76% of global GHG emissions originate from energy generation and use. It highlights key energy-consuming sectors and stresses the need for corporate decarbonization to meet sustainability goals.
decarbonization, GHG emissions, energy, buildings, transportation, commercial, CO2, consumption, sector overview
false
Thus, decarbonization becomes a necessity for companies that want to flourish – Energy decarbonization is in focus nowDecarbonization in ports and shipping
Mixed Chart
Roland Berger
View slide
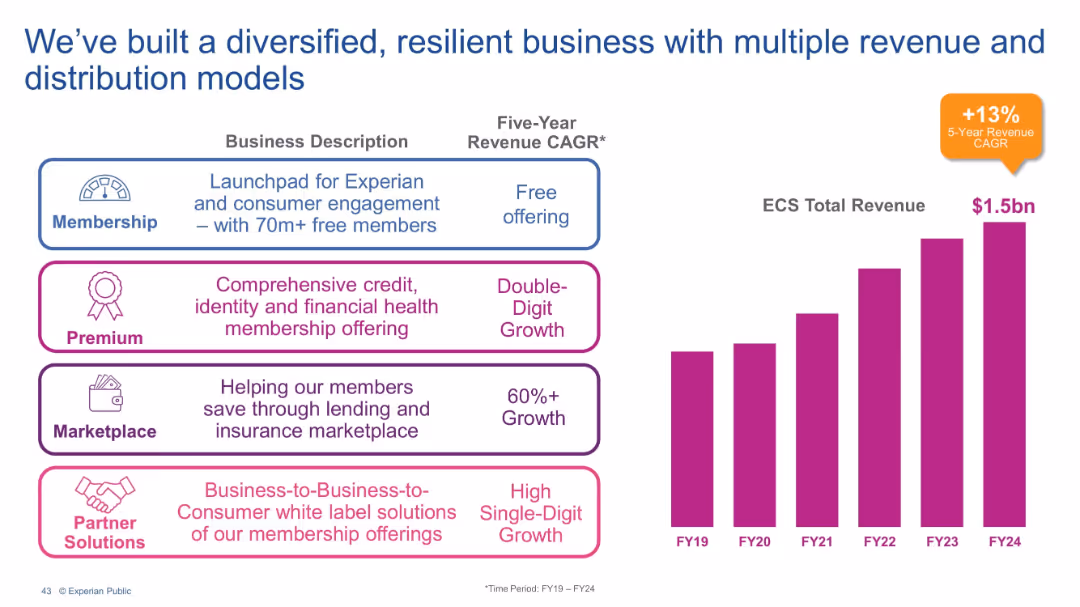
Split into two parts: business model breakdown on left (Membership, Premium, Marketplace, Partner Solutions) and revenue bar chart on right.
Financial Performance
Technology & Software
The slide presents Experian's diversified business models and revenue growth. It categorizes offerings by user type and growth trajectory, with supporting data on ECS revenue growing to $1.5bn over five years at a 13% CAGR.
Revenue model, Membership, Premium services, Marketplace, Partner Solutions, ECS revenue, Growth strategy
false
We’ve built a diversified, resilient business with multiple revenue and distribution modelsBarclays Global Credit Bureau Forum
Mixed Chart
Barclays
View slide
Bar graph showing growth in internet economy GMV from 2019 to 2025, with a forecast. The layout is clean with a central graph and annotations for CAGR percentages. The color scheme is blue and gray, adhering to a professional look.
Financial Performance
Technology & Software
The slide presents the growth of Vietnam's internet economy, reaching $21 billion. It provides a positive outlook on the government and economy's resilience, with projections up to 2025.
Internet Economy, Vietnam, GMV, Resilience, Government, Growth, Forecast, CAGR
false
Vietnam Internet economy reaches $21B, demonstrating that both government and economy remain resiliente-Conomy SEA 2021 Roaring 20s: The SEA Digital Decade
Single Chart
Bain
View slide
Image and text layout explaining three strategic steps: Get a head start, Embed value-based models, and Amplify benefits with larger partners.
Strategic Planning
Professional Services
Advises on strategic managed services engagement for investment, emphasizing early involvement and collaboration with large partners for operational improvements.
strategy, managed services, investment, benefits, partners
false
Strong strategic managed services providers help build resilience in a time of disruption and become true partners in innovation, operating with a “one team” mentality. As you prepare for your next investment, consider the following:The evolving private equity playbook
Linear Flow
Accenture
View slide
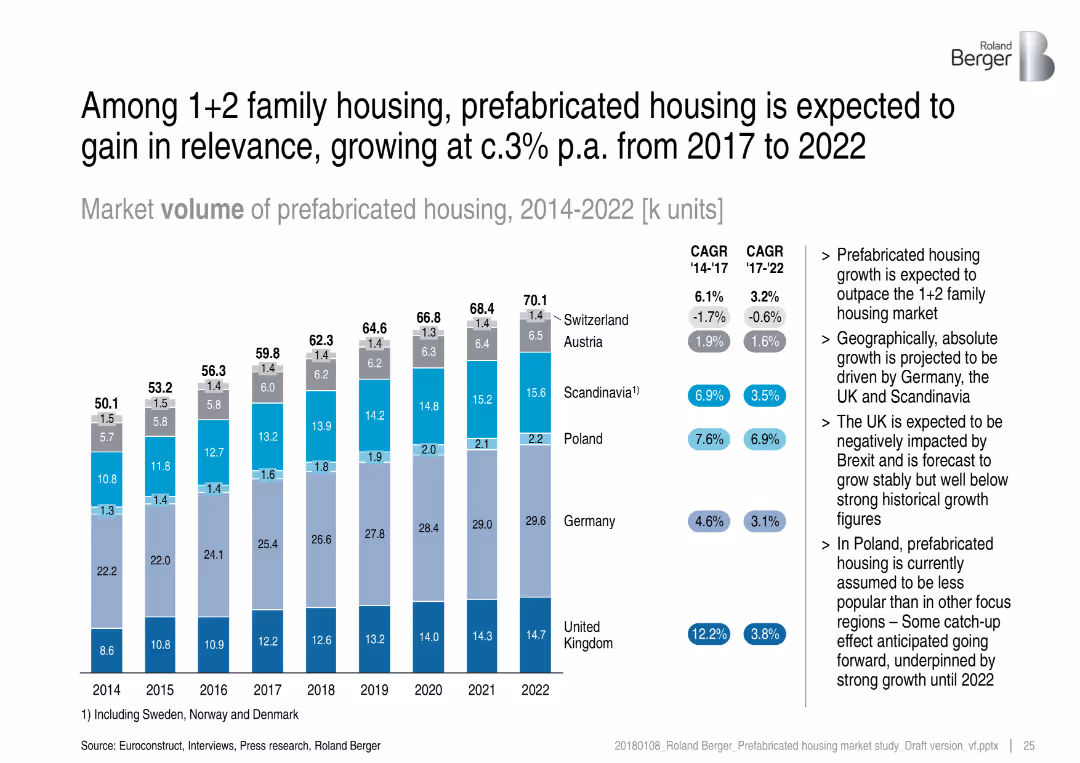
Stacked bar chart showing prefabricated housing volumes from 2014–2022 across countries, with CAGR metrics and insights.
Market Analysis and Trends
Real Estate & Construction
This slide focuses on the rising importance of prefabricated housing within the broader 1+2 family housing segment. It shows that prefabricated solutions are gaining momentum, especially in Germany, UK, and Scandinavia, with notable growth in Poland.
prefabricated housing, market growth, construction trends, housing demand, CAGR, regional analysis, volume forecast
false
Among 1+2 family housing, prefabricated housing is expected to gain in relevance, growing at c.3% p.a. from 2017 to 2022Prefabricated housing market in Central and Northern Europe – Overview of market trends and development
Mixed Chart
Roland Berger
View slide
Visual timeline of major 2020 global events including the COVID-19 pandemic, stock market crash, and various crises.
Operational Efficiency
Healthcare & Pharmaceuticals
Provides a detailed timeline of key global and healthcare events in 2020, useful for historical analysis and educational purposes.
pandemic, timeline, global events, COVID-19, healthcare, 2020
false
2020: Timeline of a pandemic (and beyond)BAIN-ALTAGAMMA 2020 WORLDWIDE LUXURY MARKET MONITOR
Mixed Chart
Bain
View slide
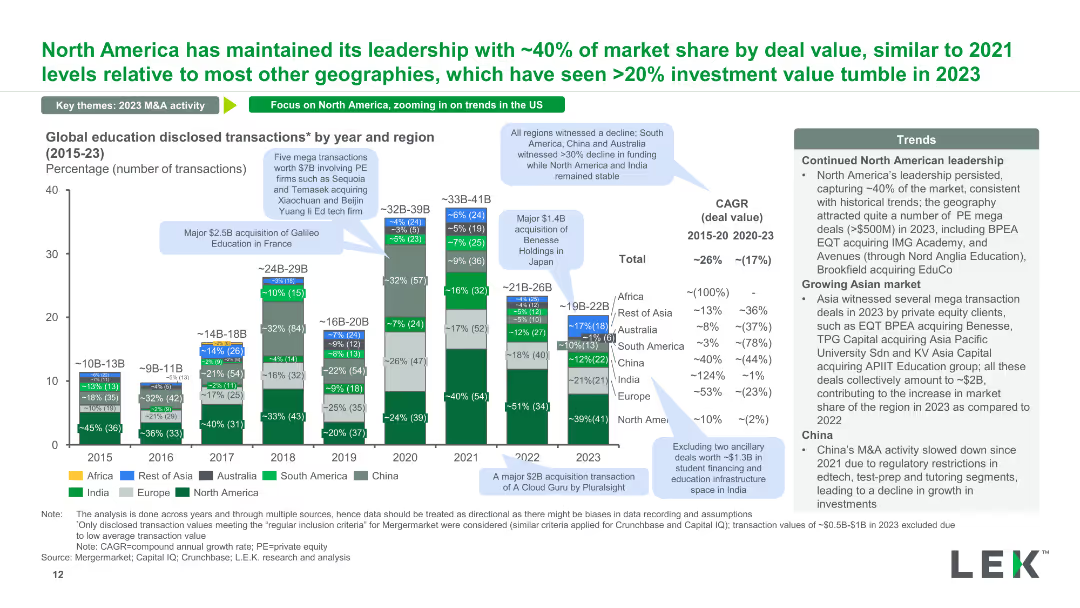
A stacked column chart displaying the number of global education disclosed transactions by year and region from 2015 to 2023. Annotations provide context on significant transactions and regional trends.
Market Analysis and Trends
Education & Training
This slide shows the distribution of disclosed transactions in the education sector across different regions over time, highlighting major deals and geographical trends in investment.
disclosed transactions, global education, regional trends, annual data, major deals
false
North America has maintained its leadership with ~40% of market share by deal value, similar to 2021 levels relative to most other geographies, which have seen >20% investment value tumble in 2023Education: 2023 M&A Deal Roundup and Trends to Watch Out for in 2024
Mixed Chart
LEK
View slide
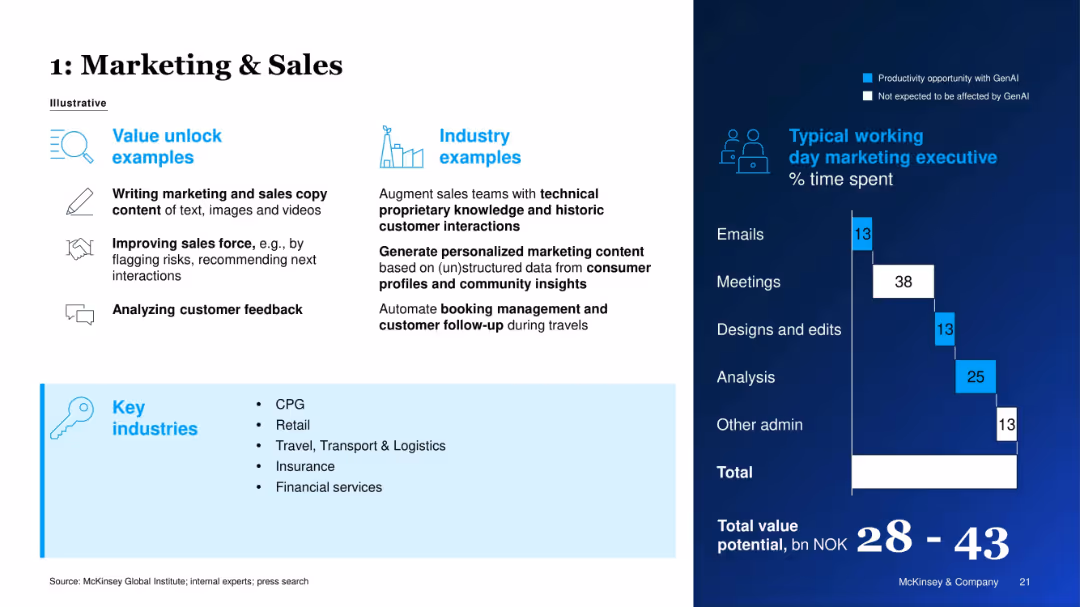
Two-column layout with value unlock examples and industry examples on the left; right side shows time allocation bar chart.
Sales and Business Development
Retail & E-commerce
The slide presents GenAI applications in marketing and sales, including content creation and customer feedback analysis. A time breakdown of a marketing executive’s typical day highlights productivity gains achievable through GenAI. Key industries benefiting include CPG, retail, and financial services.
Marketing, Sales Automation, GenAI Use Case, Productivity, Retail, Time Allocation, Personalization, Industry Application
false
1: Marketing & Sales Source: McKinsey Global Institute; internal experts; press search Not expected to be affected by GenAI ProductivityThe economic potential of Generative AI in Norway
Mixed Chart
McKinsey
View slide
Displays diagrams and lists integrating circular intelligence into business operations, with focus areas like "Target & Performance Management" and "Measure & Monitor."
Technology and Digital Transformation
Environmental Services & Sustainability
Highlights how integrating circular intelligence can drive business value across various operational aspects. This slide is particularly useful for discussions on implementing circular strategies in business processes, enhancing data integration, and driving operational efficiencies.
Circular economy, Business intelligence, Data integration, Operational efficiency, Performance management, Sustainability, Technology integration, Business drivers, Monitoring, Reporting
false
Weaving circular intelligence into core business and across value chain increases transparency, collaboration and unlocksnew business valueNordic Circular Economy Playbook 2.0
Linear Flow
Accenture
View slide
The slide shows a stacked bar graph comparing the office dependency of various industries. The green shades represent different work models from fully remote to fully office-based.
Market Analysis and Trends
Professional Services
This analysis is critical for understanding industry-specific work patterns, potentially used by managers to benchmark their own company's remote work policies.
Industry Comparison, Office Dependency, Work Patterns, Benchmarking, Remote Work
false
Some industries are more dependent on office-based work, while others rely on remote work as primary.Future Workplace Index 2.0
Single Chart
EY
View slide
Line graph comparing market capitalization of companies investing in innovation through a crisis versus the S&P 500 benchmark.
Strategic Planning
Professional Services
Discusses the financial performance of companies that maintain a focus on innovation through economic downturns, showing their market outperformance during and after a crisis.
market cap, innovation, crisis, recovery, S&P 500, financial performance, companies
false
History suggests that companies that invest in innovation through a crisis outperform peers during the recoveryDriving innovation at scale
Single Chart
McKinsey
View slide
Split-screen layout; left section has text on a dark blue background; right side shows a dual-line chart.
Market Analysis and Trends
Government & Public Sector
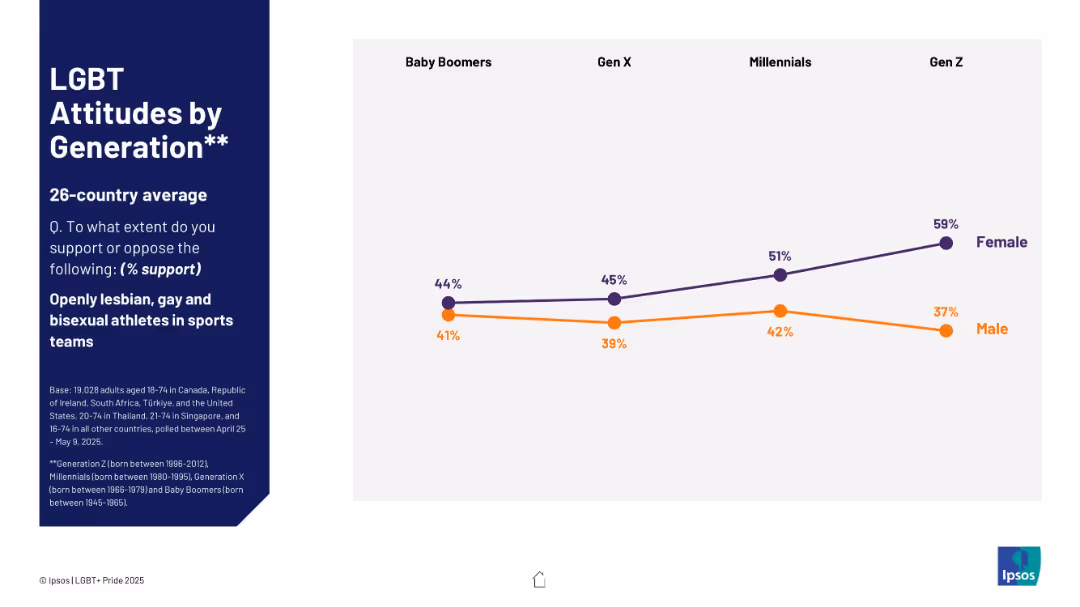
This slide compares generational support for openly LGB athletes in sports teams across four generations. It highlights a consistent gender gap, with women showing higher support across all groups.
LGBT, generation, sports, gender, support, Baby Boomers, Gen X, Millennials, Gen Z, attitudes
false
LGBT Attitudes by GenerationIPSOS LGBT+ PRIDE REPORT 2025
Mixed Chart
IPSOS
View slide
Slide shows column charts tracking material margin over time and a line graph depicting intercompany volumes, supplemented with performance data annotations.
Operational Efficiency
Industrial & Manufacturing
Examines the production efficiency and financial success in the specialty products sector, focusing on trends in material costs and production volumes.
manufacturing, efficiency, production, financial, trends
false
Specialties: Proven ExecutionBarclays CEO Energy – Power Conference
Multiple Chart
Barclays
View slide
The slide features a column chart comparing road freight costs to port across various regions, with contextual annotations on factors influencing costs.
Operational Efficiency
Transportation & Logistics
The slide provides a comparative analysis of road freight costs in Australia and international competitors, highlighting the efficiency and cost advantages of Australia's road freight network.
Road freight, Australia, cost comparison, transportation, logistics, modal share, efficiency, freight network, operational efficiency
false
Australian road freight costs are slightly cheaper than international comparators, owing to high modal share and an efficient road freight networkInternational Comparison of Australia’s Freight and Supply Chain Performance
Mixed Chart
LEK
View slide
The slide features a series of column charts displaying CEOs' views on the benefits of globalization in various areas, with columns color-coded to show different extents of agreement.
Market Analysis and Trends
Financial Services
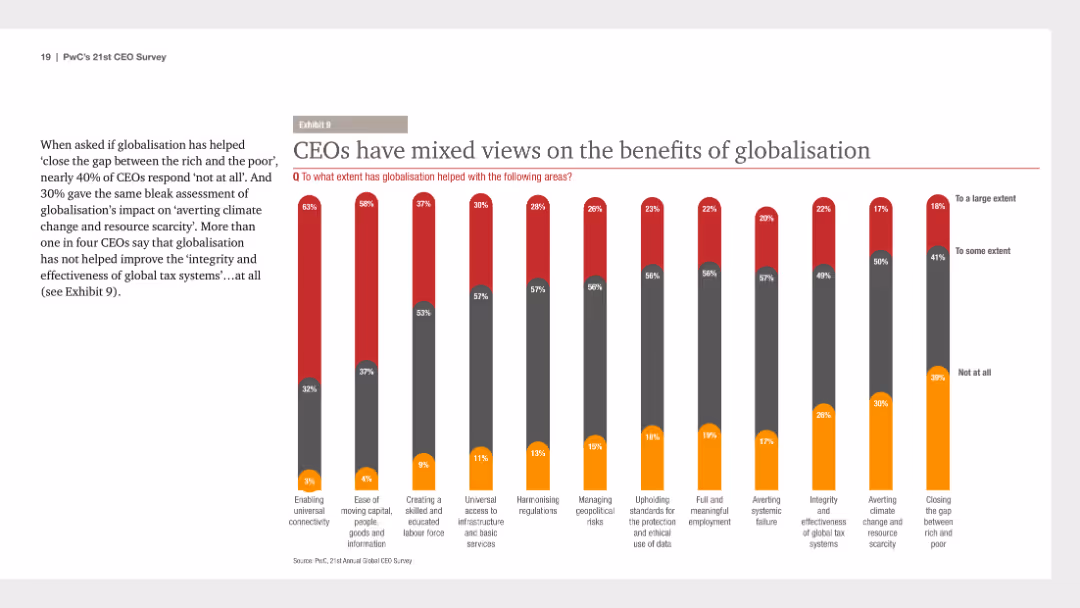
It presents mixed CEO opinions on globalization's benefits, such as enabling connectivity and managing geopolitical risks, useful for understanding diverse viewpoints on globalization impacts.
globalization, CEO views, benefits, market analysis, 2018, column charts, financial survey, PwC, CEO Survey, mixed opinions
false
CEOs have mixed views on the benefits of globalisation21st CEO Survey The Anxious Optimist in the Corner Office
Mixed Chart
PwC/Strategy&
View slide
Features a line graph and small text sections for insights.
Strategic Planning
Technology & Software
Discusses the increasing use of marketing analytics in decision-making processes, with data points over time and projected trends.
Marketing, Analytics, Decision Making, Trends, Projection, Line Graph, Use, Strategic Planning, Data Points
false
Company use of marketing analytics in decision making rises to all time highThe CMO Survey Marketing in a Post Covid Era
Mixed Chart
Deloitte
View slide
The slide is divided into four sections, each with a heading and key figures related to integration priorities like franchise stabilization, funding efficiencies, and balance sheet optimization.
Strategic Planning
Financial Services
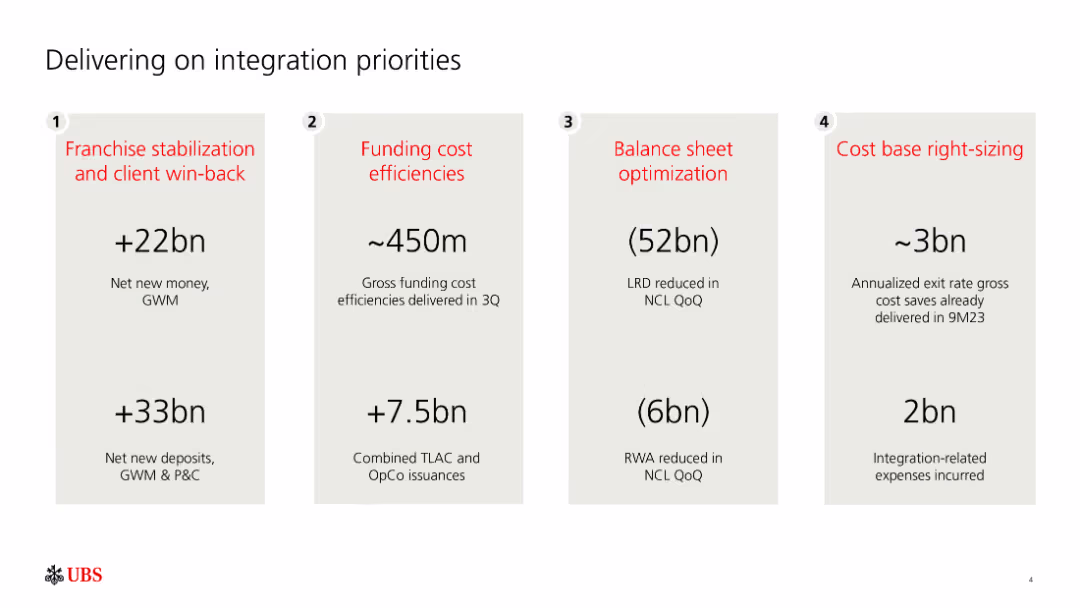
It outlines strategic integration priorities for UBS, presenting key figures and milestones achieved in areas such as client win-back, cost efficiencies, and balance sheet management.
integration, priorities, strategic, franchise, stabilization, funding, efficiencies, balance sheet, UBS
false
Delivering on integration prioritiesThird quarter 2023 Fixed Income investor presentation
Linear Flow
UBS
View slide
The slide contains a vertical bar (column) chart showing the market share of various luxury categories in 2017. It uses icons and text to highlight the categories led by female consumers and the respective compound annual growth rates (CAGR).
Market Analysis and Trends
Retail & E-commerce
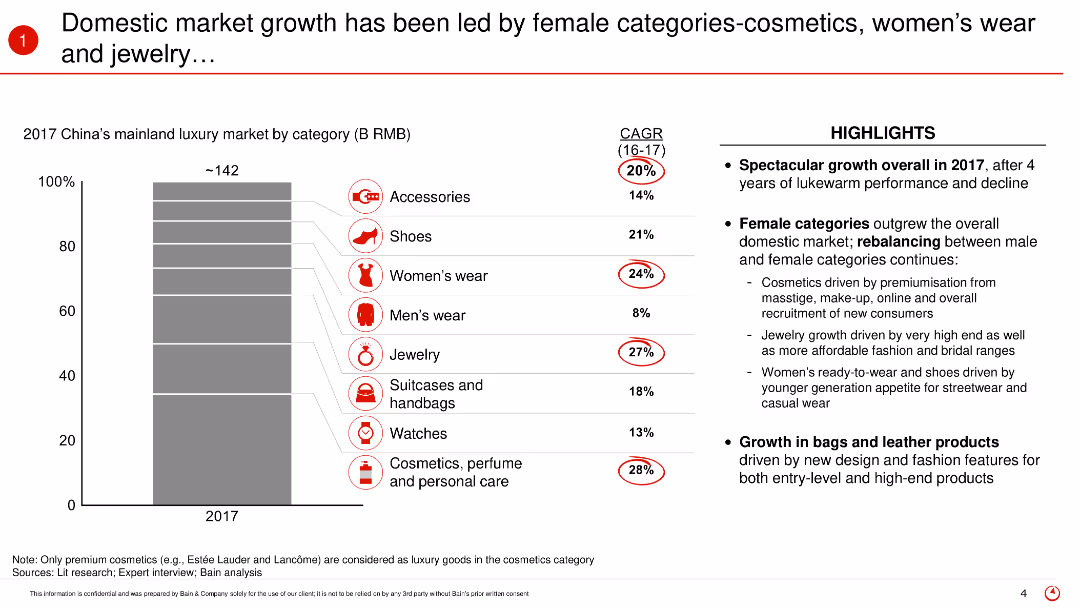
The slide highlights the significant growth in China's luxury market driven by female categories such as cosmetics, women’s wear, and jewelry in 2017. It showcases the compound annual growth rates of these categories and emphasizes the shift in market dynamics towards female-led consumption.
Market growth, luxury market, female consumers, cosmetics, women’s wear, jewelry, China, 2017, market dynamics, CAGR
false
Domestic market growth has been led by female categories-cosmetics, women’s wear and jewelry…2017 China Luxury Market Study
Mixed Chart
Bain
View slide
This Diagram Slide showcases 'Watèa by Michelin' with diagrams and icons, highlighting the transition to electric light commercial vehicles (LCVs). It presents the stakes of this transition, fleet pain points, and Michelin's value proposition. The use of diagrams, pictograms, and a central circular graphic visually conveys the information effectively, with clear labels and a coherent color scheme.
Technology and Digital Transformation
Transportation & Logistics
This slide introduces 'Watèa by Michelin', a solution for decarbonizing urban LCV fleets, addressing the transition to EVs, operational challenges, and financing issues. It emphasizes Michelin’s comprehensive approach, leveraging group assets and partnerships, including a collaboration with Credit Agricole for vehicle financing, to offer a sustainable and operationally efficient fleet management service.
decarbonization, LCV, electric vehicles, urban, fleet management, sustainability, partnership, financing, Michelin
false
Watèa by Michelin: a unique solution to decarbonize urban LCV fleetsRoad Show US West Coast Morgan Stanley
Framework
Morgan Stanley
View slide
A text-focused slide that includes icons representing various product categories to show changes in consumer purchasing trends over time, particularly noting an increase in online grocery shopping.
Operational Efficiency
Retail & E-commerce
Details the evolution of first-time digital consumer purchasing patterns, with a recent uptick in online grocery shopping, reflecting the impact of digital transformation and changing consumer preferences.
Digital consumer, shopping trends, online groceries, Southeast Asia, consumer behavior
false
Five years of digital transformation in a single yearDigital Consumers of Tomorrow, Here Today: A SYNC SOUTHEAST ASIA REPORT
Header Horizontal
Bain
View slide
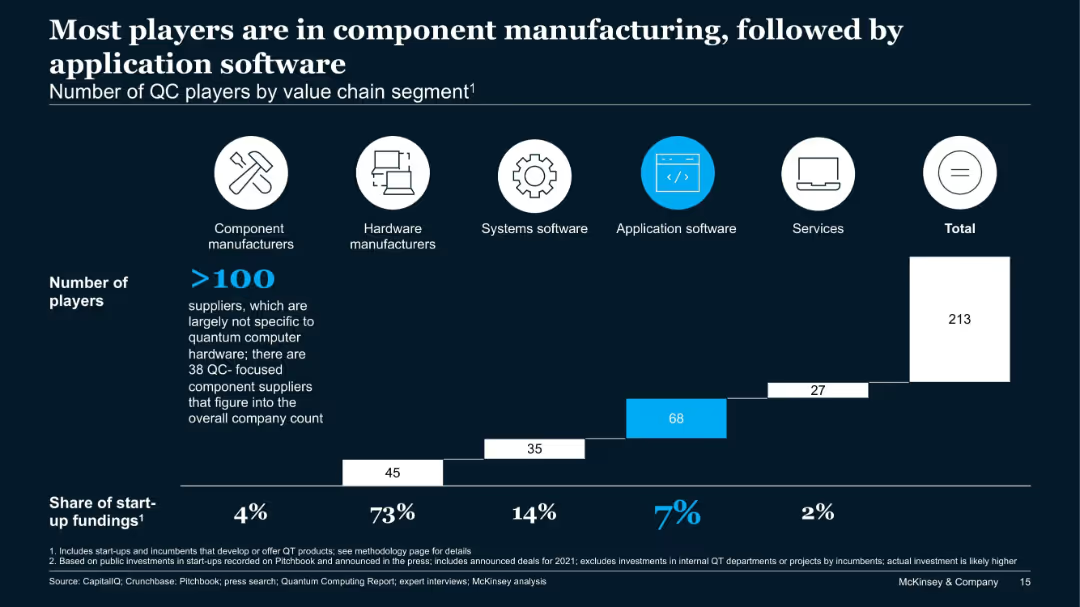
Bar chart showing number of players across five QC value chain segments and their share of start-up funding.
Product and Service Analysis
Technology & Software
This slide analyzes over 213 QC companies by value chain. Component manufacturers dominate in number, while application software sees the second-highest number of firms. However, hardware receives 73% of start-up funding, showing a funding-activity imbalance.
QC players, value chain, hardware, components, application software, start-up funding
false
Most players are in component manufacturing, followed by application softwareThe Quantum Technology Monitor September 2021
Single Chart
McKinsey
View slide
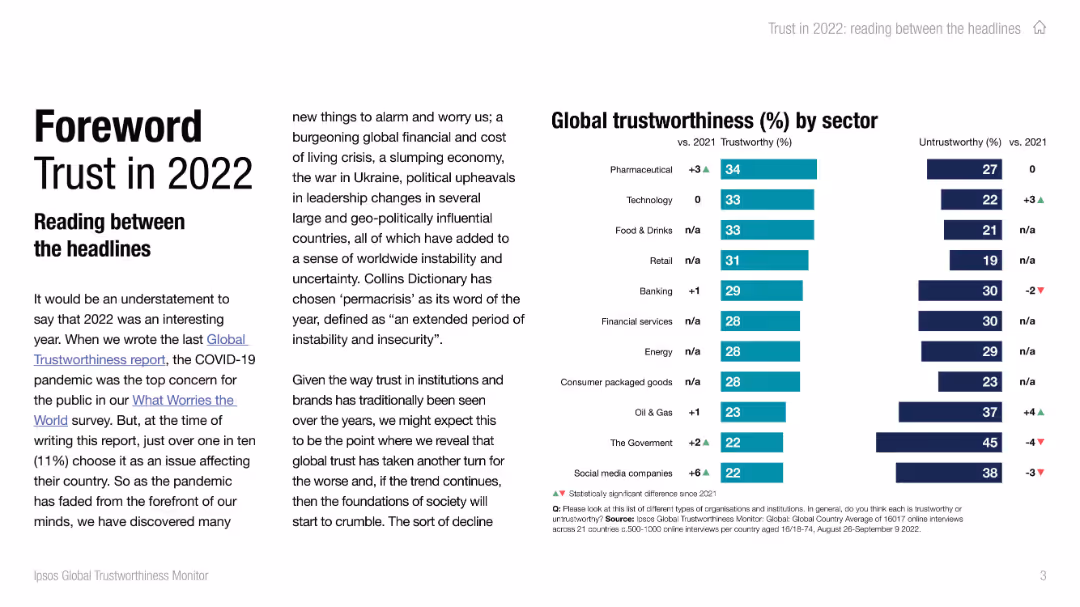
Left side contains text introduction to trust trends with bold title. Right side features a vertical bar chart of trustworthiness by sector.
Industry Overview
Professional Services
The slide introduces the 2022 trust report, highlighting the concept of 'permacrisis' and global unease. The bar chart ranks sectors by perceived trustworthiness, with pharmaceuticals and technology at the top, and government and social media companies at the bottom. Comparisons with 2021 are also shown.
trustworthiness, sectors, 2022 trends, public opinion, pharmaceuticals, technology, government, social media
false
Foreword: Trust in 2022IPSOS GLOBAL TRUSTWORTHINESS MONITOR
Mixed Chart
IPSOS
View slide
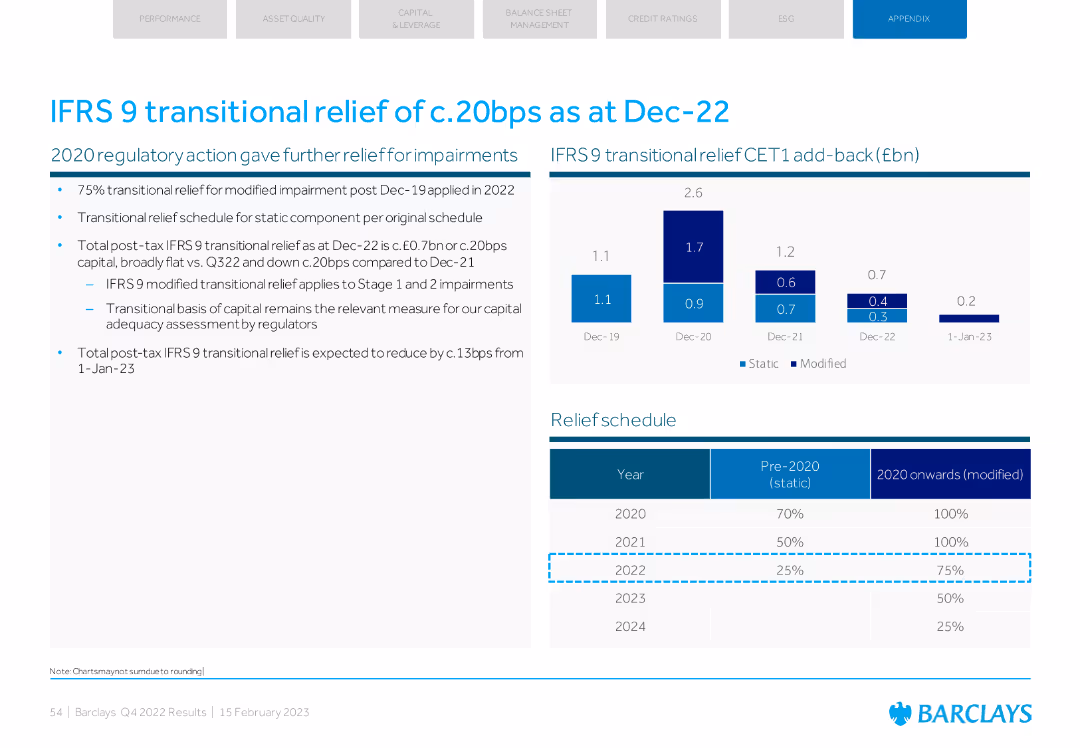
Column charts showing transitional relief impact and a table with the relief schedule.
Regulatory and Compliance
Financial Services
Details the impact of IFRS 9 transitional relief on Barclays' CET1 capital and outlines the expected schedule for reducing this relief in future years.
IFRS 9, transitional relief, CET1, schedule, capital
false
IFRS 9 transitional relief of c.20bps as at Dec-22Barclays PLC Q4 2022 Fixed Income Investor Presentation
Mixed Chart
Barclays
View slide
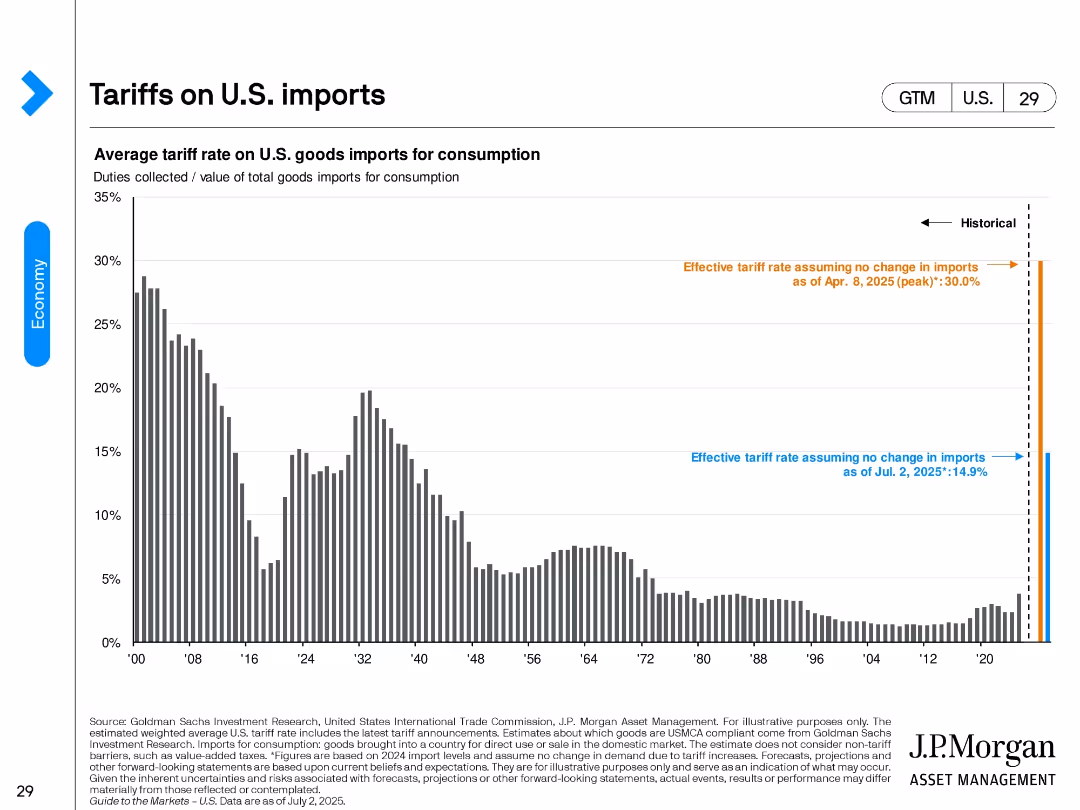
A vertical bar chart displaying the historical average tariff rates on U.S. imports with 2025 estimates highlighted using color-coded annotations.
Regulatory and Compliance
Government & Public Sector
This slide shows average tariff rates on U.S. imports for consumption from 1900 to 2025. It includes forecasts for 2025 assuming no change in imports and illustrates the spike in effective tariff rates under new policy conditions.
tariffs, trade, imports, regulation, policy, duties, 2025 forecast, economic impact
false
Tarrifs on U.S. importsGuide to the Markets U.S. 3Q 2025
Single Chart
JP Morgan
View slide
Contains multiple screenshots showcasing mobile payment options across different regions (U.S., Asia, Mexico) with a side layout of mobile interfaces and column charts depicting growth in installment sales. The slide is well-organized into distinct sections for clarity.
Operational Efficiency
Financial Services
Focuses on the implementation of point-based payments via mobile, displaying significant cost savings and efficiency improvements in card services. It shows the impact of digital integration on spending habits and lending practices, demonstrating the operational efficiency gained.
mobile payments, cost savings, operational efficiency, digital transformation, lending
false
Cards: Innovating to Grow Both Spend and LendGlobal Consumer Banking
Mixed Chart
Citigroup
View slide
This slide displays a world map highlighting various countries with specific projects labeled, alongside a list of project details, using color codes for integration level and project phase.
Strategic Planning
Energy & Utilities
Discusses upcoming SURF projects worldwide, indicating the company's global reach and strategic engagements in various stages of development, which are crucial for understanding market opportunities and planning.
SURF projects, global, strategy, market opportunities
false
Outlook: Greenfield SURF projects to be awarded to marketBarclays CEO Energy-Power Conference 2019
Graphic
Barclays
View slide
Column chart showing steps towards achieving a 15% return on CET1 capital, with annotations for different strategic initiatives.
Financial Performance
Financial Services
Details the strategic initiatives for improving return on CET1 capital, including cost base right-sizing and balance sheet optimization.
return, CET1, capital, cost, optimization
false
Working towards ~15% RoCET1Second quarter 2023 Fixed Income investor presentation
Mixed Chart
UBS
View slide
Consists of blue column charts for different sectors of digital financial services (DFS), including digital payments and lending. Each chart has clear labels and growth percentages. Source by Bain analysis.
Market Analysis and Trends
Financial Services
This slide details the rapid growth trajectory of Vietnam's DFS against a previously low baseline, highlighting potential areas for digital innovation and investment in the financial sector.
Vietnam, Digital Financial Services, Growth Analysis, Digital Payments, Digital Lending, Insurance, Wealth, Market Trends, Innovation, Financial Technology
false
Vietnam Steep growth in DFS on top of a low basee-Conomy SEA 2023 report: Vietnam
Multiple Chart
Bain
View slide
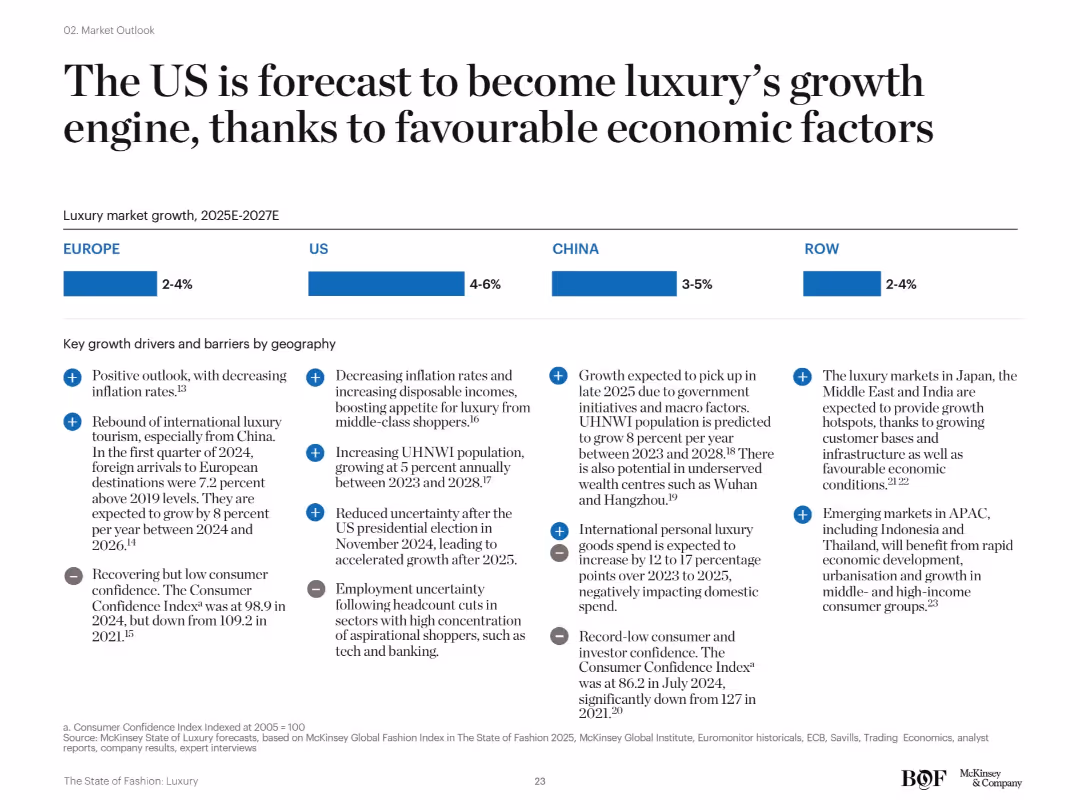
Simple layout with region-wise bar segments (Europe, US, China, RoW) and bullet points listing economic and demographic growth factors and risks by region.
Strategic Planning
Consumer Goods
This slide positions the US as the key growth driver for the luxury sector between 2025–2027, aided by macroeconomic stability, lower inflation, and growing UHNW populations. Other regions are expected to show mixed or limited recovery due to consumer confidence and geopolitical risks.
US growth, macro factors, consumer confidence, luxury drivers, forecast, global regions
false
The US is forecast to become luxury’s growth engine, thanks to favourable economic factorsThe State of Fashion Luxury
Mixed Chart
McKinsey
View slide
Provides two column charts showing the percentage of companies in various French regions, and a column chart summarizing the key factors influencing regional business locations.
Market Analysis and Trends
Real Estate & Construction
Analyzes geographical distribution of companies across French regions and the main factors determining business locations, emphasizing the prominence of Ile-de-France.
regional analysis, business location, France, geographical factors, economic environment, workforce, infrastructure, regional attractiveness, company distribution
false
Ile-de-France retains its first place in regional attractiveness thanks to its advantageous geographical locationBAROMETER AmCham-Bain 2024
Multiple Chart
Bain
View slide
Describes DEI initiatives, including tying executive compensation to DEI goals and fostering an inclusive culture.
Strategic Planning
Professional Services
Highlights DEI as a key element of the firm's growth plans and client mission needs.
DEI, diversity, equity, inclusion, leadership, innovation
false
Diversity, Equity, & Inclusion2022 Environmental, Social, Governance Report
Text Only
Booz Allen Hamilton
View slide
Flow chart and images detail the value chain from satellite manufacturing to end-user services, with a focus on Earth Observation.
Market Analysis and Trends
Technology & Software
Discusses the stages of the Earth Observation value chain and its economic implications across different sectors.
Earth observation, value chain, economic impact, data services
false
The 3 stages of the Earth Observation value chainCOPERNICUS Market report February 2019
Vertical Flow
PwC/Strategy&
View slide
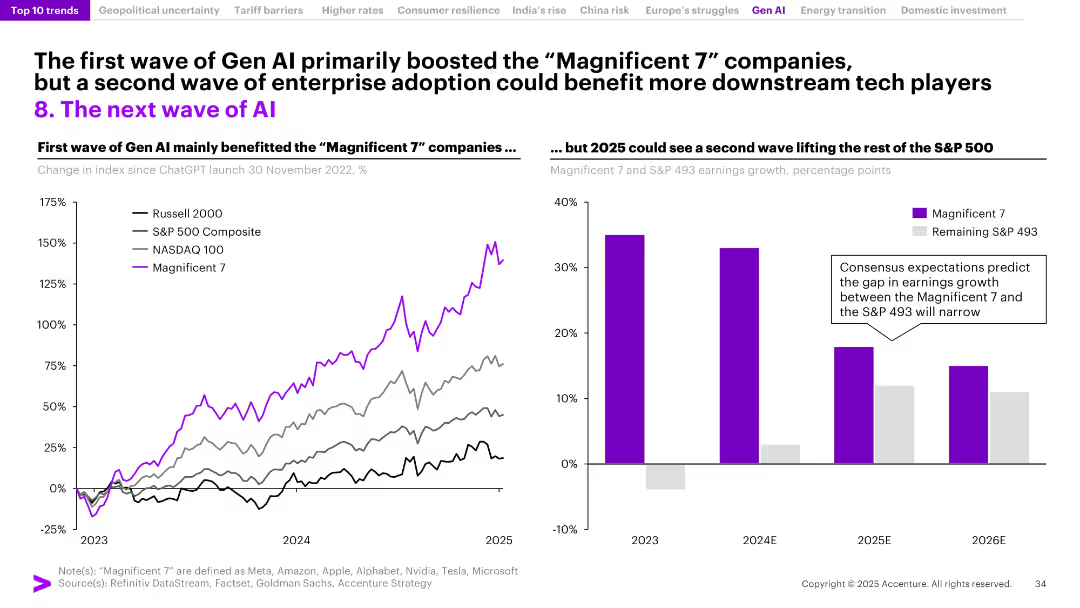
Two-part layout: left graph of index growth post-Gen AI launch; right bar chart comparing Magnificent 7 vs. S&P 493 earnings growth.
Technology and Digital Transformation
Artificial Intelligence
This slide contrasts the Gen AI-driven boom of the Magnificent 7 stocks with forecasts for broader adoption. It suggests that while early gains were concentrated in tech giants, enterprise AI adoption in 2025 may distribute benefits more evenly across the S&P 500.
Gen AI, Magnificent 7, S&P 500, earnings growth, stock indices, enterprise AI, adoption wave, technology sector, market trends
false
The first wave of Gen AI primarily boosted the “Magnificent 7” companies, but a second wave of enterprise adoption could benefit more downstream tech playersJanuary Macro Brief
Multiple Chart
Accenture
View slide
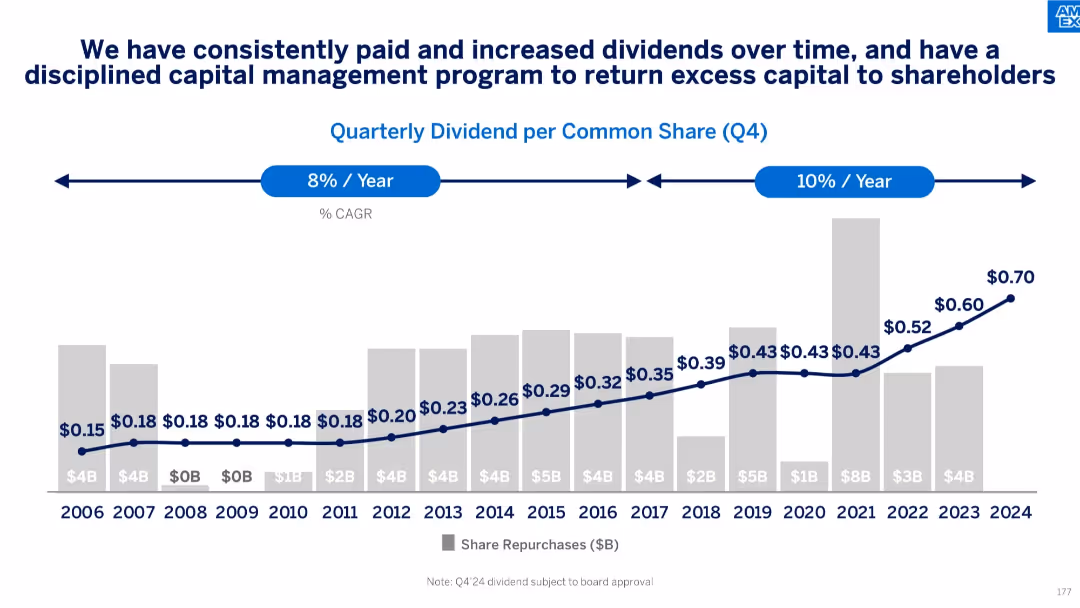
Bar and line chart showing quarterly dividend per share (Q4) and annual share repurchases from 2006–2024
Financial Performance
Financial Services
Depicts American Express’s long-term commitment to shareholder returns through growing dividends and consistent share repurchases. Shows CAGR trends for dividend growth, reflecting disciplined capital allocation.
dividends, capital return, shareholder value, share repurchases, dividend growth, financial strategy
false
We have consistently paid and increased dividends over time, and have a disciplined capital management program to return excess capital to shareholdersAmerican Express Investor Day 2024
Single Chart
McKinsey
View slide
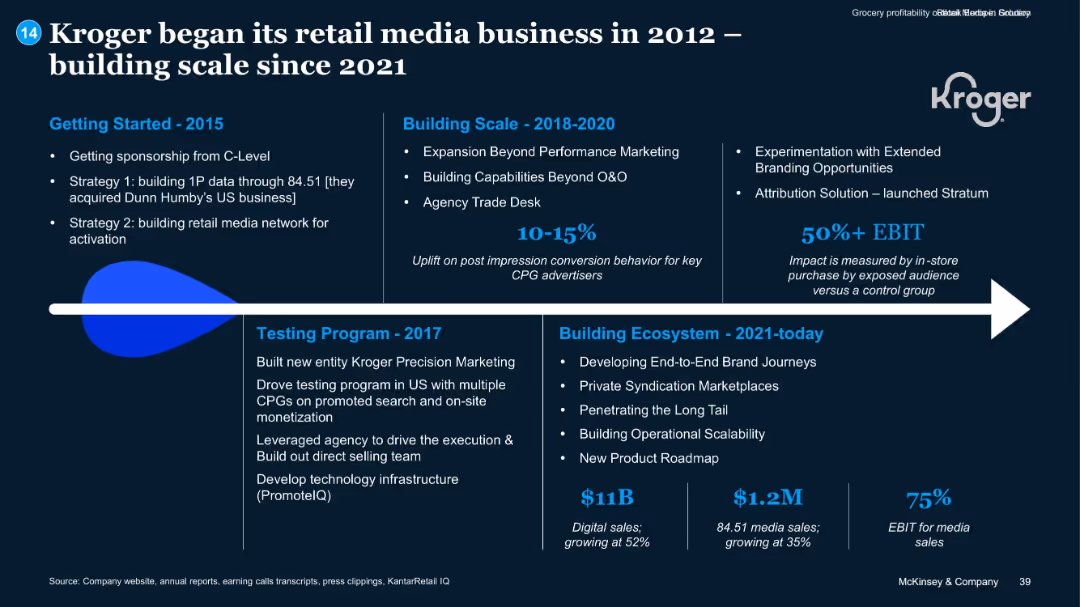
Timeline format; segmented into years with supporting text blocks; highlights and metrics in blue
Client Case Studies
Retail & E-commerce
The slide traces Kroger’s retail media journey from 2012, emphasizing milestones such as 1P data acquisition, performance marketing, attribution solutions, and recent scale. It showcases strategic investments and results like EBIT impact, digital/media sales, and growth figures.
Kroger, Retail Media, Digital Sales, EBIT, 1P Data, Strategy
false
Kroger began its retail media business in 2012 – building scale since 2021Grocery profitability outlook –Europe
Linear Flow
McKinsey
View slide
The slide has multiple charts and diagrams illustrating wealth and asset managers' growing interest in Generative AI (GenAI) solutions. It includes pie charts, bar charts, and text explaining the benefits and investment in GenAI.
Technology and Digital Transformation
Financial Services
The slide highlights survey findings on the adoption of GenAI solutions by wealth and asset managers. It details the benefits of GenAI, investment plans, and the anticipated impact on various aspects of financial services.
GenAI, wealth managers, asset managers, investment, benefits, AI adoption, financial services, survey, impact
false
Wealth and asset managers demonstrate growing interest in GenAI solutions, anticipate enhanced client experiences and have begun deploying dedicated resourcesGenerative AI in wealth and asset management
Multiple Chart
EY
View slide
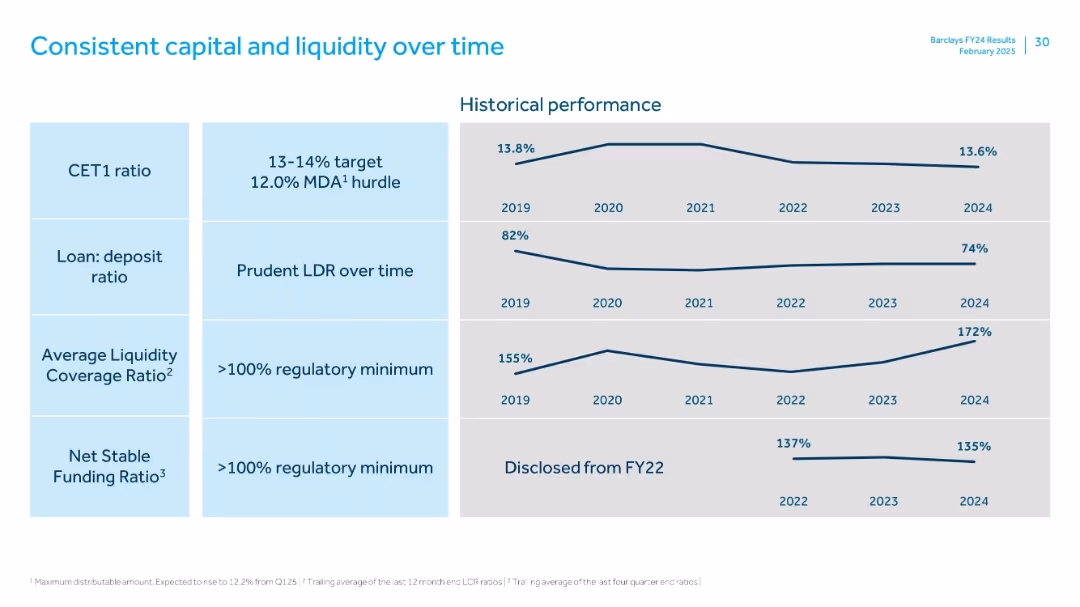
Grid layout with four metrics: CET1 ratio, loan:deposit ratio, liquidity coverage ratio, and funding ratio. Each metric has a trend line from 2019–2024.
Regulatory and Compliance
Financial Services
The slide highlights long-term stability in Barclays' capital and liquidity metrics. CET1 ratio stays within target range; LDR remains conservative; liquidity and funding ratios consistently exceed regulatory minimums.
CET1, LDR, LCR, NSFR, capital, liquidity, funding, 2024 trends
false
Consistent capital and liquidity over timeFY 2024 Results Presentation
Single Chart
Barclays
View slide
This slide contains text and multiple icons with a central photo of a surveyor. It highlights infrastructure projects in the Philippines under the "Build, Build, Build" program.
Market Analysis and Trends
Real Estate & Construction
Discusses the Philippines' infrastructure development, including major projects like the Metro Manila Subway and improvements across various regions.
infrastructure, Philippines, development, projects, construction
false
A key pillar of the incumbent administration’s economic plan is the Build, Build, Build Program, which aims to improve transport efficiency, market opportunities, and overall productivity by ushering in the Philippines’ ‘golden age of infrastructure.’ In 2021Doing business in the Philippines 2021
Graphic
Deloitte
View slide
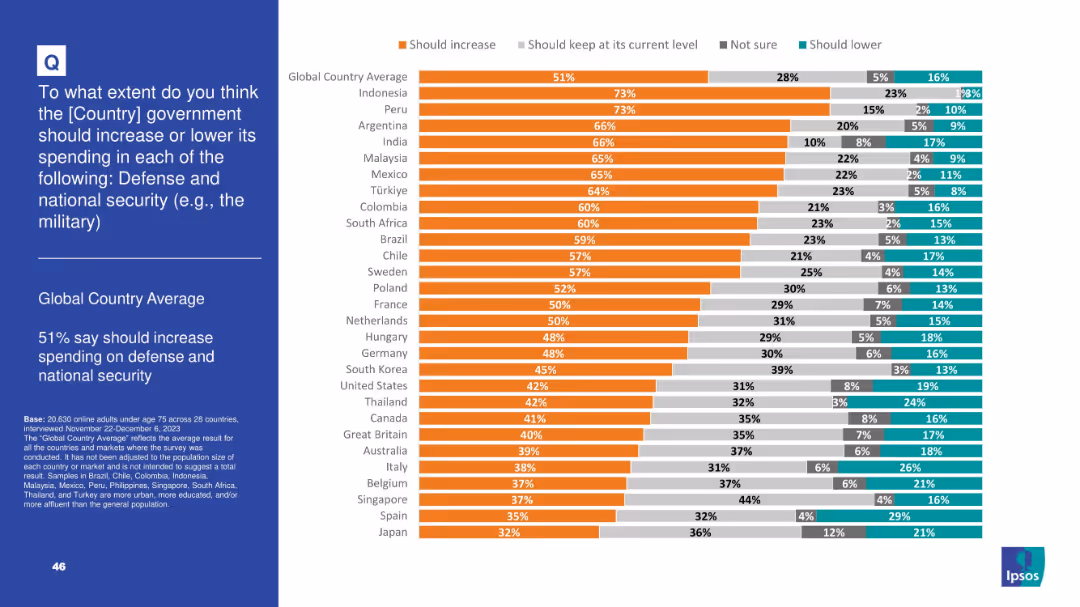
Orange-dominant bar chart showing country-level agreement on boosting defense spending; includes categories: increase, same, unsure, decrease
Strategic Planning
Government & Public Sector
A smaller majority (51%) globally favor increased defense and national security spending. Countries like Indonesia and Peru show highest support, while Japan and Spain express the lowest. Indicates regional variations in perceived threat levels.
defense, military, national security, public opinion, government budget, threat perception, Ipsos, geopolitics, spending
false
Should increase spending on defense and national securityIPSOS POPULISM SURVEY
Mixed Chart
IPSOS
View slide
A column graph with annotations displays the shift in venture deal mix by investment round, highlighting the movement away from early-stage funding.
Investment Analysis
Technology & Software
This slide analyzes changes in the investment round mix within the technology sector, pointing out a significant shift from early-stage Angel and Seed funding towards later-stage investments. It discusses the volatility and the strategic adjustments in venture capital allocations in response to market conditions and the startup ecosystem's evolution.
funding shift, Angel funding, Seed funding, investment rounds, venture capital
false
There has been a shift in funding round mix, away from early-stage Angel and Seed fundingAssessing the Impact of Big Tech on Venture Investment
Single Chart
Oliver Wyman
View slide
This slide includes a blue pie chart detailing net revenue mix, with comparative financial performance data from two consecutive years on a light background.
Financial Performance
Financial Services
Discusses the revenue growth and improvements in key financial metrics over the years, demonstrating the advantages of a diversified franchise.
Diversification, Revenue, Performance, Metrics, Growth, Financial, Franchise
false
Benefits of a Diversified Franchise Key metricsGoldman Sachs Presentation to Credit Suisse Financial Services Conference
Mixed Chart
Goldman Sachs
View slide
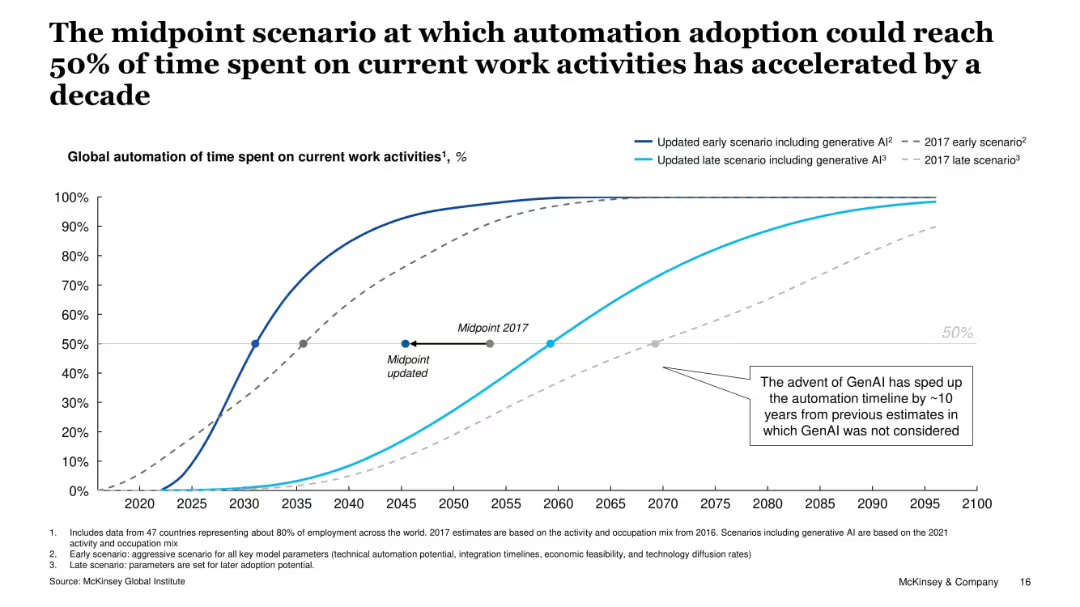
Line graph comparing early and late scenarios of automation adoption (2017 vs. updated with GenAI); includes a 50% midpoint marker and explanatory callouts.
Market Analysis and Trends
Artificial Intelligence
This slide shows how generative AI has accelerated the automation timeline by a decade, with projections showing 50% of work activities becoming automated as early as 2030 in the updated scenario. The chart visually contrasts the 2017 and updated projections using solid and dashed lines.
Automation, Generative AI, Future of Work, Adoption Timeline, Productivity, AI Forecast, Midpoint, Workforce, Labor Trends, McKinsey
false
The midpoint scenario at which automation adoption could reach 50% of time spent on current work activities has accelerated by a decadeThe economic potential of Generative AI in Norway
Single Chart
McKinsey
View slide
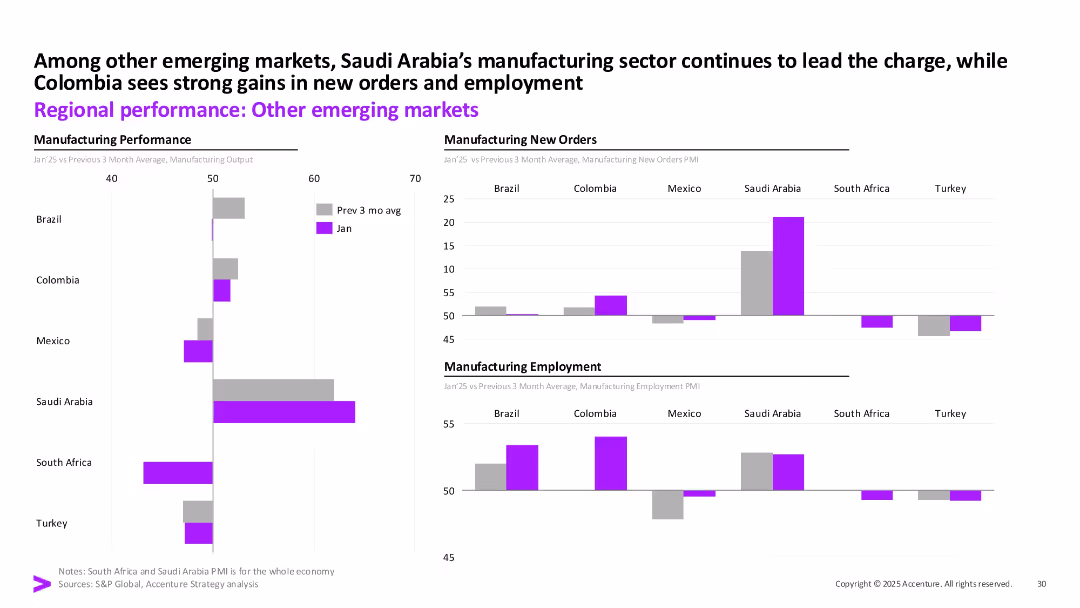
Three-column layout with bar charts showing output, new orders, and employment for emerging markets; data for Jan vs. 3-month avg.
Industry Overview
Industrial & Manufacturing
Saudi Arabia leads in manufacturing strength among emerging markets, with Colombia also showing strong gains. Other countries exhibit mixed or declining trends, particularly in new orders and employment.
Emerging Markets, Manufacturing, Saudi Arabia, Colombia, PMI, Output, Employment, Accenture
false
Among other emerging markets, Saudi Arabia’s manufacturing sector continues to lead the charge, while Colombia sees strong gains in new orders and employmentFebruary Macro Brief
Multiple Chart
Accenture
View slide
The slide features a vertical column chart illustrating the progress towards a 15% return on CET1 capital by 2026.
Financial Performance
Financial Services
This slide describes the target of achieving a 15% RoCET1, outlining steps and expected financial outcomes.
RoCET1, CET1 capital, financial targets, cost savings, capital returns
false
Working towards ~15% RoCET1Third quarter 2023 Fixed Income investor presentation
Mixed Chart
UBS
View slide
Features a column chart illustrating brands' top priorities for sustainability efforts, with explanatory text.
Market Analysis and Trends
Professional Services
This slide outlines the top sustainability priorities for brands, including internal practices, product offerings, and long-term commitments.
sustainability, brands, professional services, market trends, internal practices
false
FIGURE 1: Brands’ top priorities for their sustainability e orts in 20222023 Global Marketing Trends
Mixed Chart
Deloitte
View slide
This slide displays a combination of column charts and line graphs in a blue and white color palette, projecting the growth of the Philippines' digital economy, specifically highlighting e-commerce, transport & food, online travel, and online media sectors. Each sector's growth trajectory from 2021 to 2030 is clearly shown, with annotations for compounded annual growth rates (CAGR).
Market Analysis and Trends
Retail & E-commerce
This slide analyzes the anticipated growth of the digital economy in the Philippines, with a projection of reaching approximately $35 billion by 2025, driven by e-commerce. It serves as an analytical tool for market researchers, strategists, and business development professionals to identify trends and investment opportunities within the digital marketplace of the Philippines.
Philippines, Digital Economy, E-commerce, Growth, Projection, CAGR, Online Travel, Media, Transport
false
Philippines Philippines is expected to continue its double-digit climb towards ~$35B by 2025, largely fueled by e-commercee-Conomy SEA 2023 report: Philippines
Multiple Chart
Bain
View slide
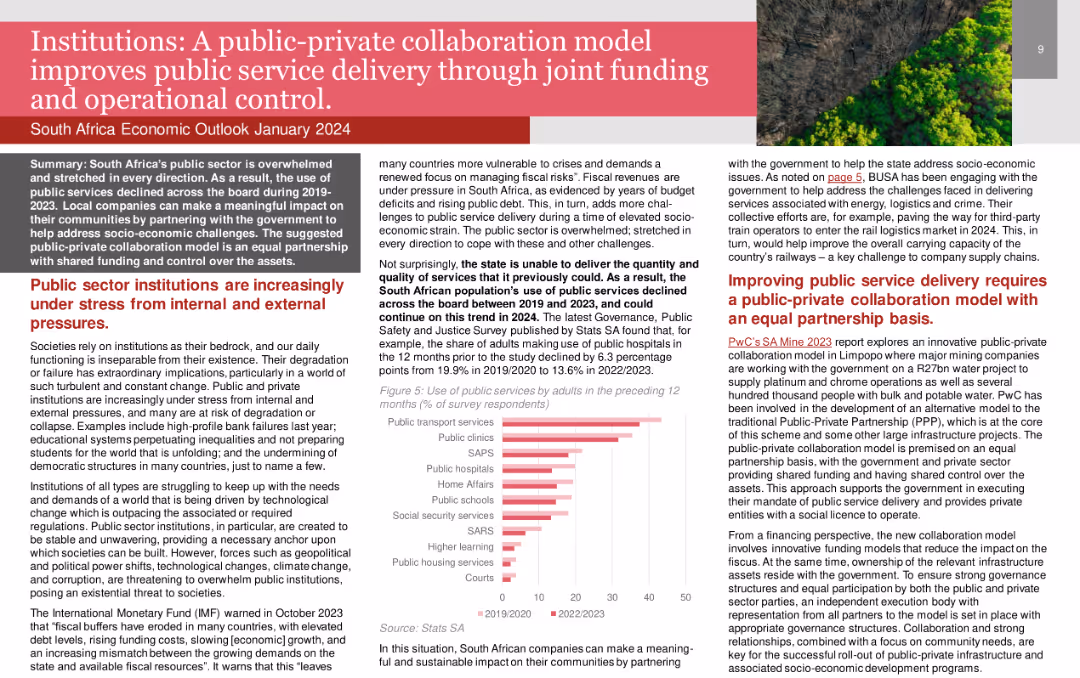
The slide features a title in a red banner, text boxes with detailed content, and a column chart illustrating the use of public services by adults. The layout is dense and informative.
Strategic Planning
Government & Public Sector
The slide discusses the benefits of public-private collaboration in enhancing public service delivery. It outlines the stress public sector institutions face and the potential of collaboration to address socio-economic challenges.
public-private collaboration, public service, operational control, government, institutions
false
Institutions: A public private collaboration model improves public service delivery through joint funding and operational control.South Africa Economic Outlook 2024 Turning short-term crises into opportunities for business value creation and societal impact.
Mixed Chart
PwC/Strategy&
View slide
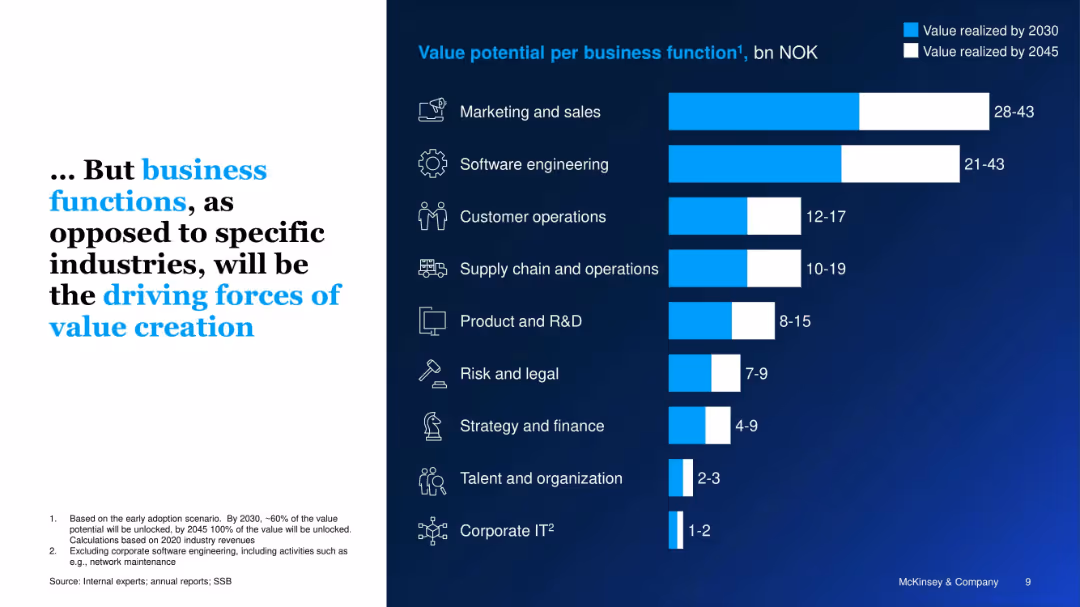
Mirror design to previous slide; bar chart shows value potential by business function (not industry). Blue/white bars differentiate timelines.
Strategic Planning
Artificial Intelligence
The slide argues that GenAI’s greatest value will come from business functions like marketing, software engineering, and operations rather than specific industries, estimating NOK 28–43 billion in marketing alone.
business functions, GenAI, marketing, operations, Norway, productivity, value creation, software
false
… But business functions, as opposed to specific industries, will be the driving forces of value creationThe economic potential of Generative AI in Norway
Single Chart
McKinsey
View slide
A slide with multiple data presentations: bar graphs and a line graph, along with text explanations.
Risk Assessment and Management
Financial Services
This slide discusses commercial real estate (CRE) loan portfolios, risk management, and market competition. It's used for financial analysis and risk assessment in real estate banking.
CRE, Risk Management, Portfolio, Loans, Market, Banking, Real Estate, Analysis
false
Maintaining risk discipline – CRECOMMERCIAL BANKING 2020
Multiple Chart
JP Morgan
View slide
It contains a bar graph and a pie chart depicting the market size for ride-hailing and food delivery services, with a focus on tier 2 and tier 3 cities.
Market Analysis and Trends
Transportation & Logistics
Exploring the market size and potential for ride-hailing and food delivery services in tier 2 and tier 3 cities, this slide suggests that market growth may be limited due to lower importance of convenience in these areas, relative to tier 1 cities. It could be used for strategic decisions in market penetration and service offerings based on regional convenience factors.
Ride-Hailing, Food Delivery, Market Size, Growth Limitations, Convenience, Tier Cities
false
The growth of ride-hailing and food delivery will be limited in tier 2 and tier 3 cities as the importance of convenience is lower.Unlocking the next wave of digital growth: beyond metropolitan Indonesia
Mixed Chart
Kearney
View slide
This slide presents a single column chart tracking the revenues from FICC intermediation over several years. The visual is clear with bold labeling for each year, and a consistent blue color scheme representing data. The simplicity of the design aids in focusing on the trend of revenue durability.
Sales and Business Development
Financial Services
Assesses the stability of revenues in Global Banking & Markets, highlighting the trends in FICC intermediation, suitable for discussions on financial stability and long-term revenue planning.
FICC, revenue stability, long-term trend
false
FICC intermediationGlobal Banking & Markets
Single Chart
Goldman Sachs
View slide
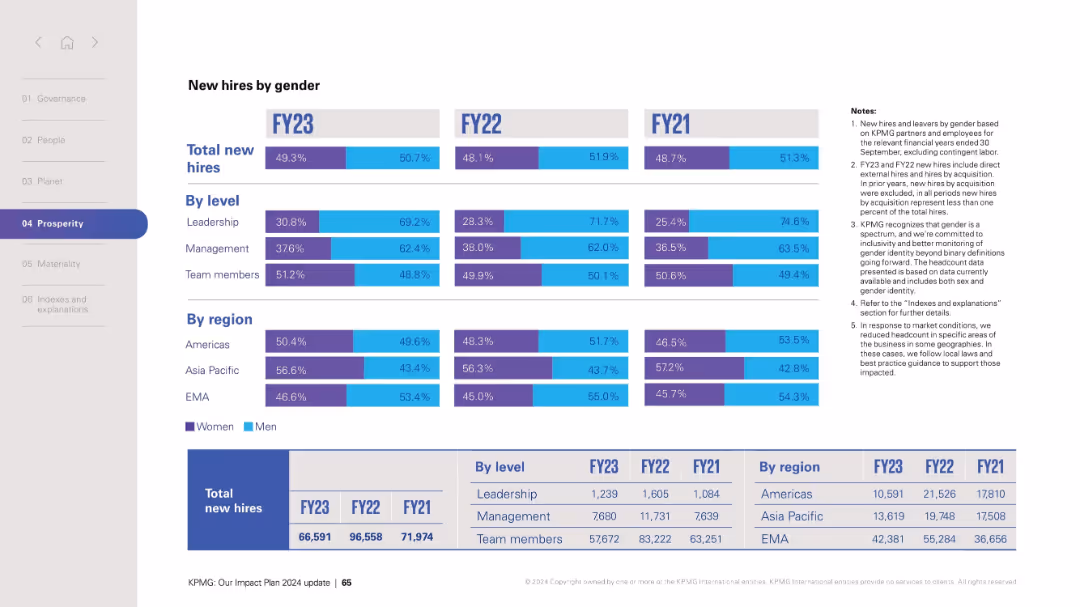
Matrix of horizontal bar charts segmented by FY and subcategories (level and region); notes on the right.
Human Resources and Talent Management
Professional Services
Provides gender distribution of new hires across leadership, management, and team levels as well as across regions (Americas, Asia Pacific, EMA) over three fiscal years. Includes raw numbers at the bottom and notes explaining definitions and methodology. Indicates a push for inclusivity and gender balance across the organization.
gender diversity, hiring, workforce, leadership, regions, inclusion, HR, FY metrics, equality, statistics
false
New hires by genderKPMG: Our Impact Plan 2024 update
Mixed Chart
KPMG
View slide
The slide includes text sections and a column chart showing the frequency of responding to work emails/messages outside normal working hours for Gen Zs and Millennials. It is organized to emphasize the challenges of disconnecting from work.
Operational Efficiency
Professional Services
This slide explores the impact of "always-on" workplaces on Gen Zs and Millennials, highlighting the frequency of responding to work communications outside normal hours and the main reasons behind this behavior, illustrating the struggle to disconnect from work.
Always-on, workplaces, disconnect, work emails, Gen Z, Millennials
false
“Always-on” workplaces make it hard for many to disconnect2023 Gen Z and Millennial Survey
Multiple Chart
Deloitte
View slide
Bar chart showing industry growth expectations and inflation sentiment. Majority bars are green and blue indicating positive/accurate sentiment.
Market Analysis and Trends
Financial Services
This slide presents industry growth expectations for 2023 and respondents' sentiments on inflation rates, suggesting that most expect growth despite low reported inflation.
Industry growth, inflation, expectations, sentiment, 2023, survey, respondents, positive, accuracy
false
Despite the sentiment that reported inflation rates are too low, companies still expect their industries to grow in 2023How will you reframe your future?
Multiple Chart
EY
View slide
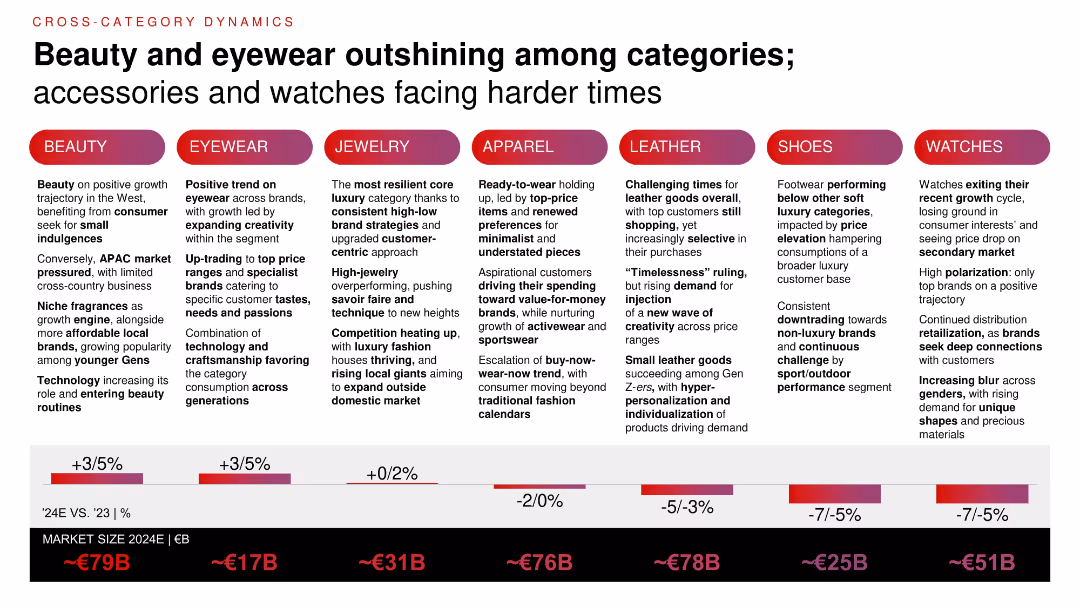
Comparative layout by category with % growth projections (2024E vs. 2023) and market size estimates; includes vertical columns of insights by product segment.
Product and Service Analysis
Consumer Goods
Beauty and eyewear are performing best among luxury categories in 2024, while watches, shoes, and leather goods are under pressure. The slide compares category dynamics, market sizes, and evolving consumer preferences, especially among younger buyers.
beauty growth, eyewear, category trends, personal luxury, Gen Z, market size, product comparison
false
Beauty and eyewear outshining among categories; accessories and watches facing harder timesGood times for a change
Mixed Chart
Bain
View slide
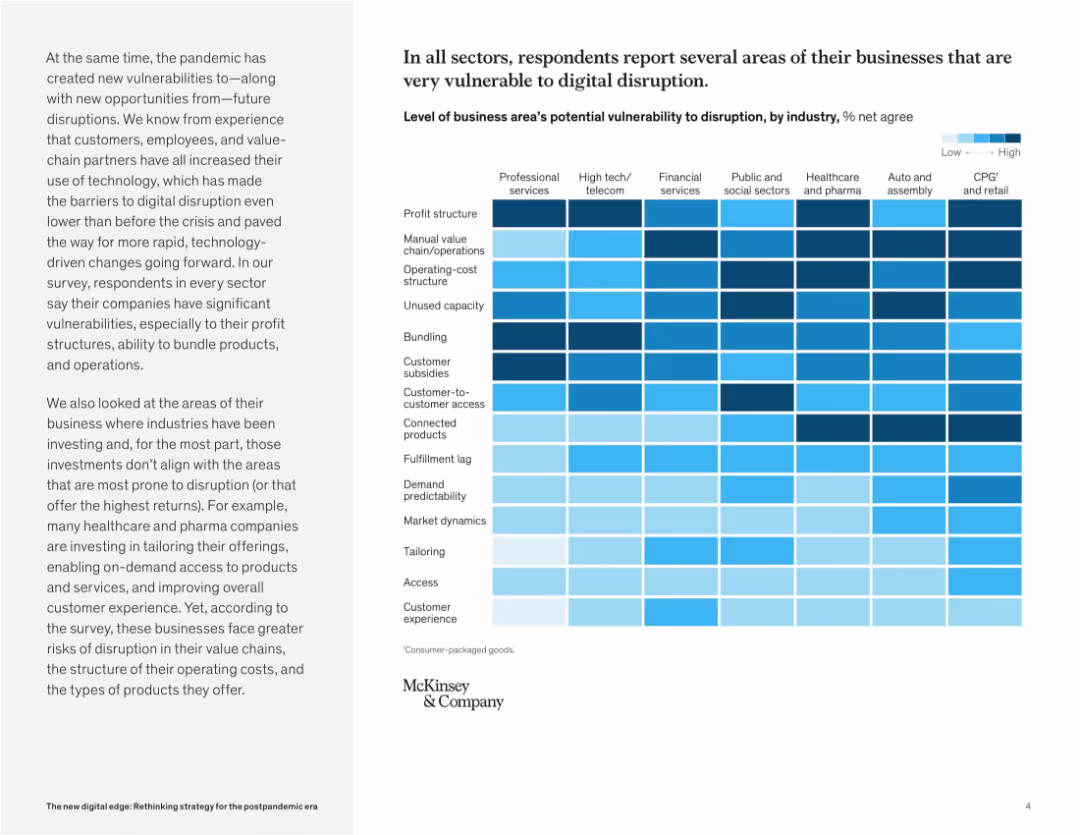
Heatmap chart dominates the right side, showing digital vulnerability levels by business area and industry. Left panel provides context and insights.
Risk Assessment and Management
Technology & Software
This slide presents a heatmap revealing how vulnerable different industries are to digital disruption. Profit structures, customer access, and bundling are common weak points. The chart emphasizes where companies may face operational or structural threats.
digital disruption, business risk, vulnerability, industry comparison, technology impact, customer access, operations, transformation
false
In all sectors, respondents report several areas of their businesses that are very vulnerable to digital disruption.The new digital edge: Rethinking strategy for the postpandemic era
Mixed Chart
McKinsey
View slide
Features tables and lists describing efficiency measures, capital efficiency, and revenue growth strategies, with a breakdown of financial figures.
Strategic Planning
Financial Services
This slide outlines the bank's strategic initiatives aimed at enhancing operational efficiency, optimizing capital use, and driving revenue growth, along with specific financial targets and achievements.
Strategy, Efficiency, Capital, Revenue, Financial Targets, Operational, Growth
false
Accelerated execution of strategic agenda driving returnsAccelerated execution of Global Hausbank strategy to drive returns
Mixed Chart
Deutsche Bank
View slide
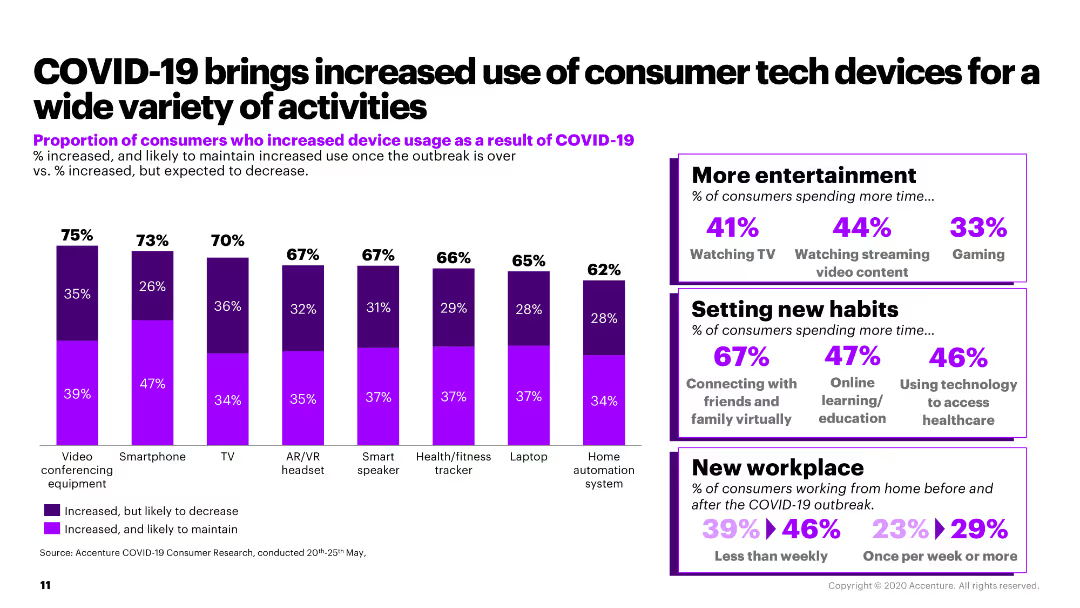
The slide includes a column chart illustrating the increase in usage of various consumer tech devices and a sidebar with additional statistics on consumer habits.
Market Analysis and Trends
Retail & E-commerce
The slide discusses the increased use of consumer tech devices for activities like video conferencing and gaming due to COVID-19, with supporting statistics.
consumer tech, COVID-19, device usage, video conferencing, consumer habits
false
COVID 19 brings increased use of consumer tech devices for a wide variety of activitiesHow will COVID-19 change the consumer?
Mixed Chart
Accenture
View slide
Consistent with slides 2962, 2963, and 2966, this slide shares the same style and cyclical arrows design. The gray color scheme is used throughout, and the slide number is 9.
Market Analysis and Trends
Financial Services
This slide reinforces the key themes of market structure evolution, likely serving as a concluding summary of the discussed catalysts and trends within the series.
summary, market structure, trends, evolution
false
Market Structure Evolution: Catalysts and Secular TrendsGoldman Sachs Investor Day
Linear Flow
Goldman Sachs
View slide
The slide features a comparative column chart depicting expense growth, a sidebar with key strategic points, and a blue background. The column chart contrasts the company's low expense growth against the peer average, using shades of blue to differentiate the data. The sidebar uses icons and bullet points to concisely present information.
Operational Efficiency
Financial Services
This slide outlines Fifth Third's expense management strategy, emphasizing its disciplined approach relative to peers. It also details investments focused on talent and capabilities, alongside technology modernization efforts. The data and content suggest its use in financial and operational strategy discussions, highlighting cost management while investing for future growth.
Expense Management, Investment, Future Growth, Comparative Analysis, Strategy, Financial Services, Technology Modernization, Talent Development
false
Consistent and disciplined expense management while still investing for future outperformanceGoldman Sachs U.S. Financial Services Conference
Mixed Chart
Goldman Sachs
View slide
The slide features two column charts. The left chart shows MSCI India earnings growth estimates by sector for 2024 and 2025, while the right chart shows MSCI India price-to-earnings ratios by sector.
Financial Performance
Financial Services
This slide discusses sector earnings and valuations in India, providing earnings growth estimates and price-to-earnings ratios for various sectors. It is used for financial performance analysis and investment planning.
India, sector earnings, valuations, MSCI, price-to-earnings, financial performance, investment planning
false
India: Sector earnings and valuationsGuide to the Markets Asia | 2Q 2024
Multiple Chart
JP Morgan
View slide
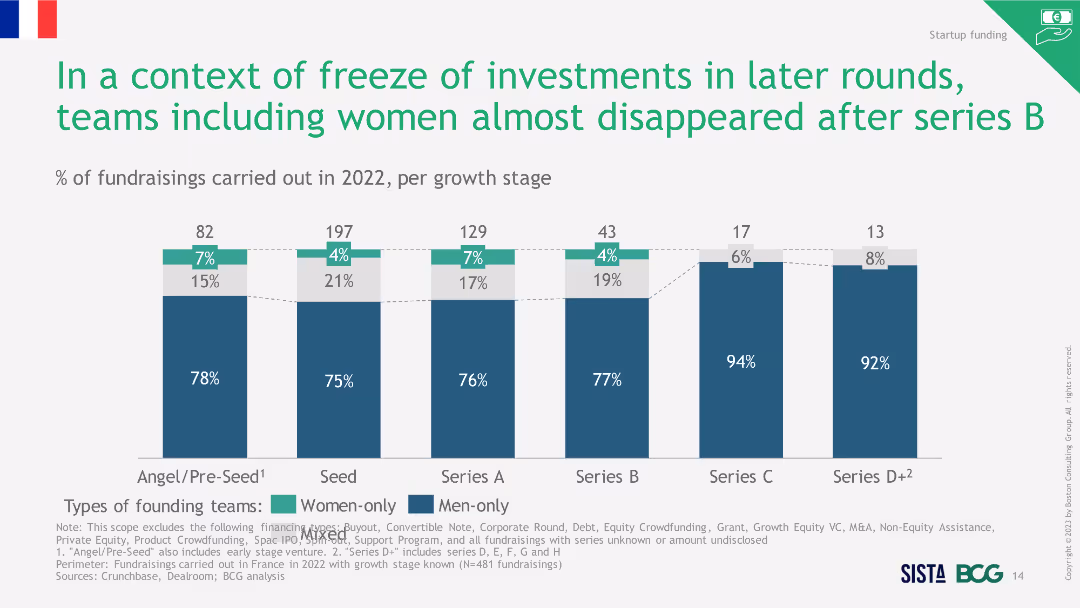
Column chart showing percentage of fundraisings in 2022 per growth stage. The slide uses a combination of blue and green bars to differentiate between women-only, men-only, and mixed founding teams.
Investment Analysis
Financial Services
This slide highlights the declining trend in fundraisings involving women after Series B funding stages in 2022. It shows the percentage distribution of different team types across various growth stages.
Fundraising, Investment, Women, Teams, Stages
false
In a context of freeze of investments in later rounds, teams including women almost disappeared after series BWomen-led startups losing across the board: from creation to funding, in all key European markets
Single Chart
BCG
View slide
This slide is a visual summary with three sets of paired bar graphs showing the current coverage of financial services against the total eligible employees in executive, personal, and wellness financial management. The graphs use shades of blue with white text.
Operational Efficiency
Financial Services
Displays the extent of financial management services provided by Goldman Sachs to corporate employees, relative to the total eligible. It is useful for discussions on market penetration and service expansion strategies within corporate financial management sectors.
Corporate, Financial Management, Employees, Coverage
false
Asset Management and Wealth Management: Workplace and Personal Wealth: Serving Corporate Employees End-to-EndGoldman Sachs Presentation to Bernstein Strategic Decisions Conference
Mixed Chart
Goldman Sachs
View slide
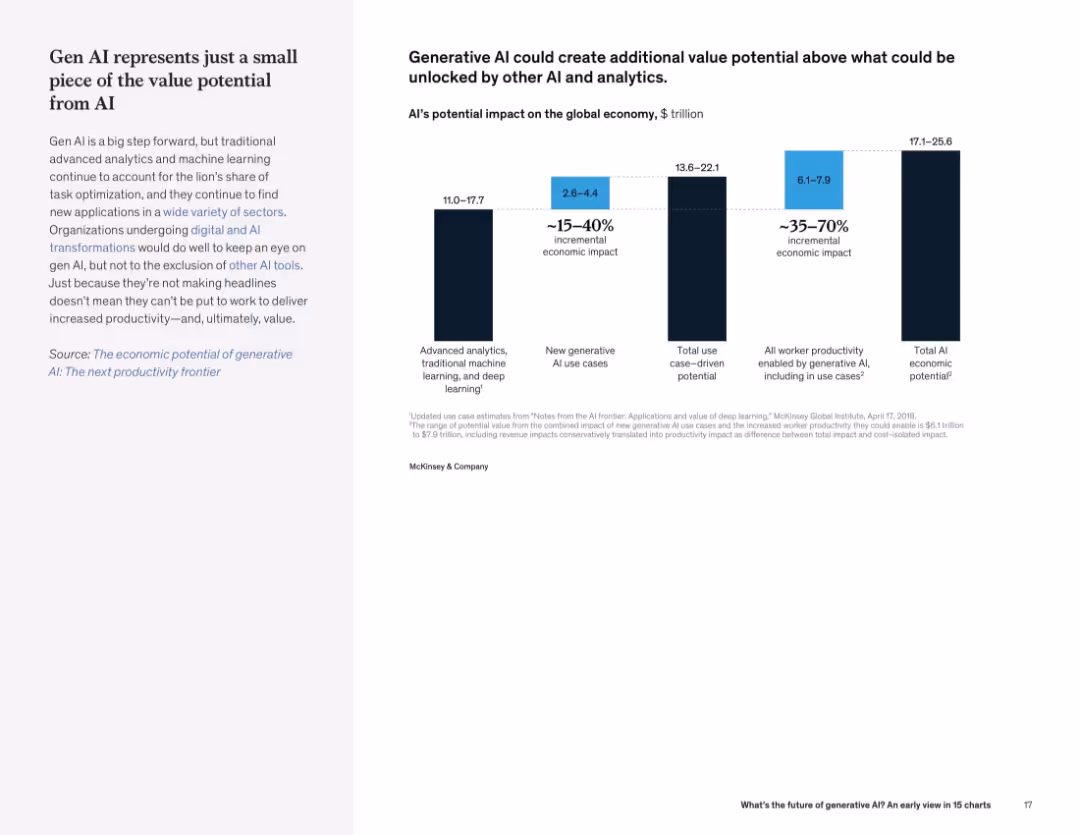
Left text description with bar chart on right showing estimated economic value from various AI categories, including gen AI.
Investment Analysis
Artificial Intelligence
Generative AI, while impactful, is part of a larger AI ecosystem. Traditional AI methods still contribute the majority of economic value. The slide quantifies the incremental and total economic potential.
AI value, economic impact, generative AI, analytics, investment potential, productivity
false
Generative AI could create additional value potential above what could be unlocked by other AI and analyticsWhat’s the future of generative AI? An early view in 15 charts
Mixed Chart
McKinsey
View slide
A set of icons and key focus areas represent shifts in platform strategy with clear demarcation between core and adjacent services. The layout is organized with a balance of text and visuals.
Operational Efficiency
Technology & Software
Discusses strategic realignment of online platforms, indicating a pivot in core operations and adjacent areas, providing insights into market adaptations and focus shifts within the industry.
online platforms, strategy, core, adjacencies
false
Online platforms are refocusing on core and select adjacenciese-Conomy SEA 2020 At full velocity: Resilient and racing ahead
Header Vertical
Bain
View slide
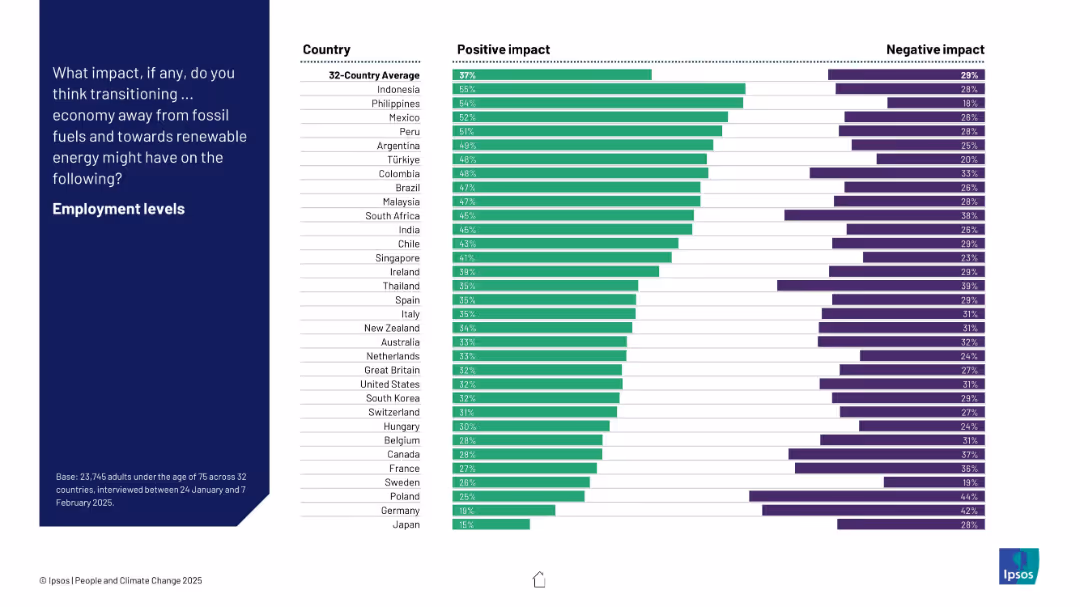
Country-wise bar chart comparing positive vs. negative expectations about the effect of energy transition on employment.
Technology and Digital Transformation
Environmental Services & Sustainability
The slide compares national perceptions of employment impact due to a shift to renewable energy. While countries like Indonesia and the Philippines show high optimism, nations like Germany and Japan are more skeptical about job creation benefits.
employment, energy transition, perception, renewables, survey, country comparison, Ipsos, bar chart
false
What impact, if any... Employment levelsPEOPLE AND CLIMATE CHANGE
Mixed Chart
IPSOS
View slide
The slide displays a column chart comparing reasons for not purchasing crypto assets between 2022 and 2023, with bars indicating percentage responses.
Risk Assessment and Management
Financial Services
It outlines the main reasons for avoiding crypto investments, such as perceived risk, lack of understanding, and concerns about volatility and security.
Crypto assets, non-purchase, reasons, risk, 2023, 2022, security, volatility, understanding, concerns
false
Reason(s) Given For Not Purchasing Any Crypto AssetsCRYPTO ASSET SURVEY 2023
Multiple Chart
IPSOS
View slide
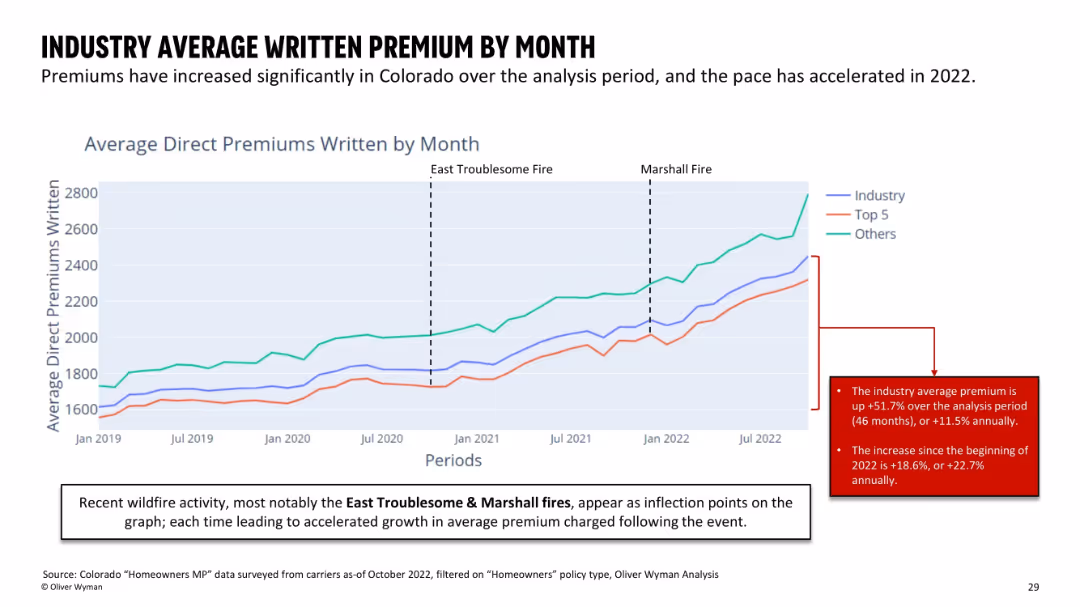
Line chart with three data series (Industry, Top 5, Others) showing premium growth over time; key fire events are annotated.
Financial Performance
Financial Services
Tracks the growth in average direct premiums from 2019 to 2022, with notable surges following the East Troublesome and Marshall wildfires. The slide emphasizes accelerated premium increases in 2022, especially post-disaster.
premiums, insurance pricing, wildfire impact, Colorado, cost increase
false
INDUSTRY AVERAGE WRITTEN PREMIUM BY MONTHHomeowner availability study
Mixed Chart
Oliver Wyman
View slide
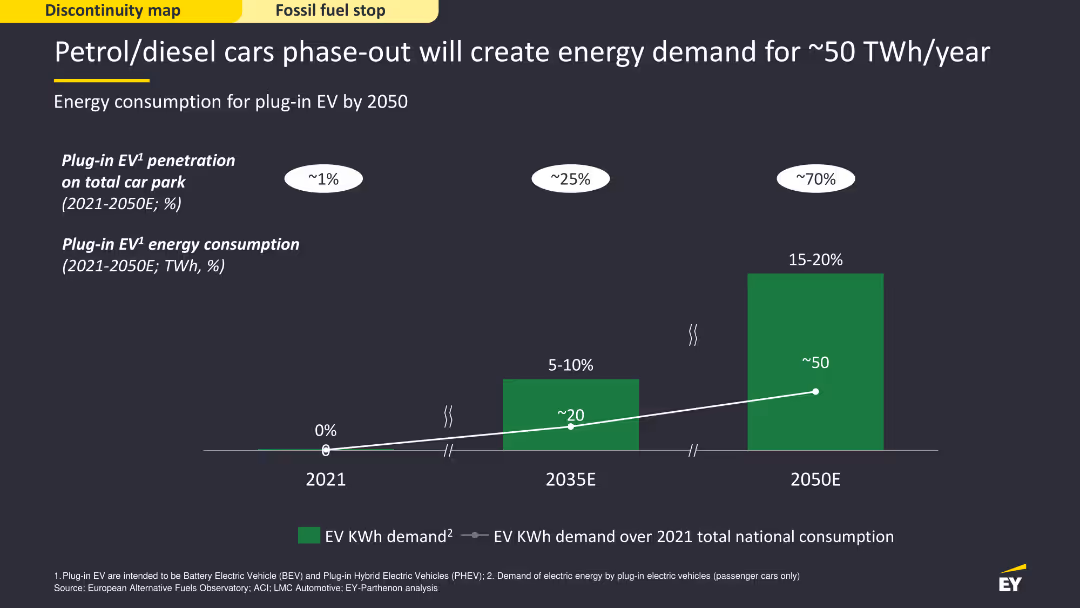
The slide features a column chart showing the projected energy consumption for plug-in electric vehicles (EV) from 2021 to 2050. The chart uses green bars and a dark background to display data clearly, with projections marked for significant future years. The layout is visually simple but informative, focusing on the energy demand increase.
Strategic Planning
Energy & Utilities
The slide forecasts the energy demand created by phasing out petrol/diesel cars, projecting the consumption for plug-in EVs up to 2050. It shows how EV penetration will grow, leading to a significant rise in energy requirements, emphasizing the need for strategic energy planning to accommodate this shift.
EV, energy demand, petrol, diesel, phase-out
false
Petrol/diesel cars phase out will create energy demand for ~50 TWh /yearEnergy Summit Energy reset: a view of the challenge and of the available solutions
Single Chart
EY
View slide
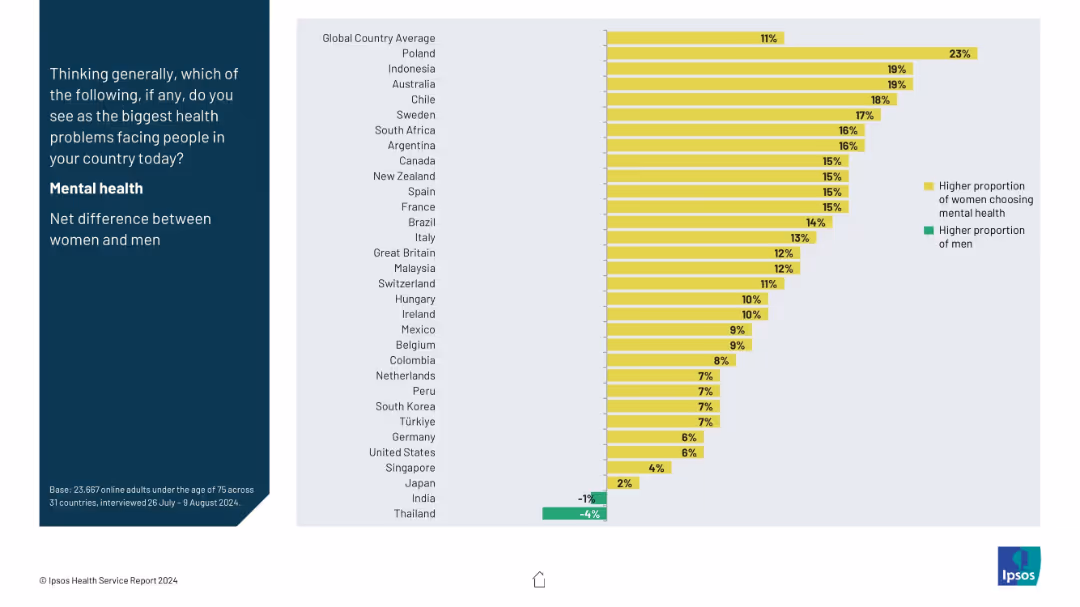
Split-panel layout with a vertical question prompt on the left in a dark blue block, and a horizontal bar chart on the right side using yellow and green bars.
Market Analysis and Trends
Healthcare & Pharmaceuticals
This slide shows the gender-based net difference in selecting mental health as the biggest health concern across countries. Yellow bars represent higher female concern, while green shows male. Poland leads with the highest female-male gap, while Thailand has a higher male concern rate.
mental health, gender gap, health perception, global comparison, survey
false
Mental healthIPSOS HEALTH SERVICE REPORT 2024
Mixed Chart
IPSOS
View slide
Features column charts and icons representing various contact channels used in customer service, with emphasis on digital and traditional methods. The slide is well-organized with a modern design, employing light blue and green colors.
Technology and Digital Transformation
Telecommunications
Highlights the current usage and investment trends in different customer service channels, particularly in digital transformation. Offers valuable insights for telecommunications and service-oriented companies looking to enhance customer interaction through technological advancements.
contact channels, customer service, digital transformation, investment trends, telecommunications
false
Deep dive on contact channelsCustomer Service Excellence 2022
Multiple Chart
Deloitte
1
...
Next
Load More
Hold On!
We are searching in our database
If nothing, comes up, please try different filters!
Create a FREE account to continue browsing
Receive Instant Access to 1,000+ slides from companies like McKinsey, Google, and Goldman Sachs
First Name
Last Name
Email
Password
I agree to all
Terms & Privacy Policy
Thank you! Your submission has been received!
Oops! Something went wrong while submitting the form.
Have an account?
Sign in
Column Chart
Heatmap
Chevron
Org Chart
Infographic
Callouts
Timeline
List
Graphic
Picture
Process Flow
Diagram
Paragraph
Map
Table
Framework
Subtitle
Takeaway Box
Icon
Other Chart
Radar Chart
Waterfall Chart
Mekko Chart
Pie Chart
Scatter Plot
Line Chart
Bar chart
Bullet points