SELECT YOUR MODE
Charts, diagrams, frameworks, and more. Download individual slides in PowerPoint or Google Slides format. Mix and match to build your perfect deck.


PRO
Simple grid layout with six identical rows, each with a number and placeholder text. Minimal design with consistent spacing and alignment.
PRO
Grid-based quote layout with four separate bordered boxes and open quotation marks.
PRO
Dark background slide with a vertical, icon-guided flow showing three stages: Strategy, Execution, Optimization.

PRO
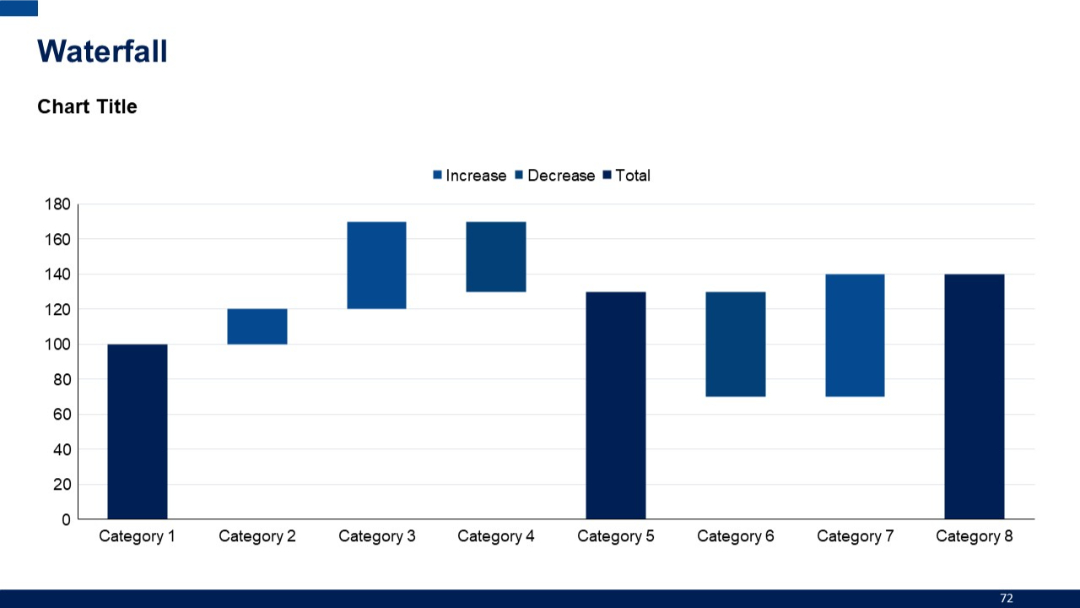
Waterfall chart with multiple bars indicating increases and decreases across categories. Minimalistic layout with chart title on top left.
PRO
Two-column table with four rows. Each row features a left icon + title in dark green with corresponding text on the right in white space.
PRO
Color-coded grid with rows and columns representing values, legend below with thresholds, top-left title, and dark header row.

PRO
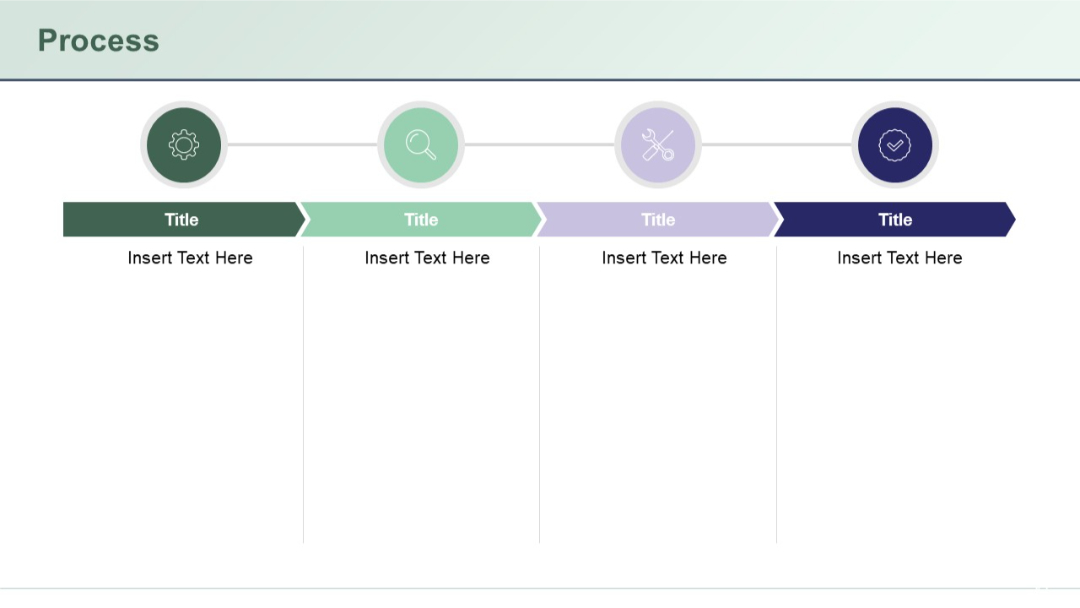
Horizontal process diagram with icons in circles connected by a line, underlined by colored arrow boxes.
PRO
Centered quote with large quotation mark icons and author’s name and initials shown below with a round photo placeholder.

PRO
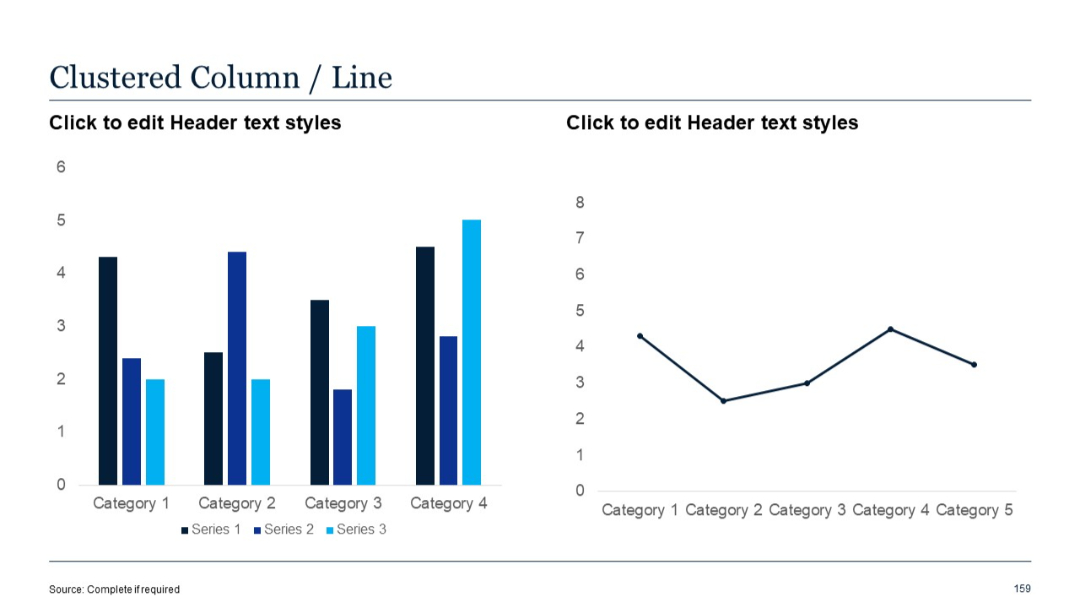
Left chart uses clustered vertical columns; right chart is a line graph. Series are clearly color-separated.
PRO
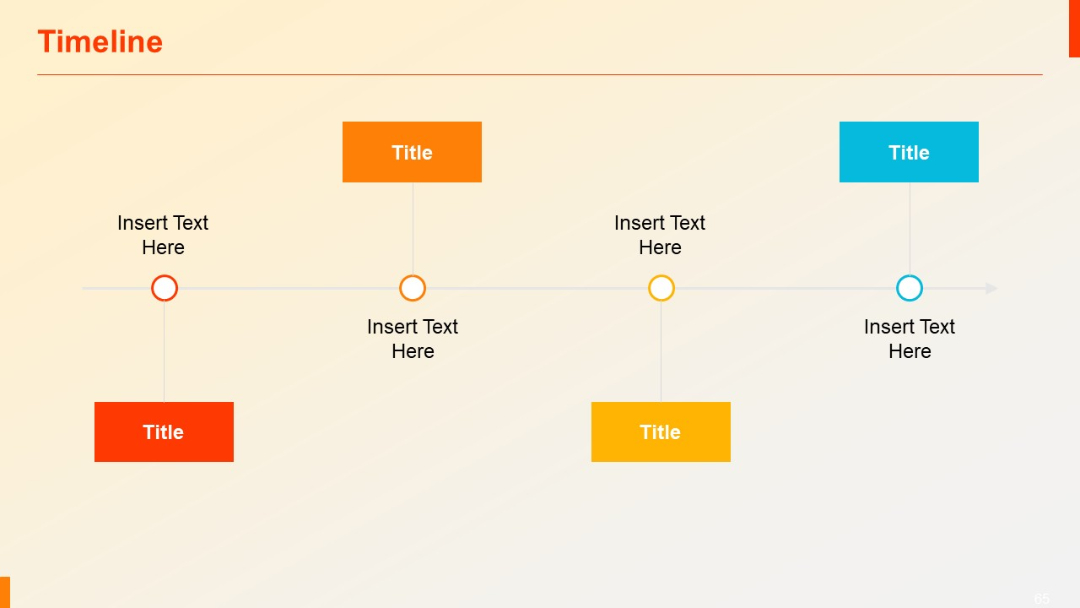
Horizontal timeline with alternating colored rectangular titles above and below a central line.
PRO
Dual-column comparison tables with headers in bold and color-coded columns (purple and red variants). Simple alternating row structure for clarity.

PRO
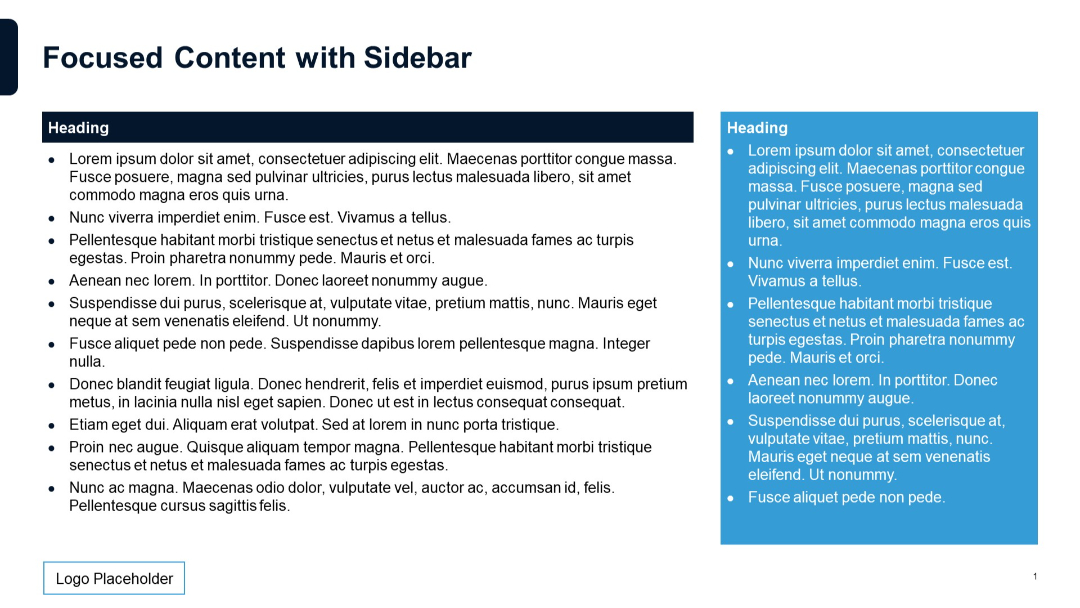
Same layout as previous but sidebar is more visually prominent with a bold blue background.
PRO
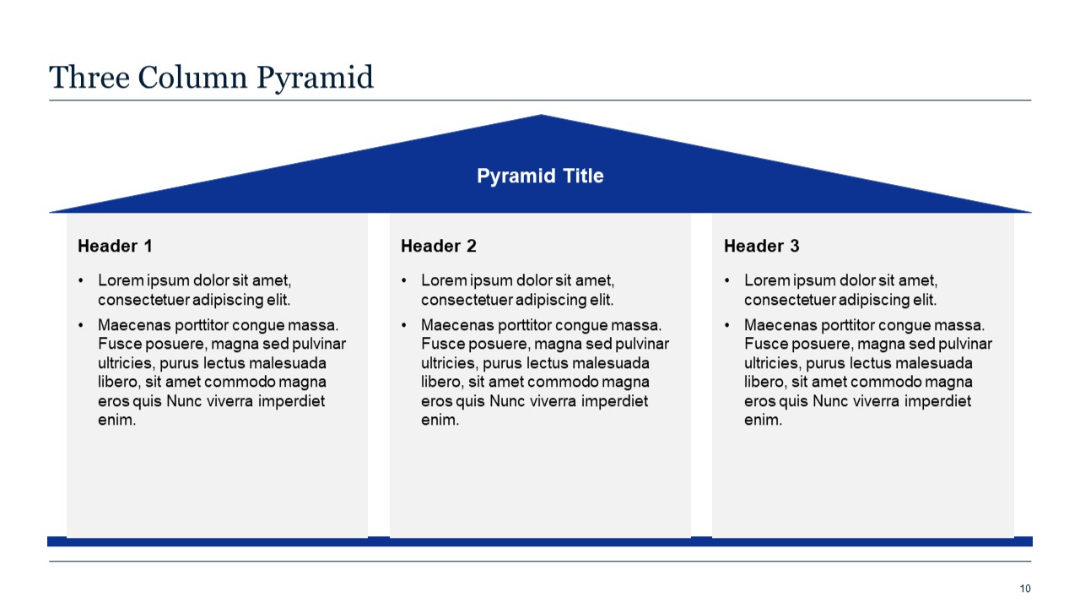
Pyramid-shaped graphic spanning three columns with headers and bullets.
PRO
Visual slide with full-image background of glass building and binary code. Bold section number and title overlay.

PRO
Numbered list layout with colored blocks for numbers on the left and horizontal bars stretching across with text on a white background.

PRO
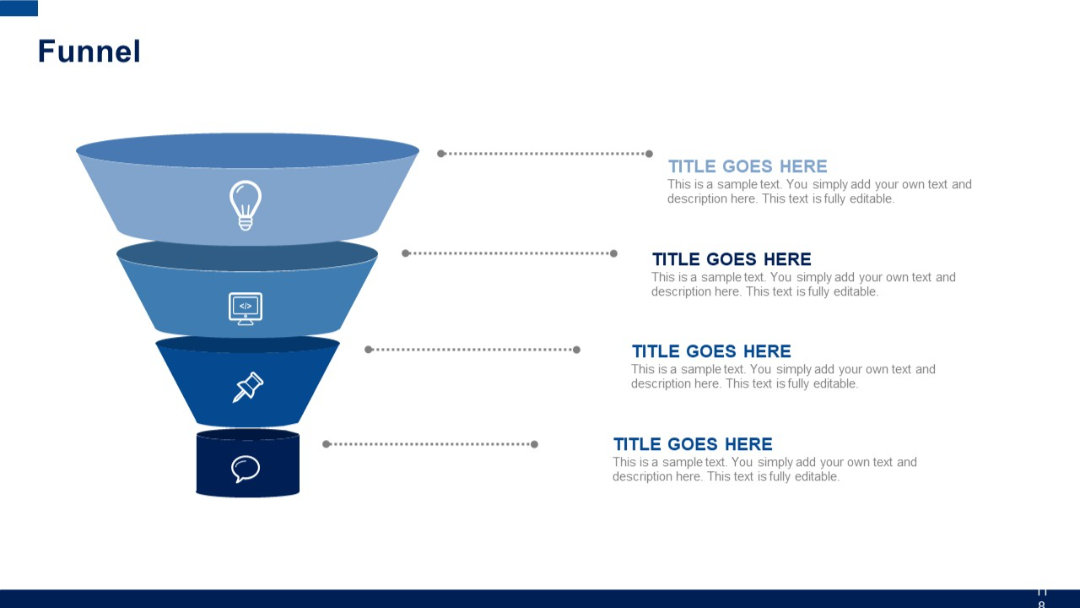
Vertical layered funnel diagram with four funnel levels, each with an icon and aligned descriptive text to the right.
PRO
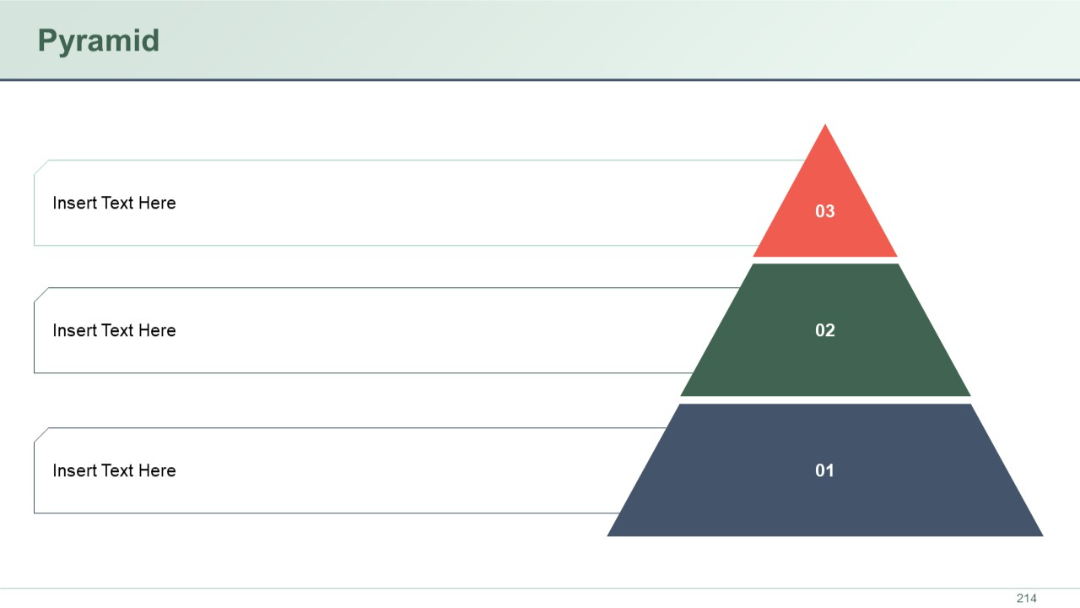
A three-layered right-aligned pyramid with colored blocks labeled 01–03, each level accompanied by aligned text boxes for descriptive content.
PRO
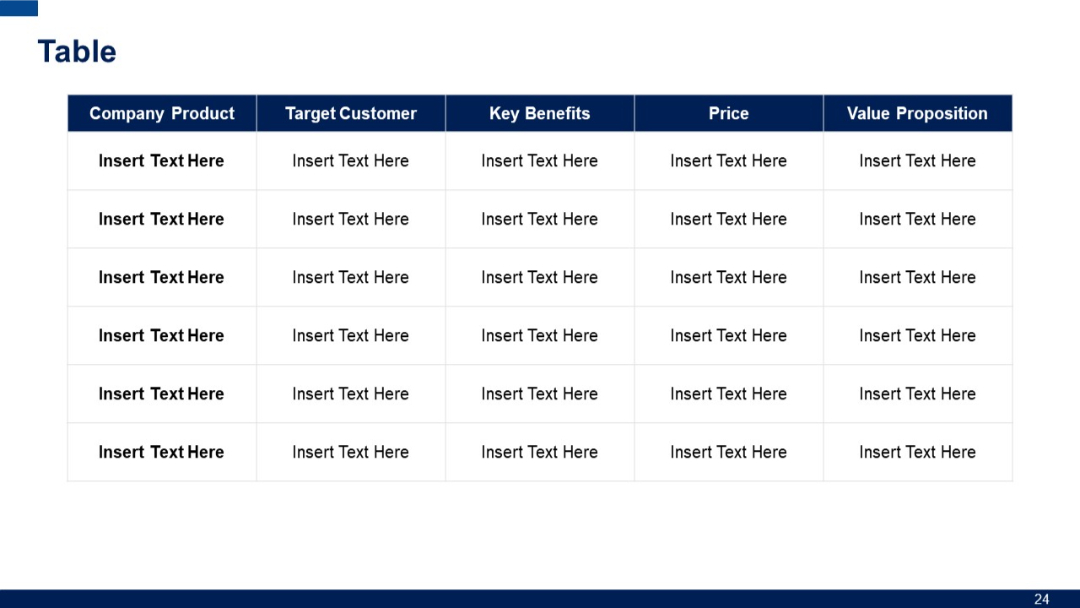
6-row, 5-column table with consistent layout from Slides 22–23, allowing deeper comparative data input.
PRO
Line chart with three data series plotted together across four categories. Uses distinct color lines.

PRO
Section divider slide with "01" in large font and "Qualitative Slides" subtitle below; blue and white horizontal split background.

PRO
Arrow-style segmented process in circular arrangement with six steps labeled and text placeholders.

PRO
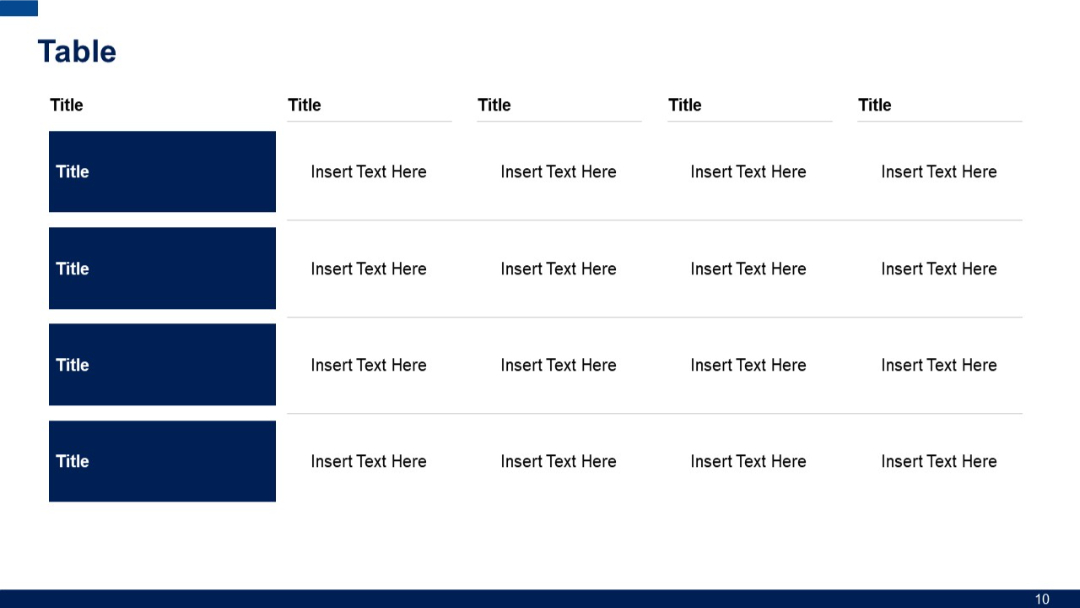
Further extended hybrid layout with four vertical title blocks and matching horizontal data fields; consistent blue-and-white color scheme.
PRO
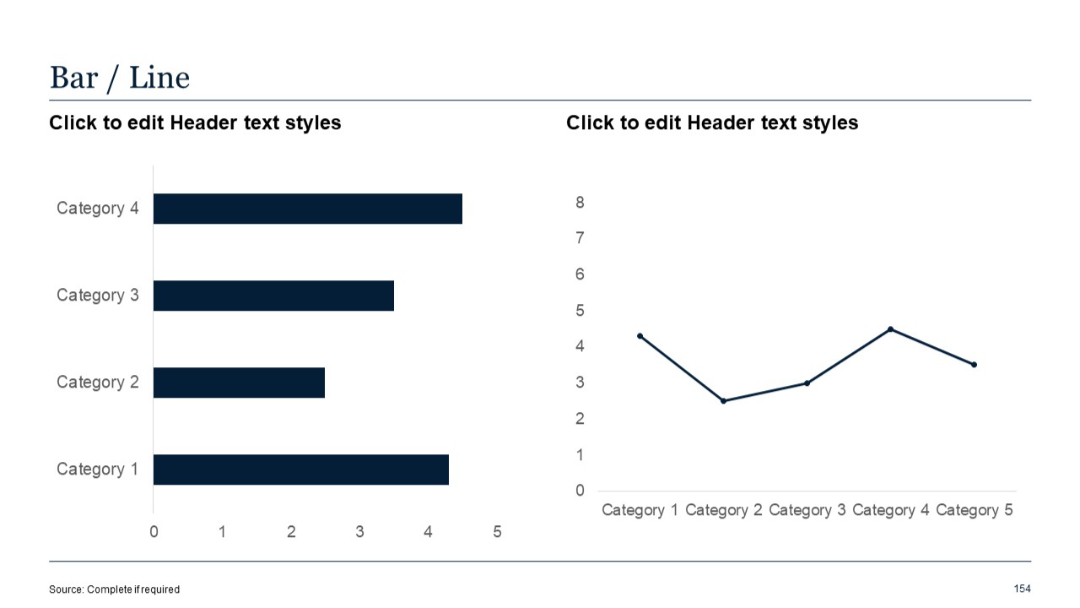
Left chart shows horizontal bars; right chart displays a line graph. Uses basic design with dark blue bars and line.
PRO
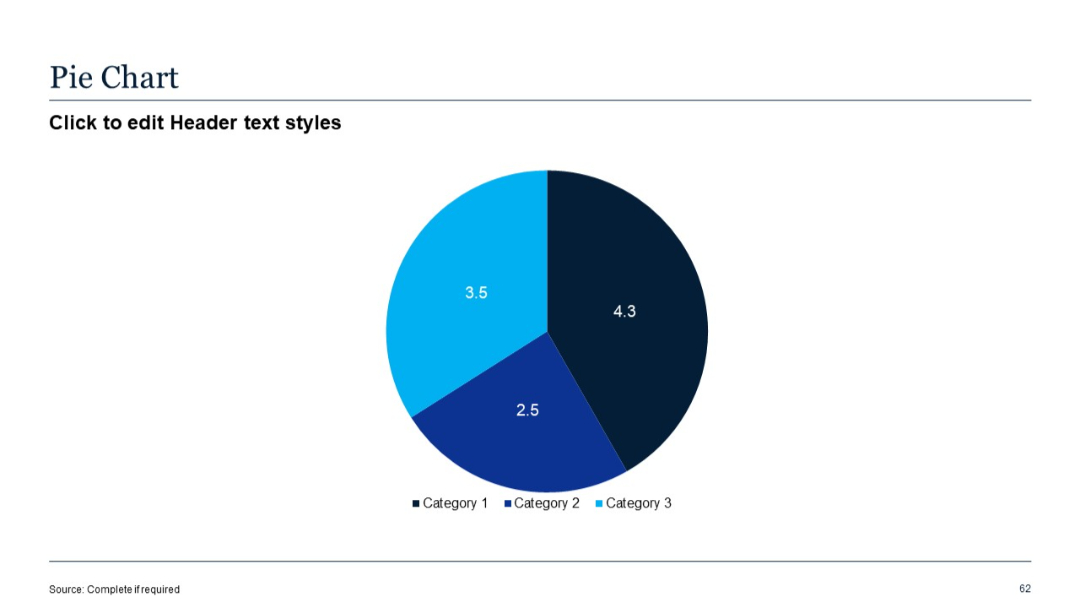
Centered pie chart with three segments in blue shades; minimalistic design with category labels.
PRO
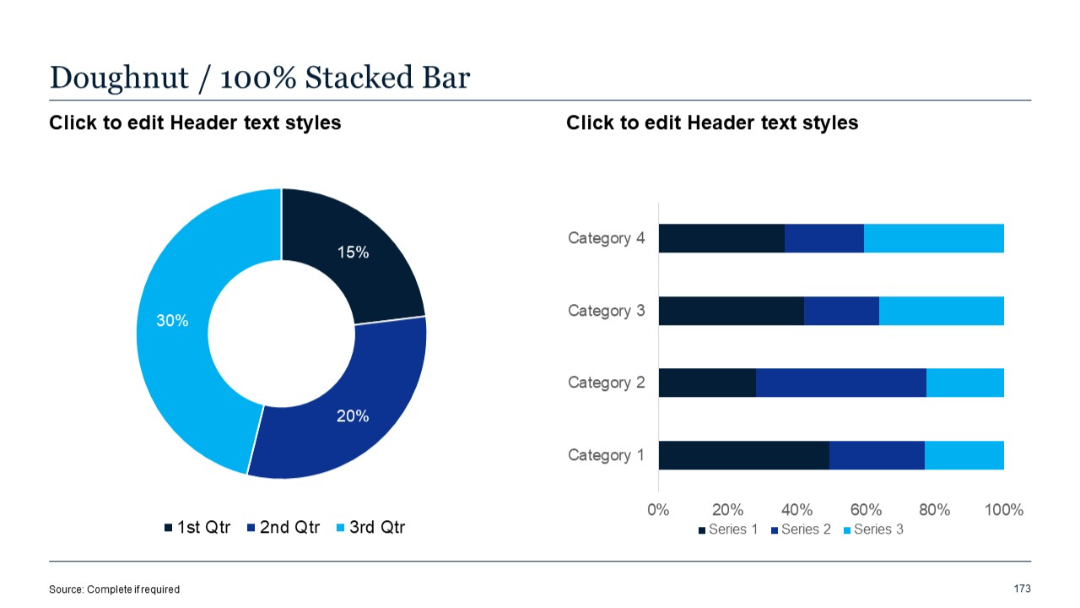
Doughnut chart on the left; 100% stacked horizontal bar chart on the right.
PRO
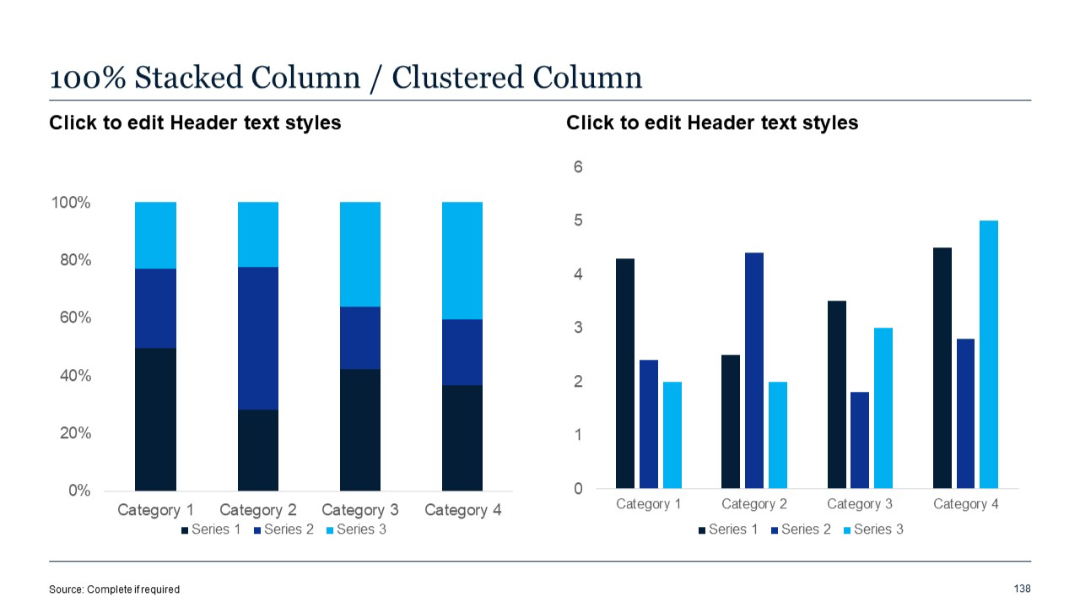
Left chart shows normalized 100% stacked columns; right chart displays clustered columns. Visual contrast in how series data is distributed and displayed.
PRO
Three-part circular infographic with numbered colored sections and matching text boxes placed around the perimeter.

PRO
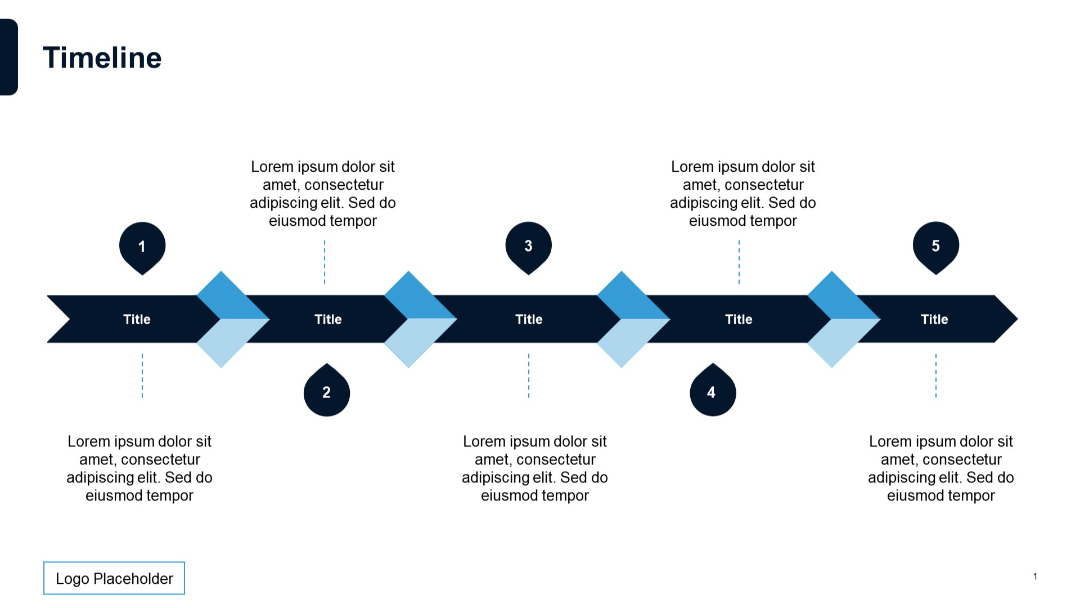
Horizontal arrow timeline with five marked steps, alternating text positions above and below.
PRO
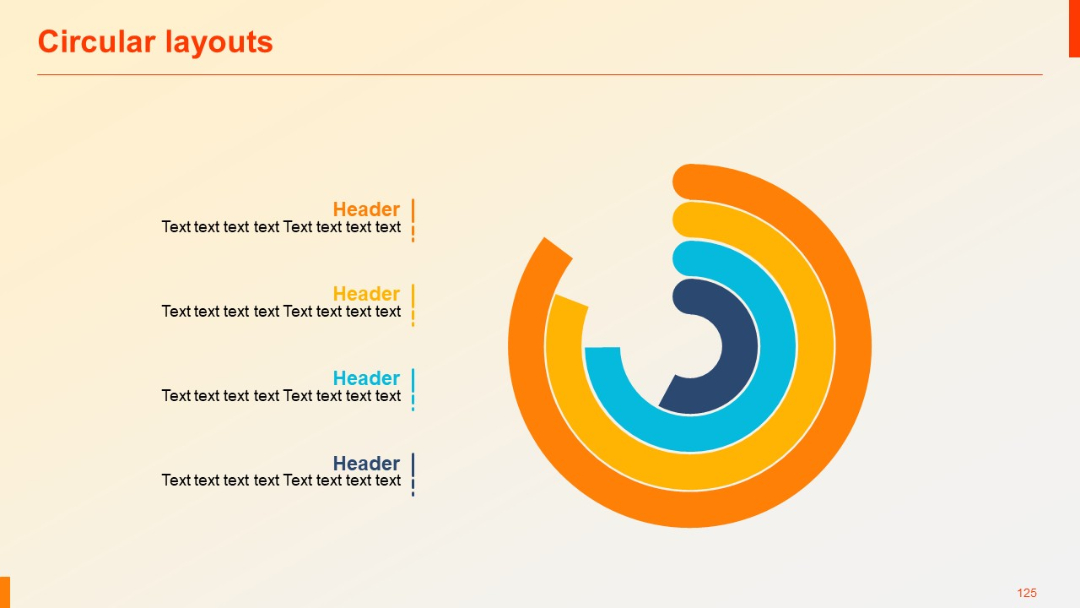
A four-layered radial chart with arc segments in yellow, orange, and blue tones; text headers aligned on the left.
PRO
Split vertical layout with two large columns; each side includes a blue header labeled "Text" and corresponding content below with a title placeholder.